 plumi
Data presentation and interpretation: OCR A‑Level Maths questions
Every OCR A-Level Maths exam question on S.2 Data presentation and interpretation, 2018–2025, with its mark scheme and examiner’s report.
Find questions494





All 32 questions on Data presentation and interpretation, as a list
- June 2025, Paper 2, Q9 (11 marks): Some students in a year-group took two tests, Test 1 and Test 2. The maximum mark in each test was 120. The students’ marks are illustrated in the cumulative fr
- June 2025, Paper 2, Q13 (6 marks): The table shows excerpts from the census data for Age Structure in 2001 and 2011 for four Local Authorities (LAs) in South West England. Age LA Year 0 to 4 5 to
- June 2025, AS Paper 1, Q9 (7 marks): Sasha collected data from 11 students about the time they spent on computer games during the previous week and their marks in a test. The results are represente
- June 2025, AS Paper 1, Q10 (6 marks): Researchers investigated the change in the numbers of people in employment using underground, metro, light rail or tram (UMLRT) between 2001 and 2011. The data
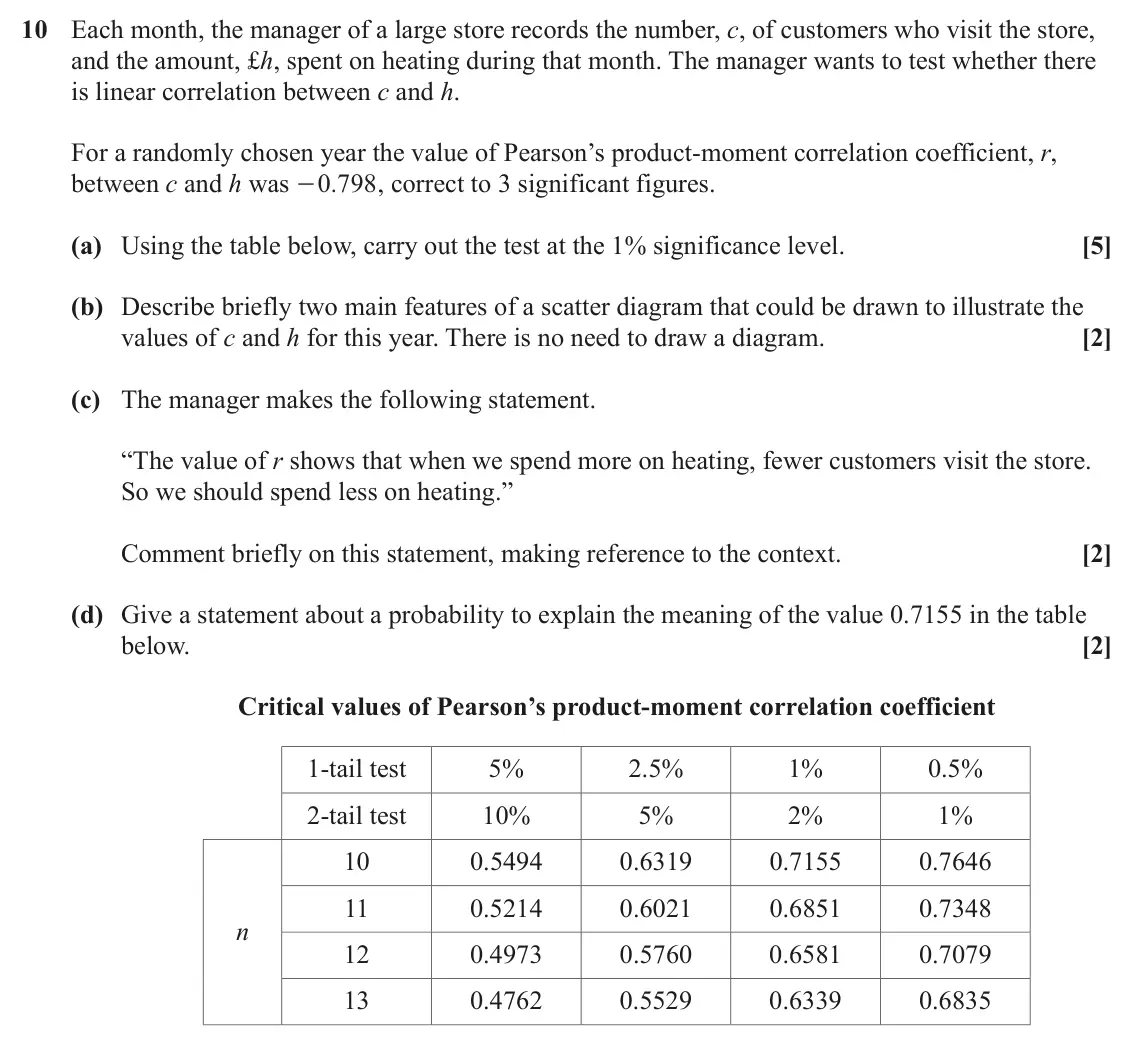
- June 2024, Paper 2, Q10 (11 marks): Each month, the manager of a large store records the number, c, of customers who visit the store, and the amount, £h, spent on heating during that month. The ma
- June 2024, Paper 2, Q11 (8 marks): The chart below represents the percentage increases (PI) in the numbers of employees using four different methods of travel to work from 2001 and 2011, in five
- June 2024, AS Paper 1, Q11 (7 marks): A biased six-sided dice is thrown several times. The results are shown in the table, where a is a constant. Score x 1 2 3 4 5 6 Frequency f 1 3 10 9 0 a You are
- June 2024, AS Paper 1, Q12 (5 marks): The table gives the percentage increases in the numbers of usual residents in five Local Authorities (LAs) in the West Midlands between 2001 and 2011. Age range
- June 2023, Paper 2, Q8 (7 marks): The stem-and-leaf diagram shows the heights, in centimetres, of 15 plants. | 0 | 2 | 1 | 0 | 2 | 4 | 3 | 0 2 4 9 | 4 | 1 2 4 7 9 | 5 | 3 7 | 6 | 2 Key: | 2 | 5
- June 2023, Paper 2, Q13 (10 marks): The scatter diagram uses information about all the Local Authorities (LAs) in the UK, taken from the 2011 census. For each LA it shows the percentage (x) of emp
- June 2023, AS Paper 1, Q7 (5 marks): (a) Two real numbers are denoted by a and b. (i) Write down expressions for the following. • The mean of the squares of a and b • The square of the mean of a an
- June 2023, AS Paper 1, Q10 (9 marks): The masses of a random sample of 120 boulders in a certain area were recorded. The results are summarized in the histogram. Frequency density 35 40 50 55 60 65
- June 2023, AS Paper 1, Q12 (4 marks): This question deals with information about the populations of Local Authorities (LAs) in the North of England, taken from the 2011 census. Fig. 1 Fig. 2 0.4 0.3
- June 2022, Paper 2, Q9 (14 marks): The heights, in centimetres, of a random sample of 150 plants of a certain variety were measured. The results are summarised in the histogram. Frequency density
- June 2022, Paper 2, Q10 (10 marks): The table shows the age structure of usual residents of 18 Local Authorities (LAs) in the North West region of the UK in 2011. Local Age 65 and Age 0 to 17 Age
- June 2022, AS Paper 1, Q8 (4 marks): A random sample of 10 students from a college was chosen. They were asked how much time, x hours, they spent studying, and how much money, £y, they earned, in a
- June 2022, AS Paper 1, Q10 (6 marks): The table shows the increases, between 2001 and 2011, in the percentages of employees travelling to work by various methods, in the Local Authorities (LAs) in t
- November 2021, Paper 2, Q11 (12 marks): Zac is planning to write a report on the music preferences of the students at his college. There is a large number of students at the college. (a) State one rea
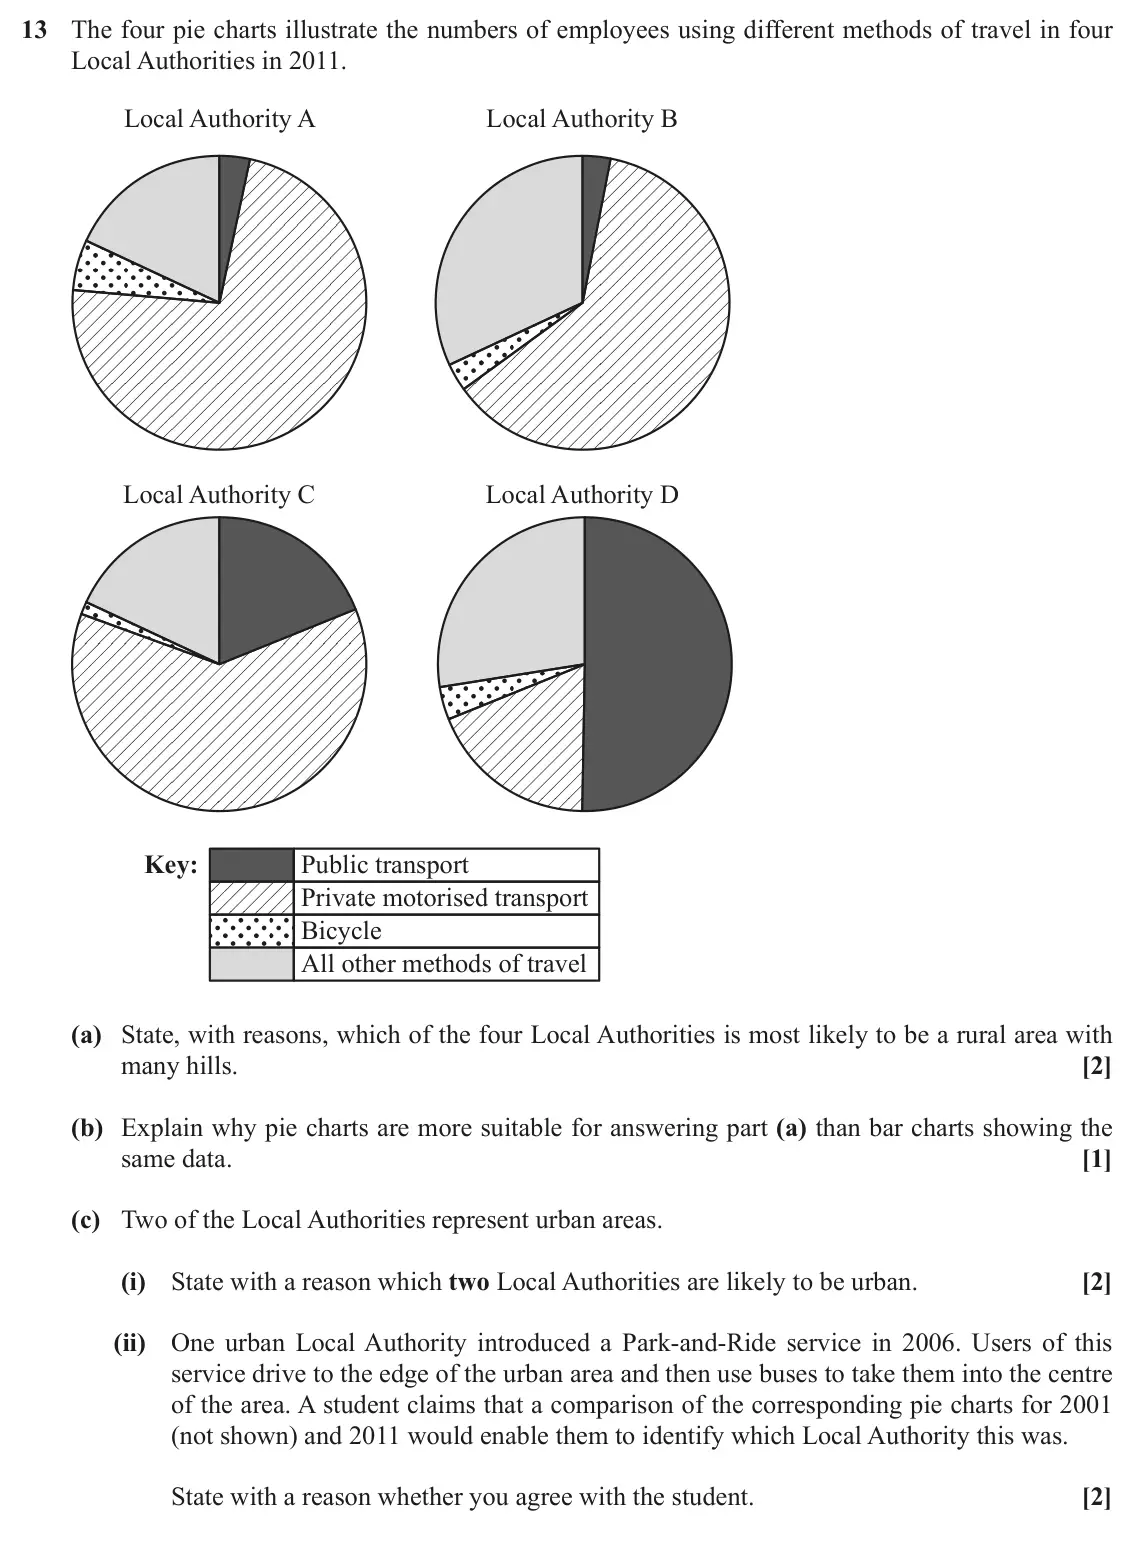
- November 2021, Paper 2, Q13 (7 marks): The four pie charts illustrate the numbers of employees using different methods of travel in four Local Authorities in 2011. Local Authority A Local Authority B
- November 2021, AS Paper 1, Q11 (6 marks): A student is investigating changes in the number of residents in Local Authorities in the South- East Region between 2001 and 2011. The scatter diagram shows th
- November 2020, Paper 2, Q9 (4 marks): The histogram shows information about the numbers of cars in five different price ranges, sold in one year at a car showroom. Frequency density 0.007 0.006 0.00
- November 2020, Paper 2, Q11 (9 marks): As part of a research project, the masses, m grams, of a random sample of 1000 pebbles from a certain beach were recorded. The results are summarised in the tab
- November 2020, Paper 2, Q14 (6 marks): Table 1 shows the numbers of usual residents in the age range 0 to 4 in 15 Local Authorities (LAs) in 2001 and 2011. The table also shows the increase in the nu
- November 2020, AS Paper 1, Q8 (5 marks): The histogram shows information about the lengths, l centimetres, of a sample of worms of a certain species. Frequency density 0 1 2 3 4 5 6 7 8 9 10 Length (lc
- November 2020, AS Paper 1, Q9 (8 marks): A researcher is studying changes in behaviour in travelling to work by people who live outside London, between 2001 and 2011. He chooses the 15 Local Authoritie
- June 2019, Paper 2, Q8 (6 marks): The stem-and-leaf diagram shows the heights, in centimetres, of 17 plants, measured correct to the nearest centimetre. 5 5 7 9 9 6 3 4 5 5 5 9 9 7 4 5 7 9 9 8 9
- June 2019, Paper 2, Q11 (8 marks): A trainer was asked to give a lecture on population profiles in different Local Authorities (LAs) in the UK. Using data from the 2011 census, he created the fol
- June 2019, AS Paper 1, Q8 (3 marks): (a) Joseph drew a histogram to show information about one Local Authority. He used data from the “Age structure by LA 2011” tab in the large data set. The table
- June 2019, AS Paper 1, Q9 (4 marks): The table shows information about the number of days absent last year by students in class 2A at a certain school. Number of More 0 1 2 to 4 5 to 10 11 to 20 21
- June 2019, AS Paper 1, Q10 (6 marks): The table shows extracts from the “Method of travel by LA” tabs for 2001 and 2011 in the large data set. Local Underground, Bus, Motorcycle, All people in Drivi
- June 2018, Paper 2, Q11 (6 marks): Christa used Pearson’s product-moment correlation coefficient, r, to compare the use of public transport with the use of private vehicles for travel to work in
- June 2018, AS Paper 1, Q13 (7 marks): The radar diagrams illustrate some population figures from the 2011 census results. Liverpool Rutland 1 1 150000 10000 100000 100000 6 2 6 2 5000 5000 50000 500
Questions, mark schemes and examiner’s reports are © OCR, from their published past papers. Plumi isn’t affiliated with any exam board. Want whole papers? Every OCR A-Level Maths paper.
Rather write your answers by hand on iPad? Plumi marks them against the same mark schemes.