 plumi
Measuring distribution and abundance: OCR A‑Level Biology A questions
OCR A-Level Biology A past-paper questions on 6.3.1.5 Measuring distribution and abundance, 2016–2025, with mark schemes and examiner’s reports where available.
Paper
All papers
Exam
All years
Calculations
Q20(a)(i)
The whole paper ↗
Q20(a)(ii)
The whole paper ↗Q20(a)(iii)
The whole paper ↗Q20(a)(i)
The whole paper ↗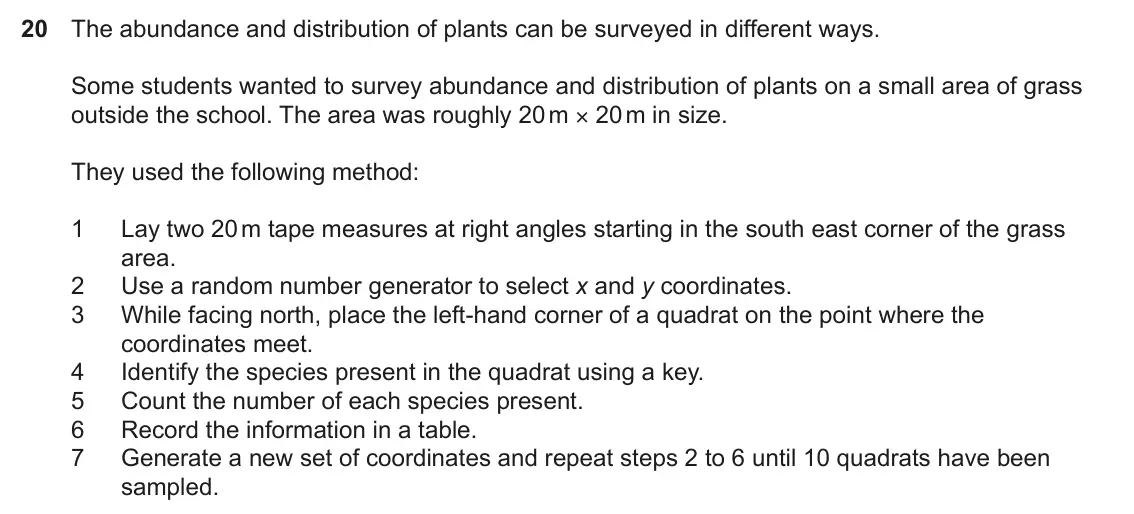
Q20(a)(ii)
The whole paper ↗Q20(c)(i)
The whole paper ↗Q20(c)(ii)
The whole paper ↗Q5(b)(i)
The whole paper ↗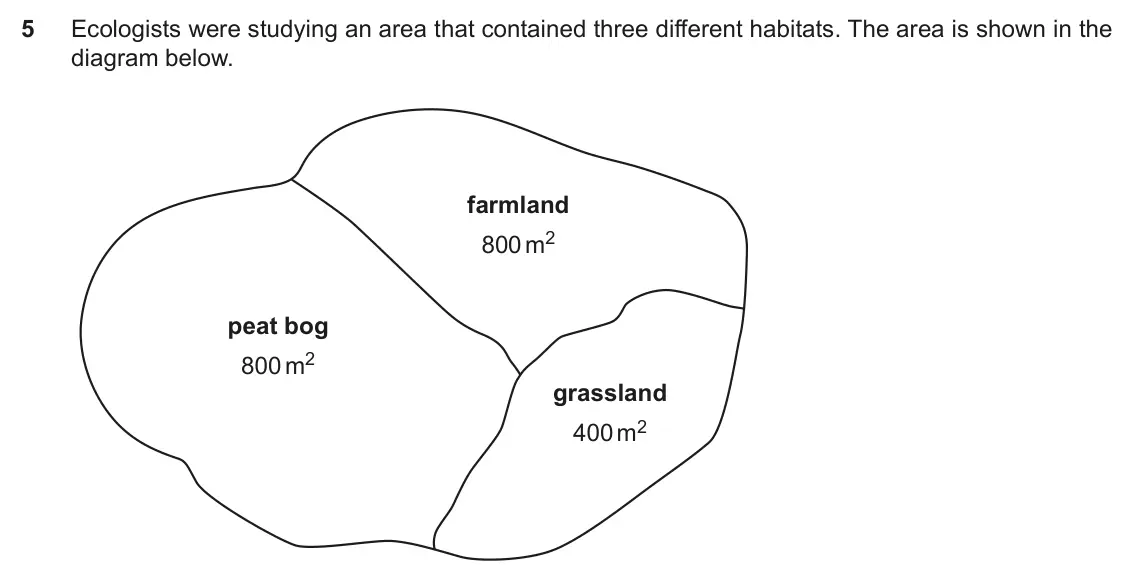
Q5(b)(ii)
The whole paper ↗- Your answer
Q5(c)(ii)
The whole paper ↗
Q16(a)(i)
The whole paper ↗
Q16(a)(ii)
The whole paper ↗Q16(a)(iii)
The whole paper ↗
All 14 questions on Measuring distribution and abundance, as a list
- June 2024, Paper 2, Q20(a)(i) (3 marks): 2 / ( O E ) - 2 Use the equation | = E You may use the empty columns in the table to help with your calculation. |2 = [3]
- June 2024, Paper 2, Q20(a)(ii) (3 marks): The critical value for |2 in this investigation at p = 0.05 is 5.991. Discuss what can be concluded from the |2 calculation in part (a)(i). [3]
- June 2024, Paper 2, Q20(a)(iii) (2 marks): The teacher suggested that, in order to have confidence in their results, the students should include data from more than one tree for each species. The student
- June 2022, Paper 2, Q20(a)(i) (1 mark): Suggest an improvement to the method that would allow the distribution of plants to be measured. [1]
- June 2022, Paper 2, Q20(a)(ii) (2 marks): Identify a limitation with step 3 of the students’ method and explain why this limitation might affect the data collected. [2]
- June 2022, Paper 2, Q20(c)(i) (1 mark): Suggest one other advantage of using an ACFOR rating scale for the students’ survey. [1]
- June 2022, Paper 2, Q20(c)(ii) (1 mark): Suggest one limitation of using an ACFOR rating scale, instead of quadrat sampling, to rate the abundance of plant species. [1]
- November 2020, Paper 3, Q5(b)(i) (2 marks): Calculate the population sizes of the two insect species using each of the formulae below. Write your answers in the table. population size = n1 × n2 Lincoln es
- November 2020, Paper 3, Q5(b)(ii) (2 marks): The Lincoln and Chapman formulae give different estimates for population size. Give two further conclusions about the difference in population estimates given b
- June 2019, Paper 2, Q10 (1 mark): Barnacles are small animals that live on rocky shores. Adult barnacles are fixed to rocks and do not move about. They catch passing food in the water with modif
- June 2018, Paper 3, Q5(c)(ii) (3 marks): Suggest how the scientist could achieve the following during their investigation: Sample all stages of succession in the habitat Minimise sampling bias Sample i
- June 2017, Paper 2, Q16(a)(i) (2 marks): Suggest why it was not appropriate to estimate the number of jaguars using the capture-recapture technique. [2]
- June 2017, Paper 2, Q16(a)(ii) (4 marks): Most studies estimate the population density of jaguars in the South American rainforest to be 5 individuals per 100 km2. In the 2007 study: 100 camera traps we
- June 2017, Paper 2, Q16(a)(iii) (2 marks): Other evidence used to estimate the jaguar population includes footprints and reports of sightings by local humans. Suggest one disadvantage of each of these me
Questions, mark schemes and examiner’s reports are © OCR, from their published past papers. Plumi isn’t affiliated with any exam board. Want whole papers? OCR A-Level Biology A past papers, or our free OCR-style practice pack.
The Plumi iPad app also offers exam-style questions with AI feedback on your handwritten working.