Skip to content
Android waitlistTry on iPad
Get started

Equilibrium price and output: Eduqas A‑Level Economics questions

Eduqas A-Level Economics past-paper questions on Equilibrium price and output, 2016–2025, with mark schemes and examiner’s reports where available.

Paper
All papers
Exam
All years
Calculations

Loading the full question list…

678 questions

  1. Q1(a)

    June 2025 · AS Component 2

    The whole paper ↗
    1
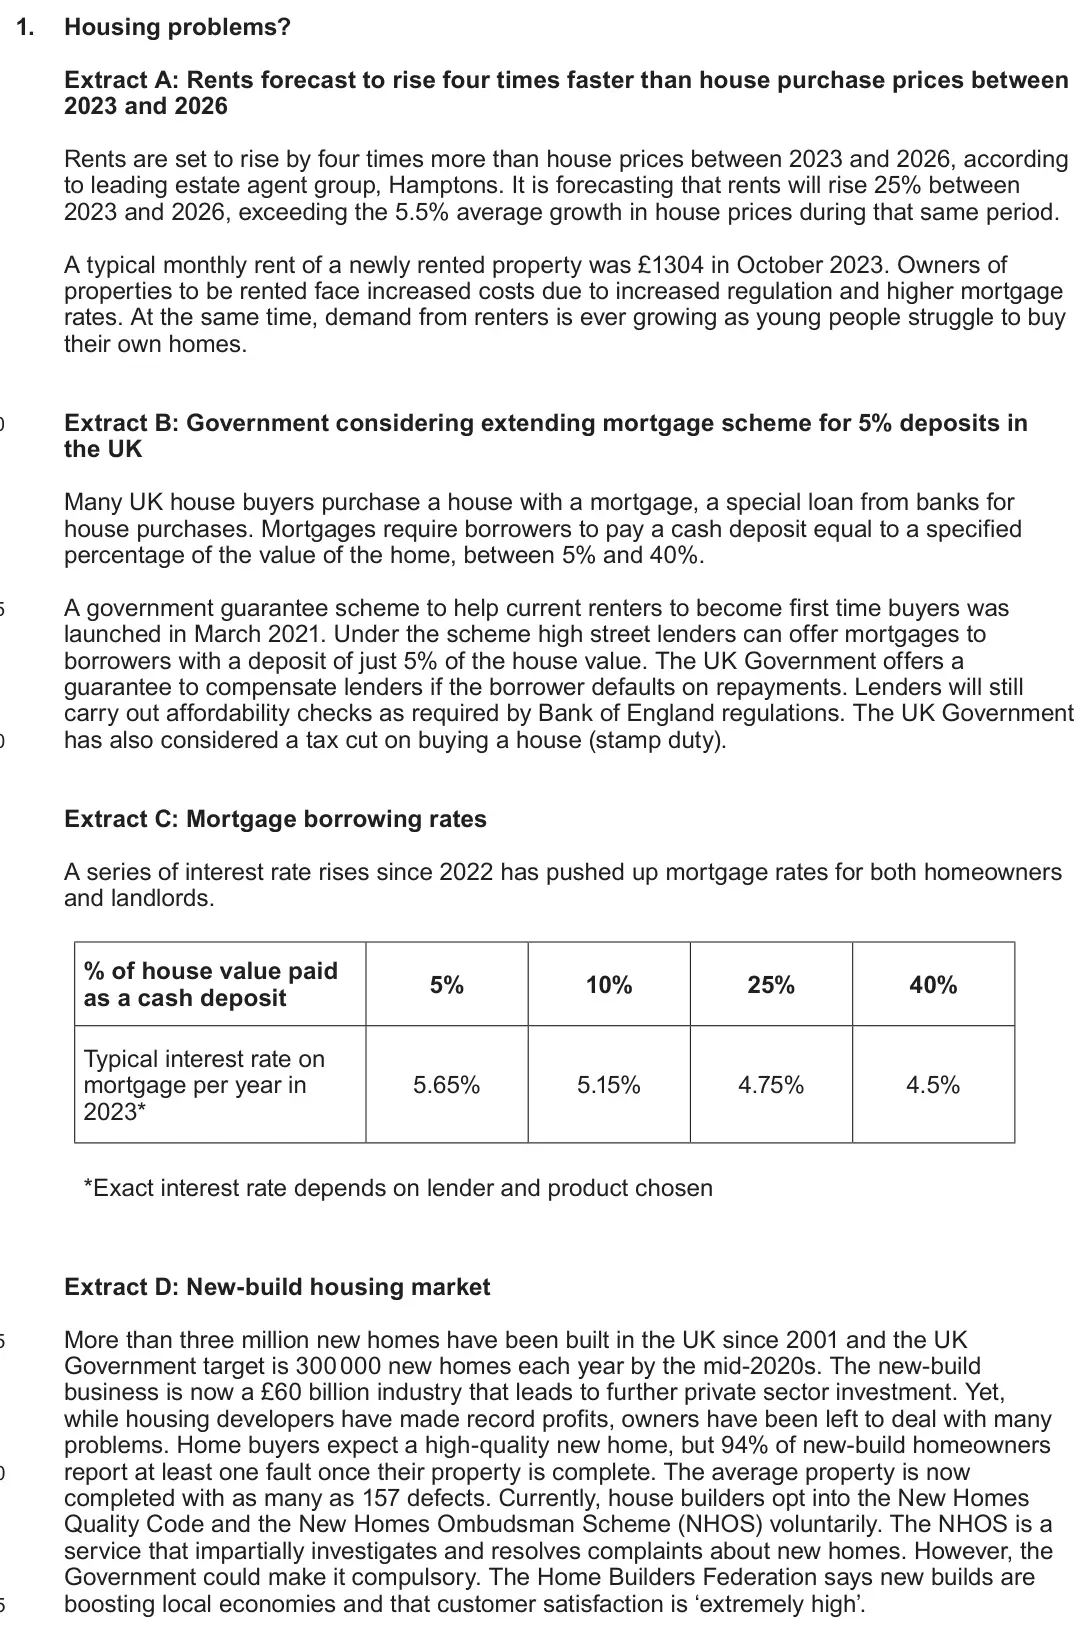
    Setup for original question 1(a)

    Loading the question setup…

    Original question 1(a): Using Extract A and a demand and supply diagram(s), outline why rents were

    Loading the question…

  2. Q1(b)(ii)

    June 2025 · AS Component 2

    The whole paper ↗
    2
    Setup for original question 1(b)(ii)

    Loading the question setup…

    Original question 1(b)(ii): Evaluate whether interest rates are the most significant factor that determines the

    Loading the question…

  3. Q26

    June 2024 · Component 1

    The whole paper ↗
    3
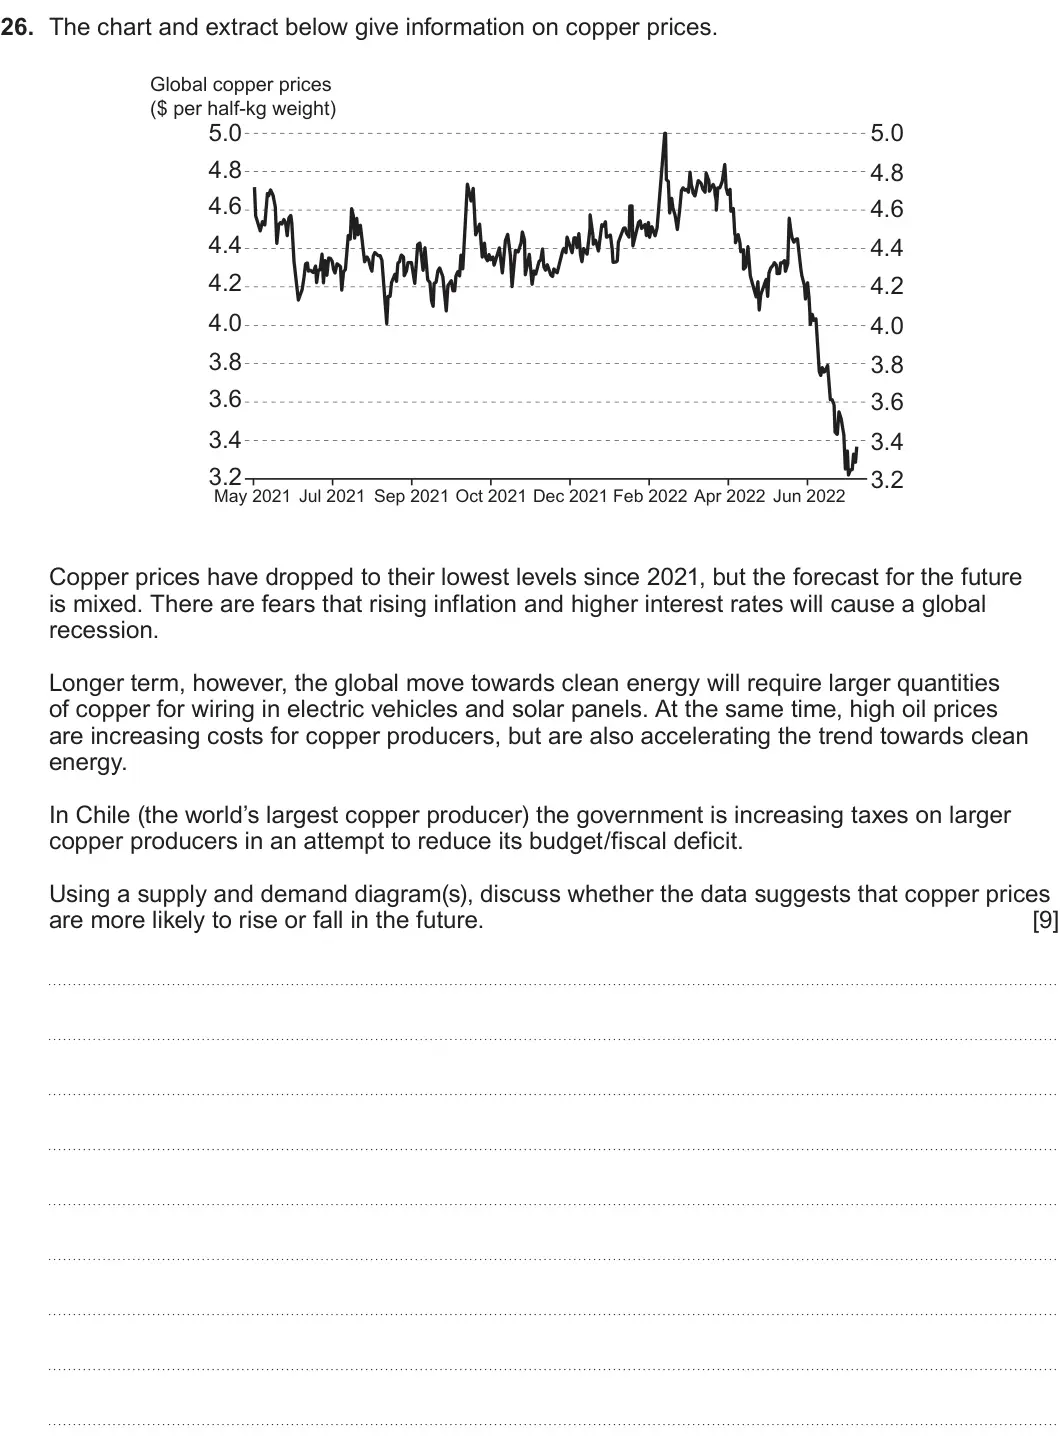
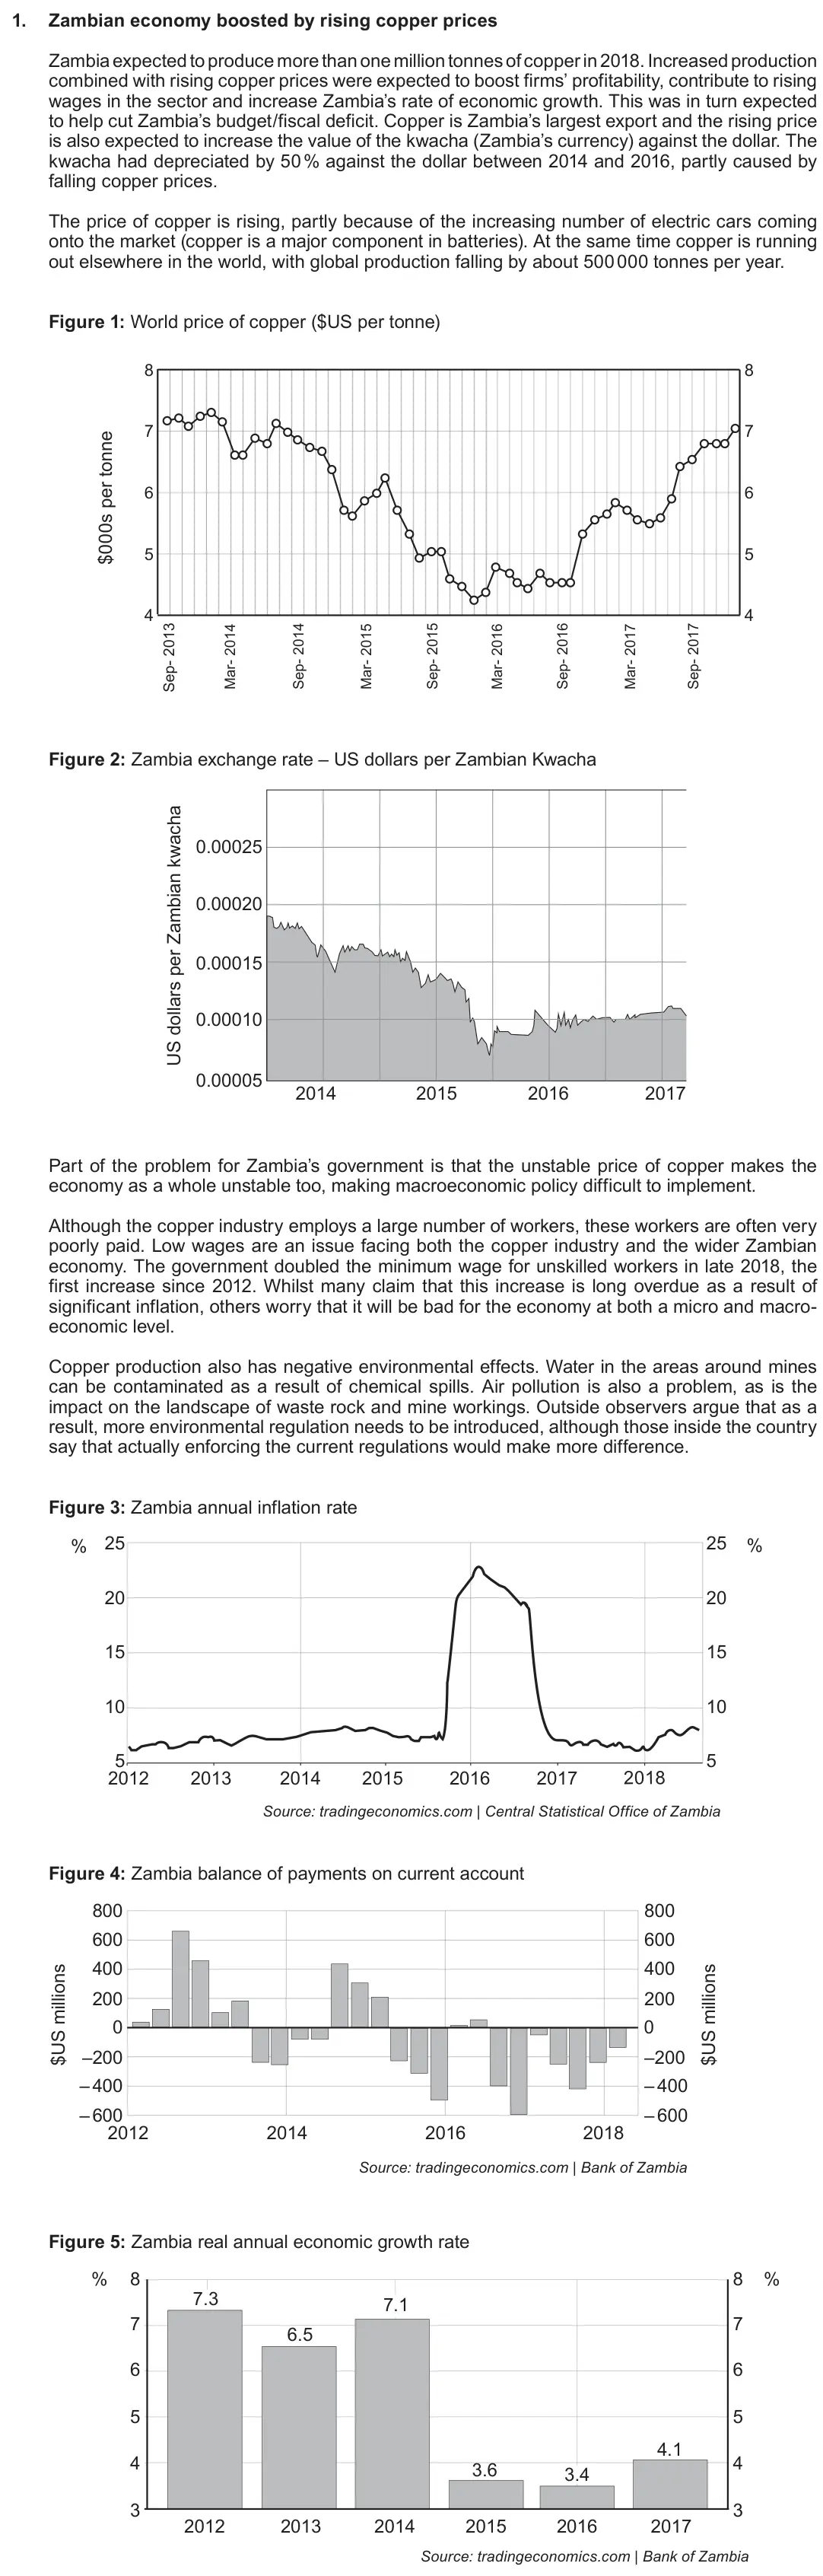
    Original question 26: The chart and extract below give information on copper prices.

    Loading the question…

  4. Q14

    June 2023 · Component 1

    The whole paper ↗

    4
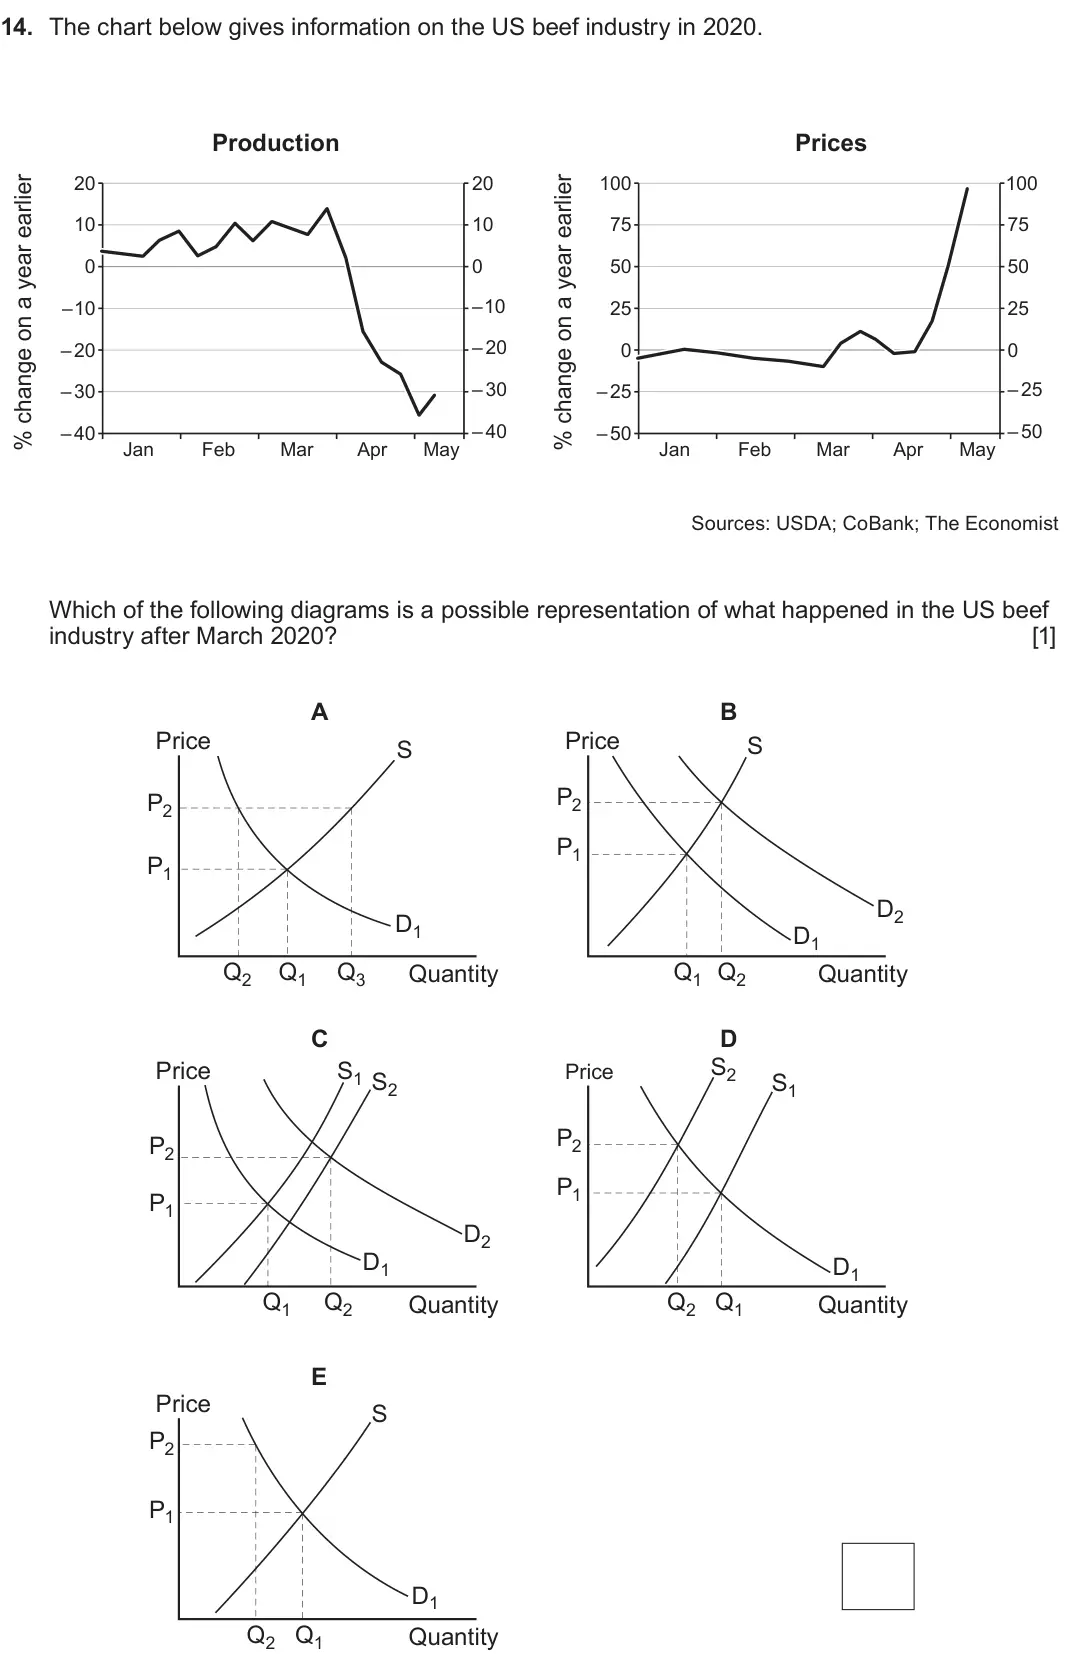
    Original question 14: The chart below gives information on the US beef industry in 2020.

    Loading the question…

    Your answer
  5. Q1(b)

    June 2023 · Component 2

    The whole paper ↗

    5
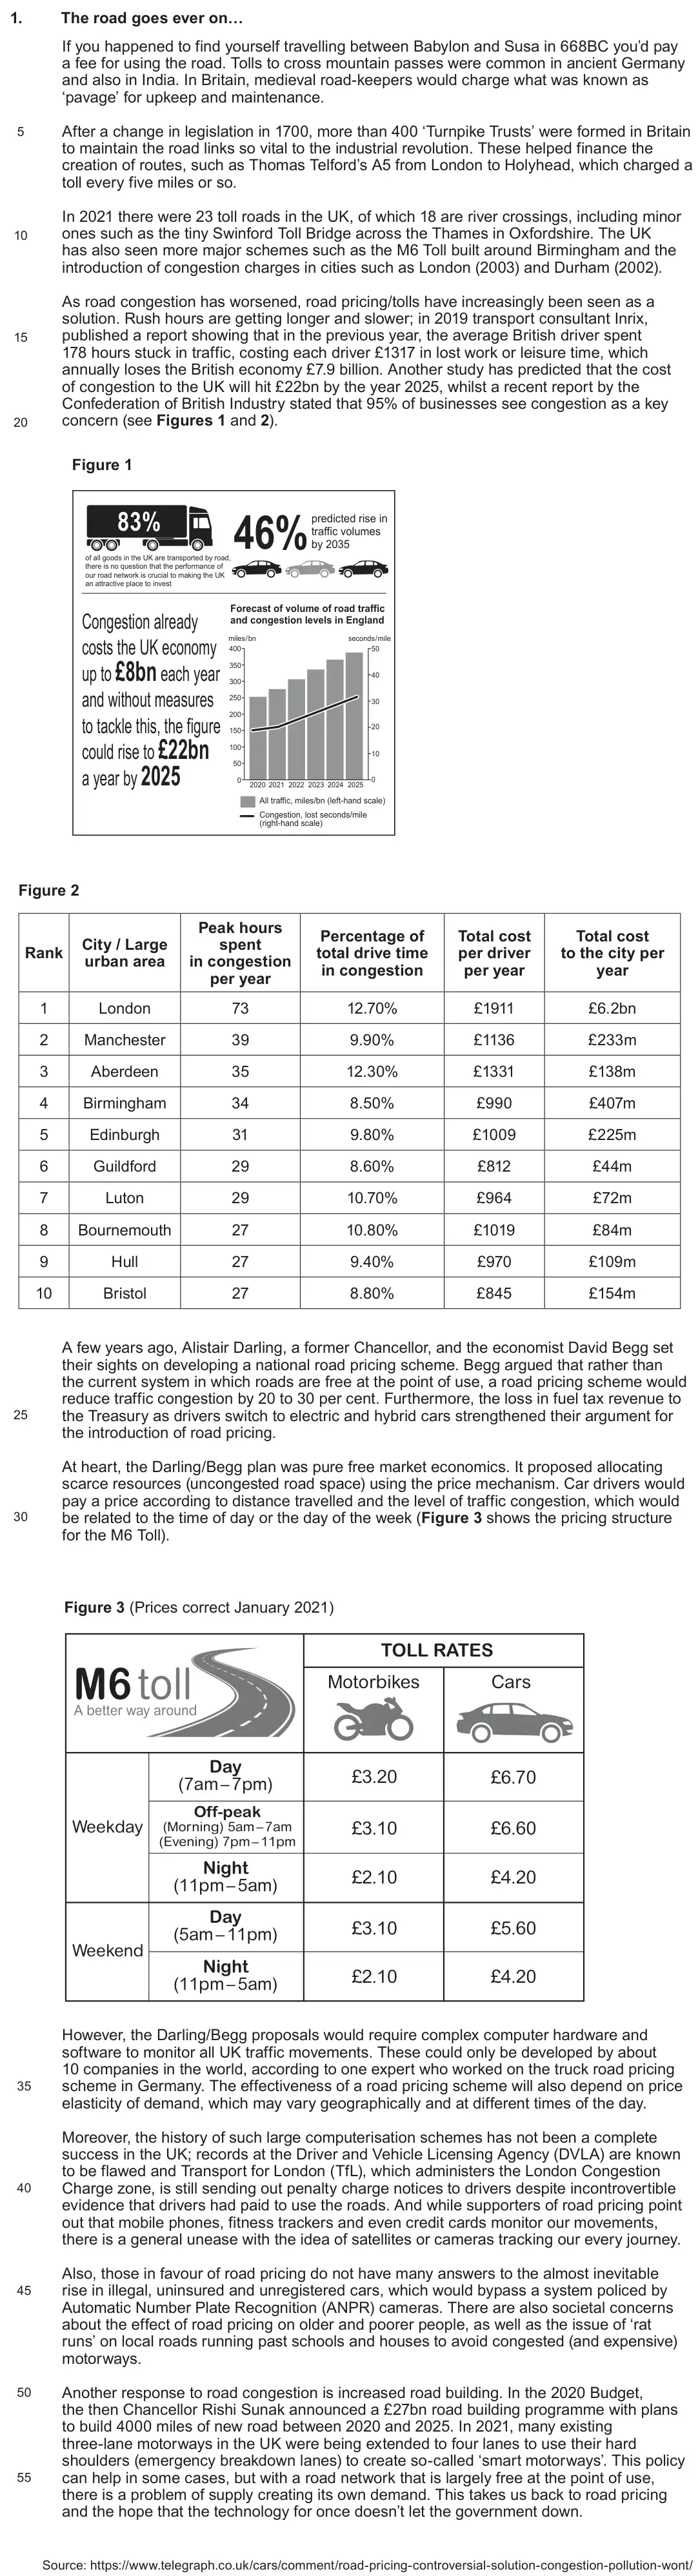
    Setup for original question 1(b)

    Loading the question setup…

    Original question 1(b): Using a demand and supply diagram, show how roads being ‘free at the point of use’

    Loading the question…

  6. Q2(b)

    June 2023 · AS Component 2

    The whole paper ↗

    6
    Setup for original question 2(b)

    Loading the question setup…

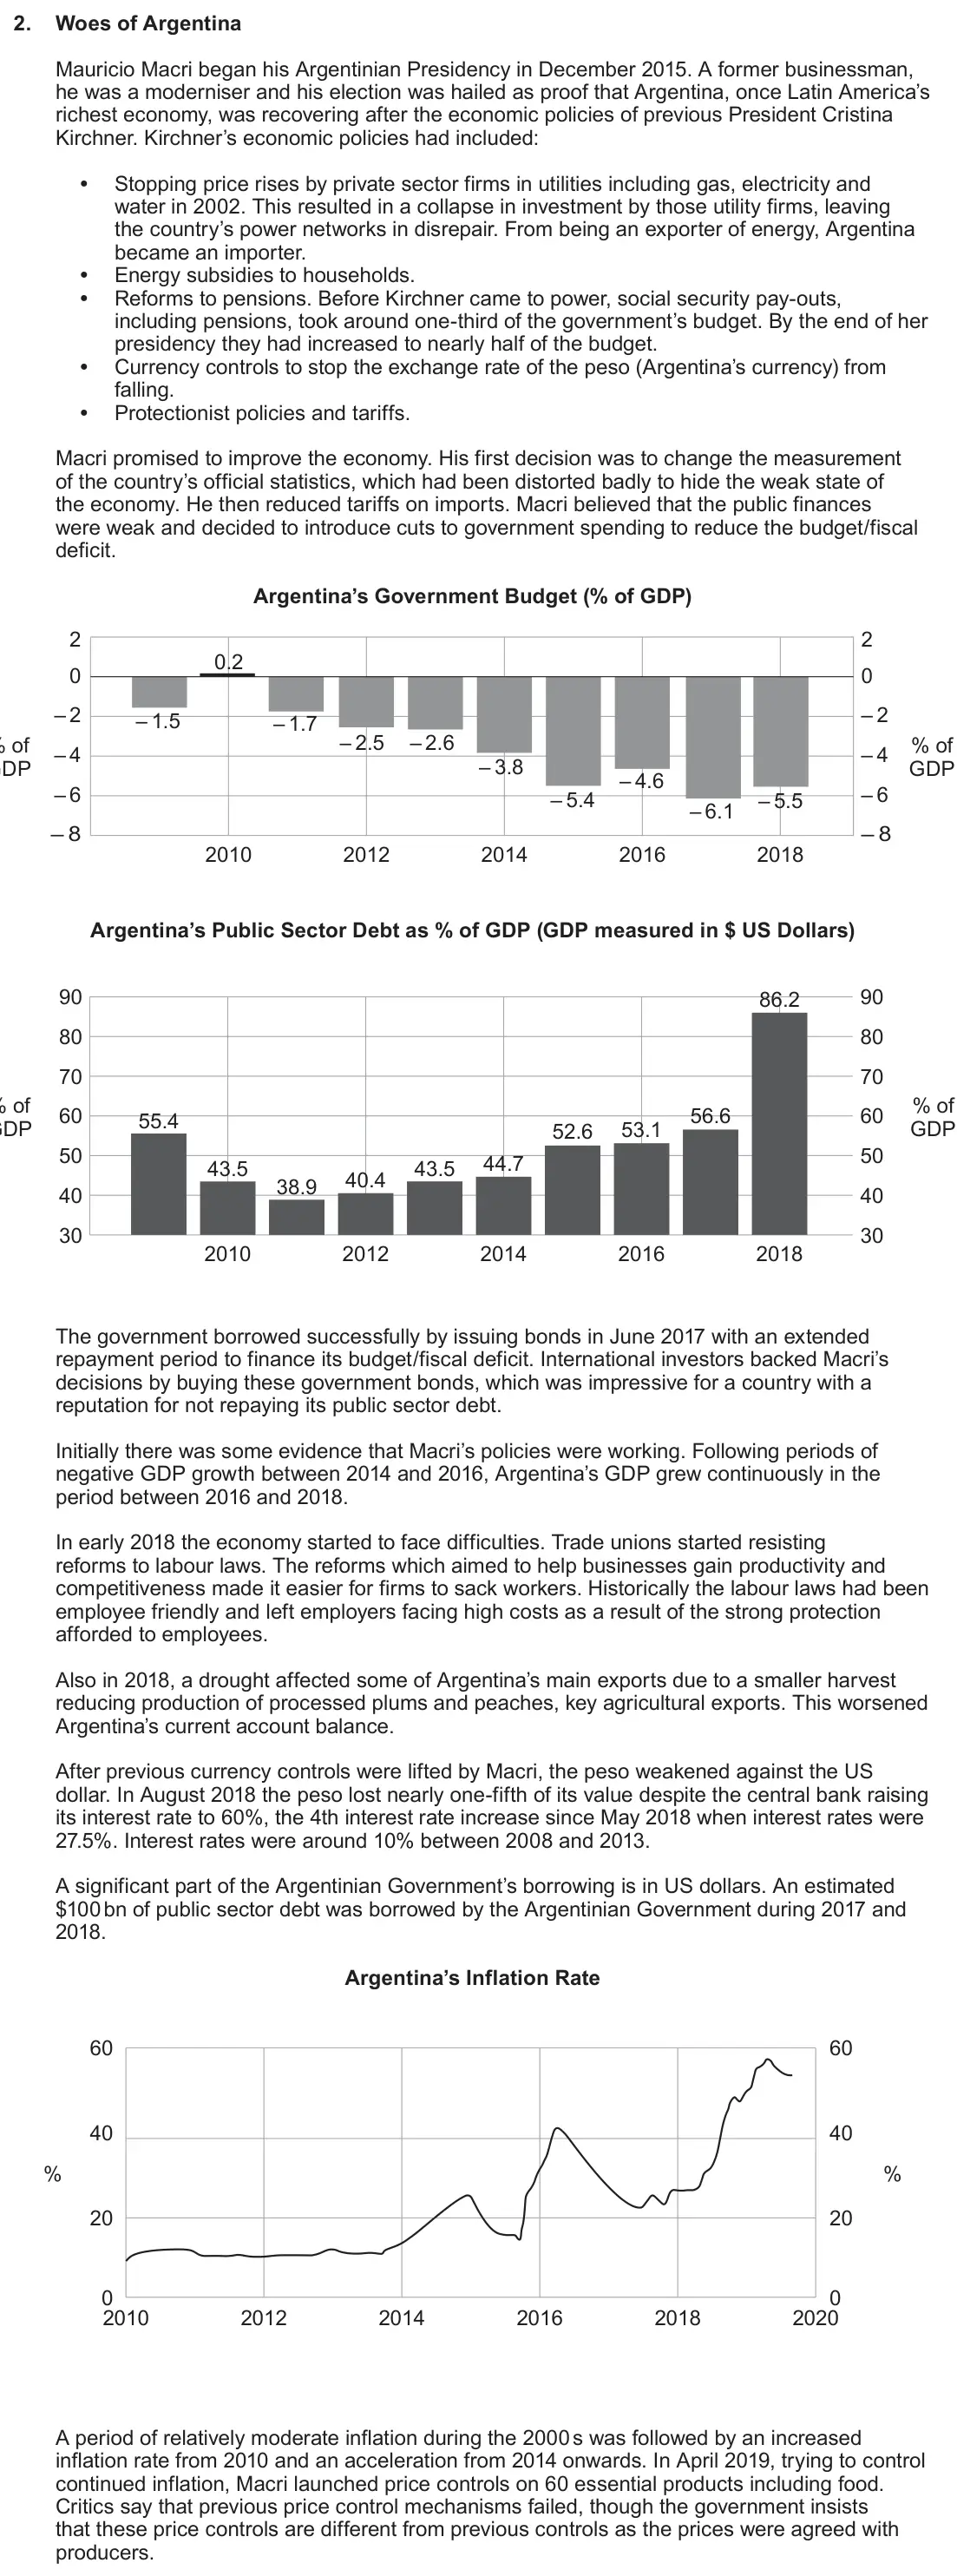
    Original question 2(b): Using a diagram, explain the likely impact of the Argentinian drought on the price of

    Loading the question…

  7. Q1(d)

    June 2022 · Component 2

    The whole paper ↗
    7
    Setup for original question 1(d)

    Loading the question setup…

    Original question 1(d): Based on the information available in the data (written in March 2019), discuss whether,

    Loading the question…

  8. Q4

    Autumn 2021 · Component 1

    The whole paper ↗

    8
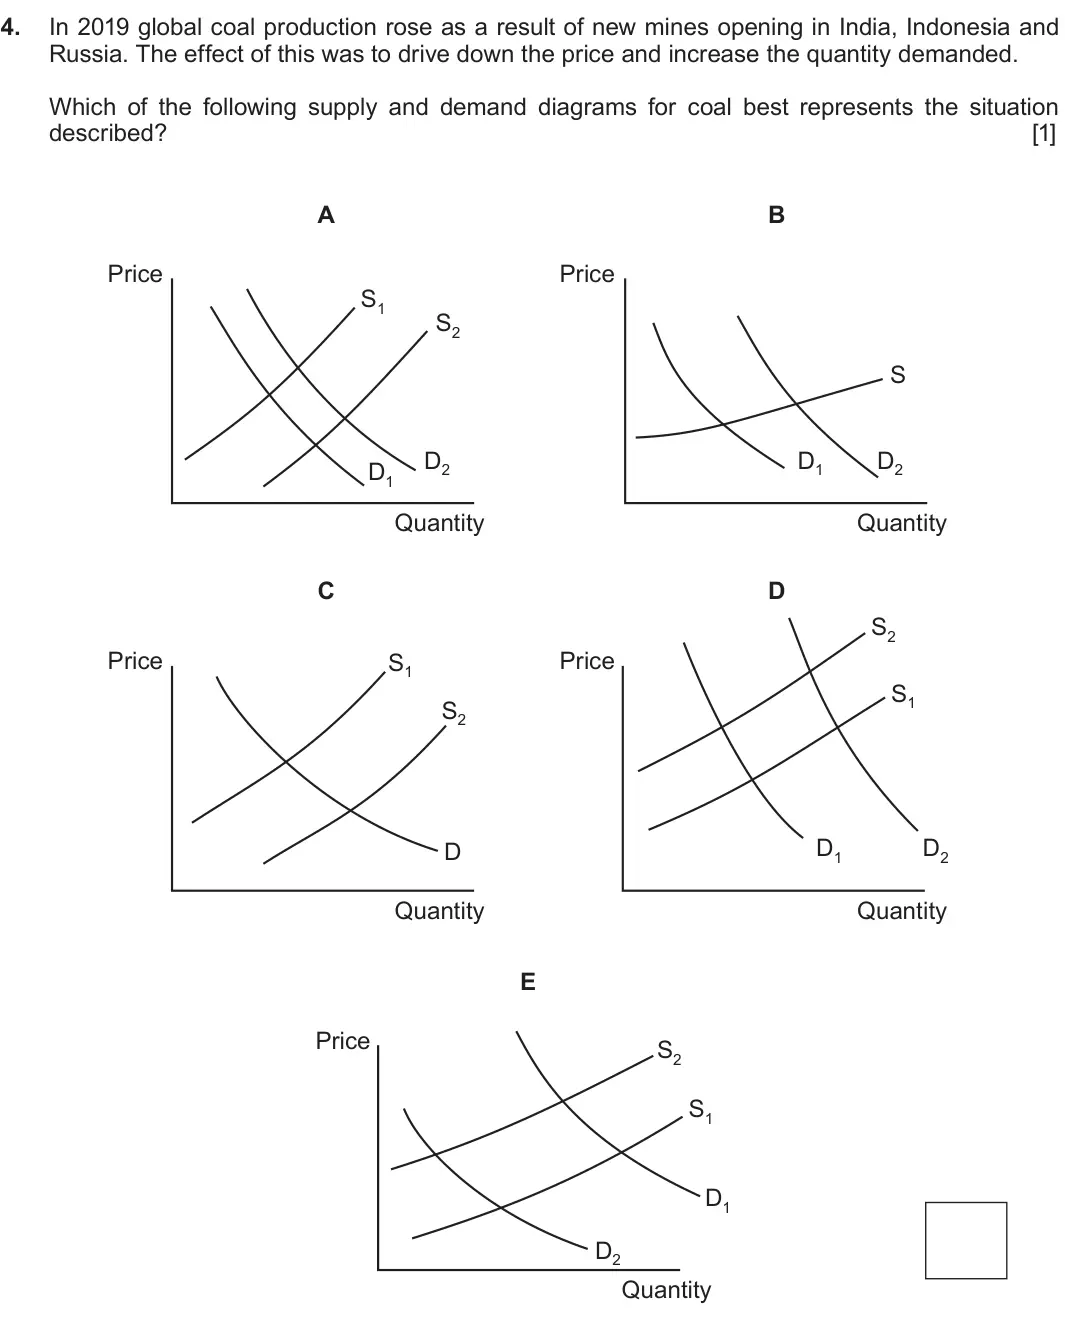
    Original question 4: In 2019 global coal production rose as a result of new mines opening in India, Indonesia and

    Loading the question…

    Your answer
  9. Q10

    Autumn 2021 · Component 1

    The whole paper ↗
    9
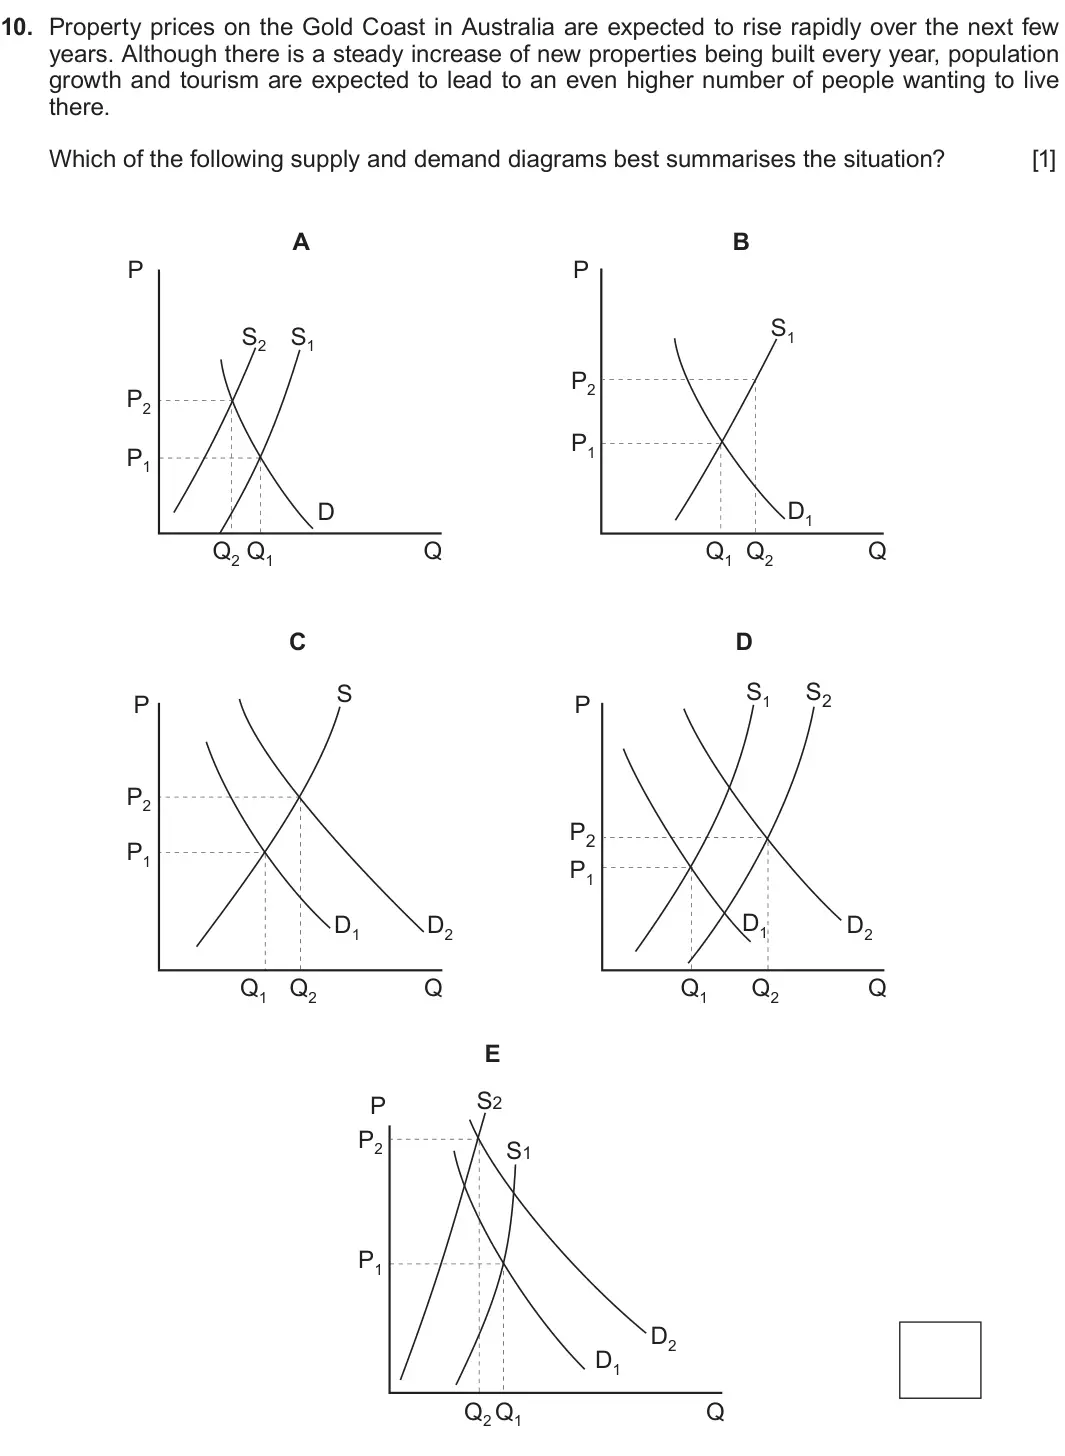
    Original question 10: Property prices on the Gold Coast in Australia are expected to rise rapidly over the next few

    Loading the question…

    Your answer
  10. Q7

    Autumn 2020 · AS Component 1

    The whole paper ↗
    10
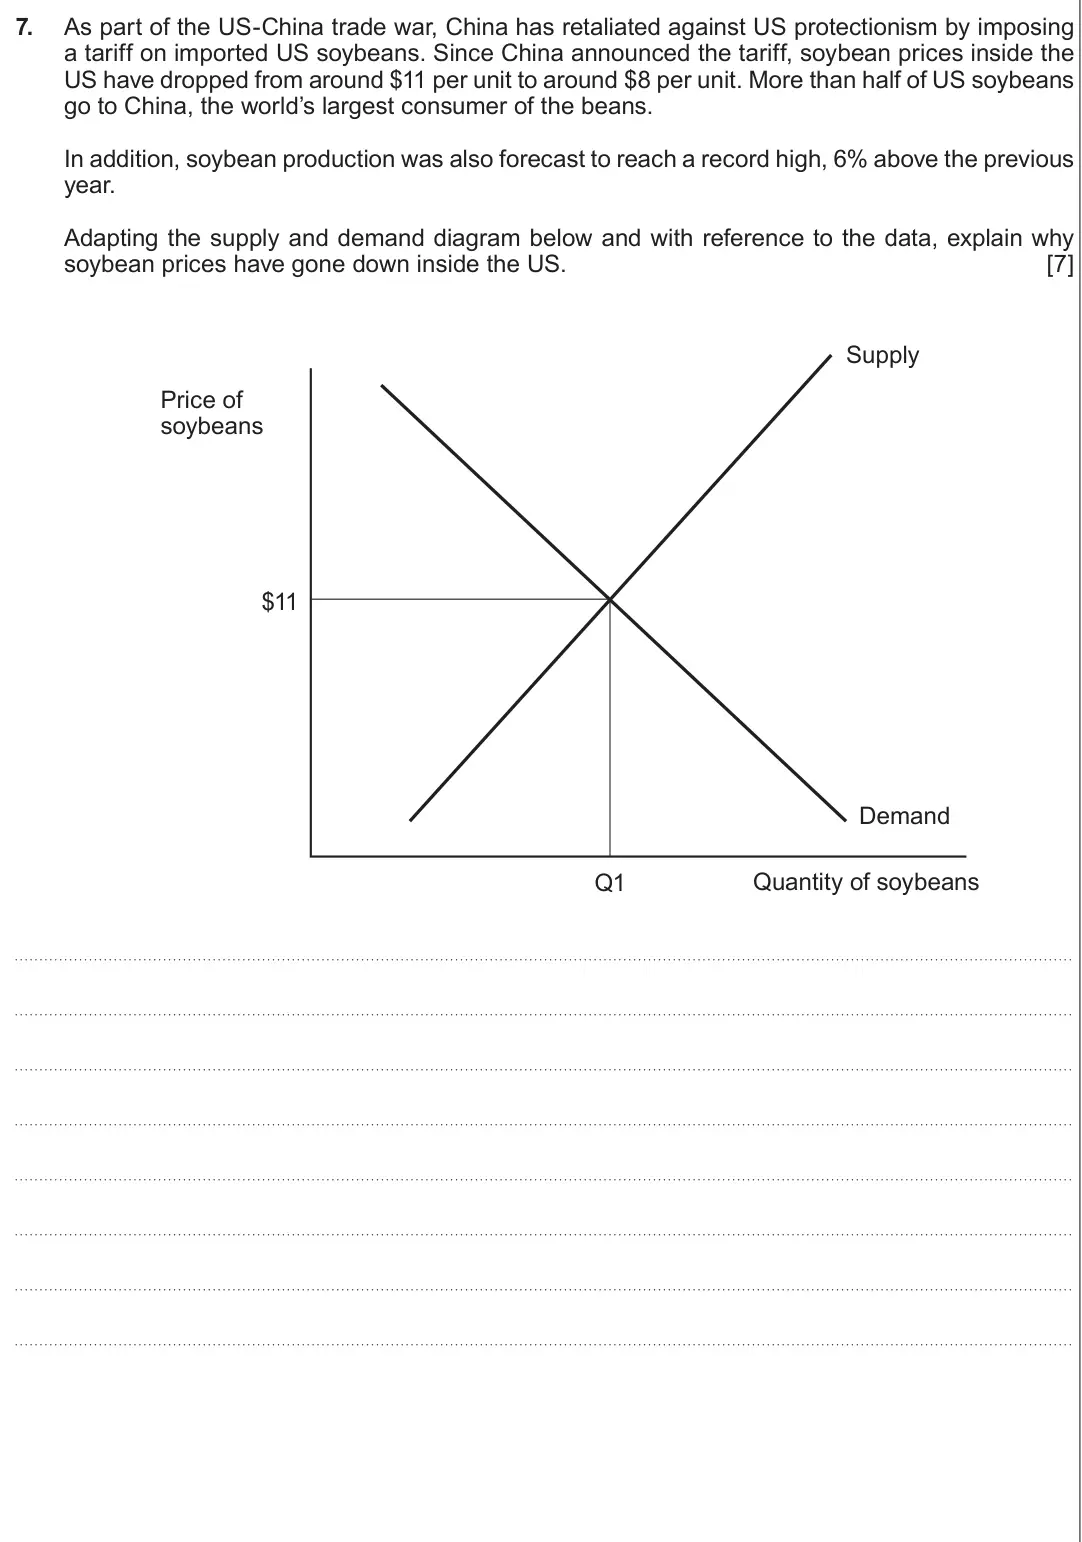
    Original question 7: As part of the US-China trade war, China has retaliated against US protectionism by imposing

    Loading the question…

  11. Q1(a)

    Autumn 2020 · AS Component 2

    The whole paper ↗
    11
    Setup for original question 1(a)

    Loading the question setup…

    Original question 1(a): With reference to the data and using a supply and demand diagram, explain why the price

    Loading the question…

  12. Q13

    June 2019 · Component 1

    The whole paper ↗
    12
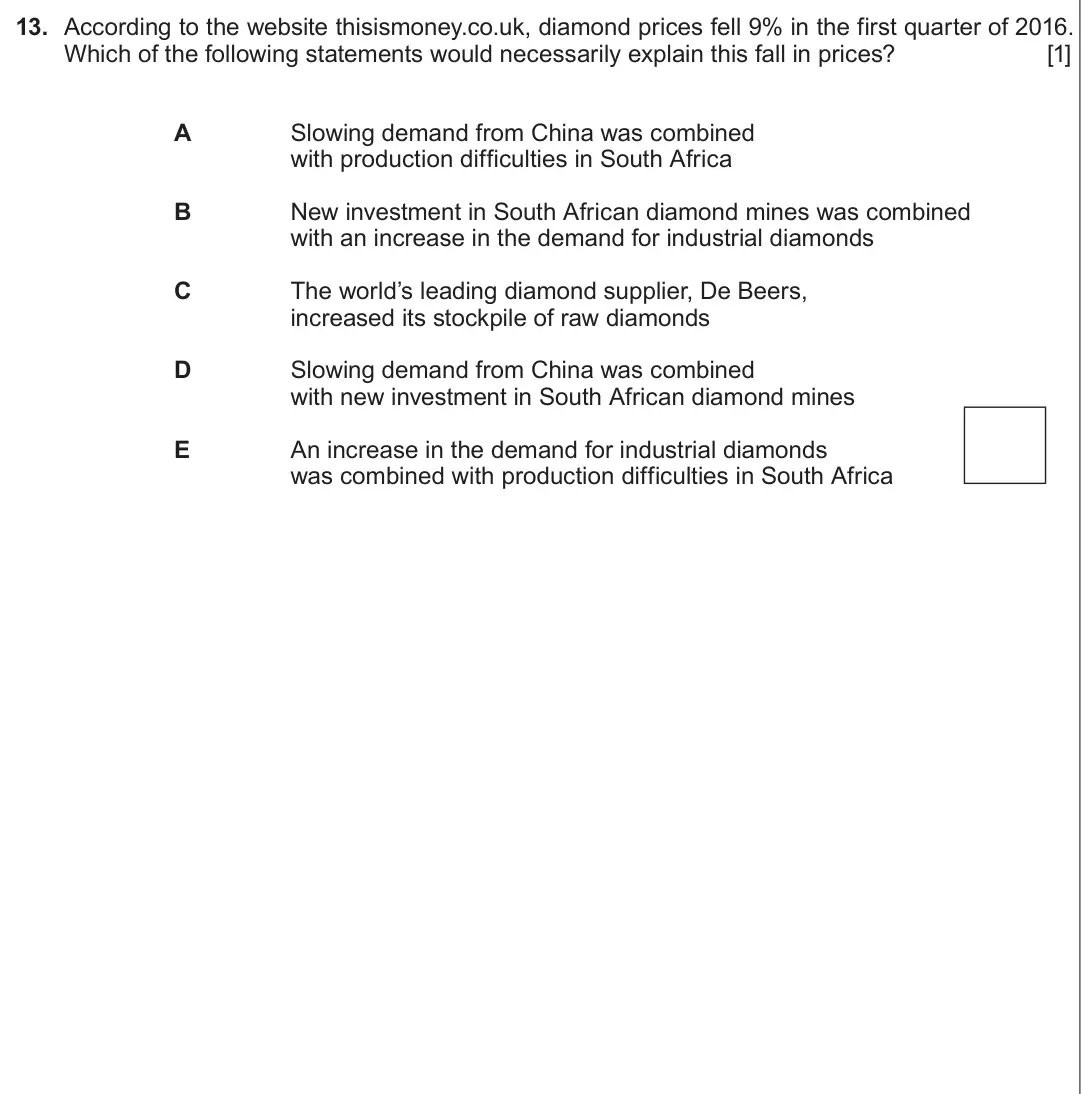
    Original question 13: According to the website thisismoney.co.uk, diamond prices fell 9% in the first quarter of 2016.

    Loading the question…

    Your answer
  13. Q2(a)(ii)

    June 2019 · AS Component 2

    The whole paper ↗
    13
    Setup for original question 2(a)(ii)

    Loading the question setup…

    Original question 2(a)(ii): With reference to the data and using a demand and supply diagram, outline why the

    Loading the question…

  14. Q1(b)

    June 2018 · Component 3

    The whole paper ↗
    14
    Setup for original question 1(b)

    Loading the question setup…

    Original question 1(b): “A rise in price always leads to a fall in quantity demanded but a rise in demand always

    Loading the question…

  15. Q2(a)

    June 2018 · AS Component 1

    The whole paper ↗
    15
    Setup for original question 2(a)

    Loading the question setup…

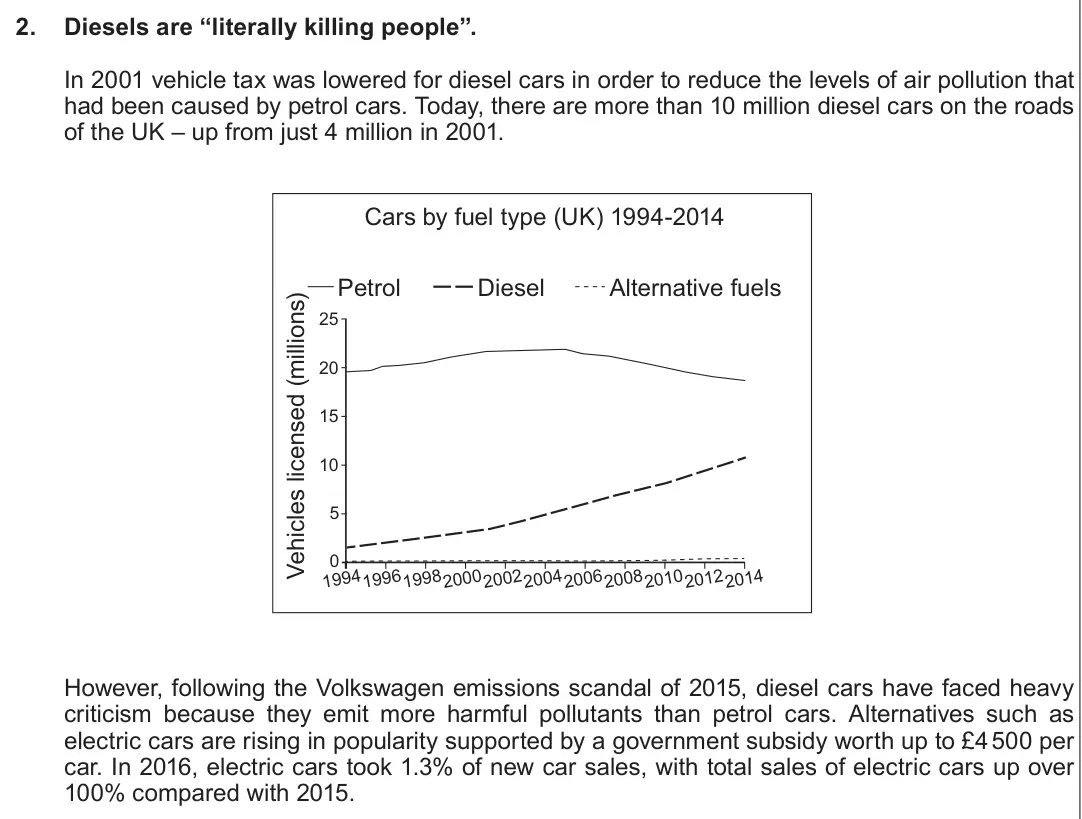
    Original question 2(a): With the aid of a diagram, outline why the data suggests that the number of diesel cars on

    Loading the question…

  16. Q1(a)(i)

    June 2018 · AS Component 2

    The whole paper ↗
    16
    Setup for original question 1(a)(i)

    Loading the question setup…

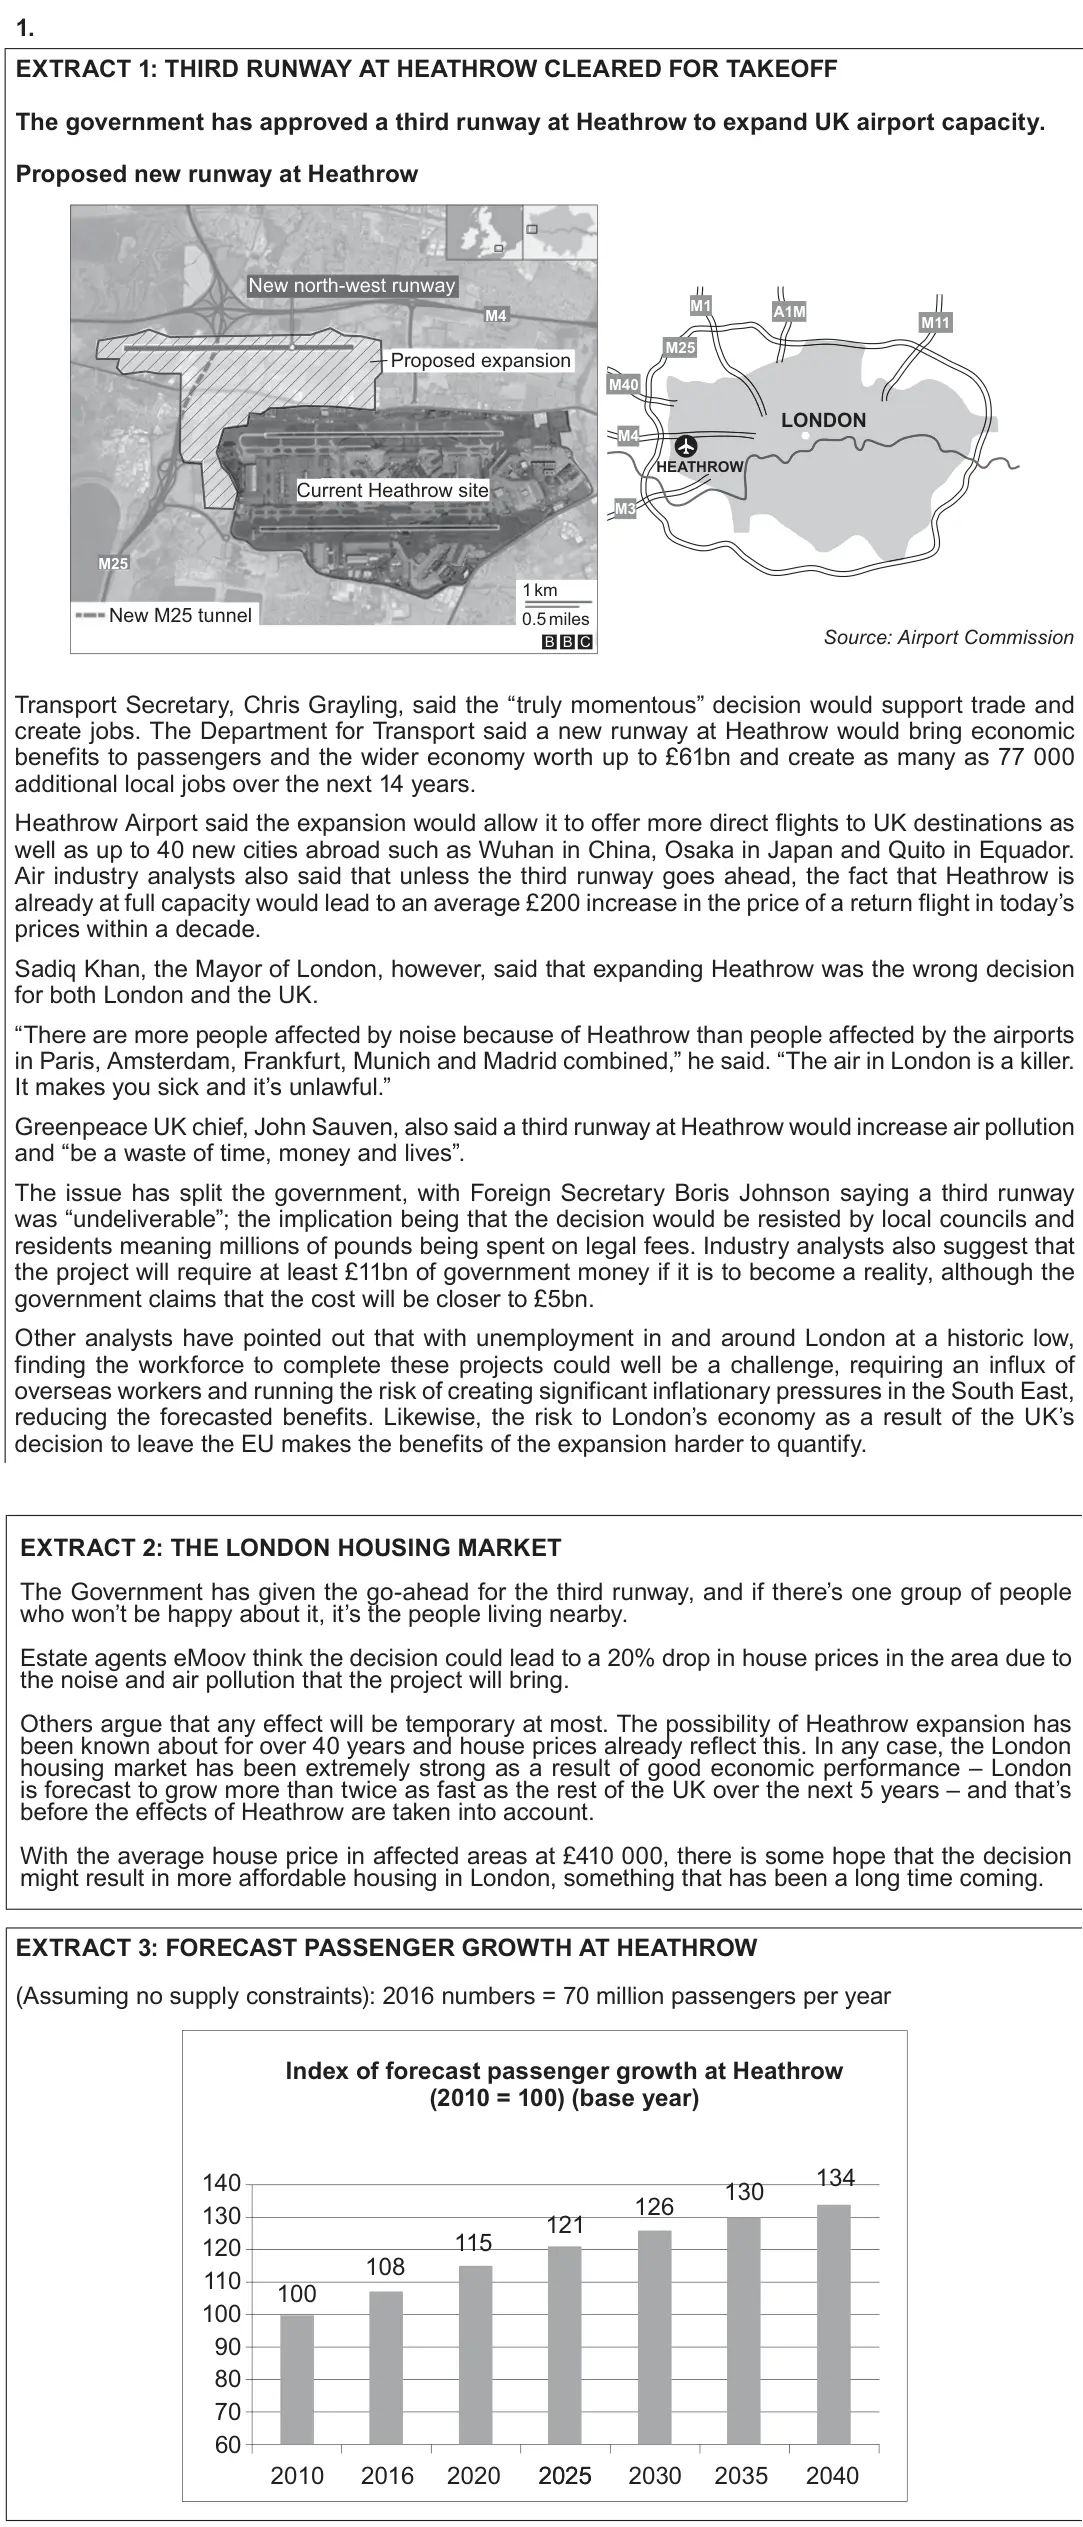
    Original question 1(a)(i): Assuming that the eMoov forecast in Extract 2 is correct, calculate the predicted

    Loading the question…

  17. Q1(a)(ii)

    June 2018 · AS Component 2

    The whole paper ↗
    17
    Setup for original question 1(a)(ii)

    Loading the question setup…

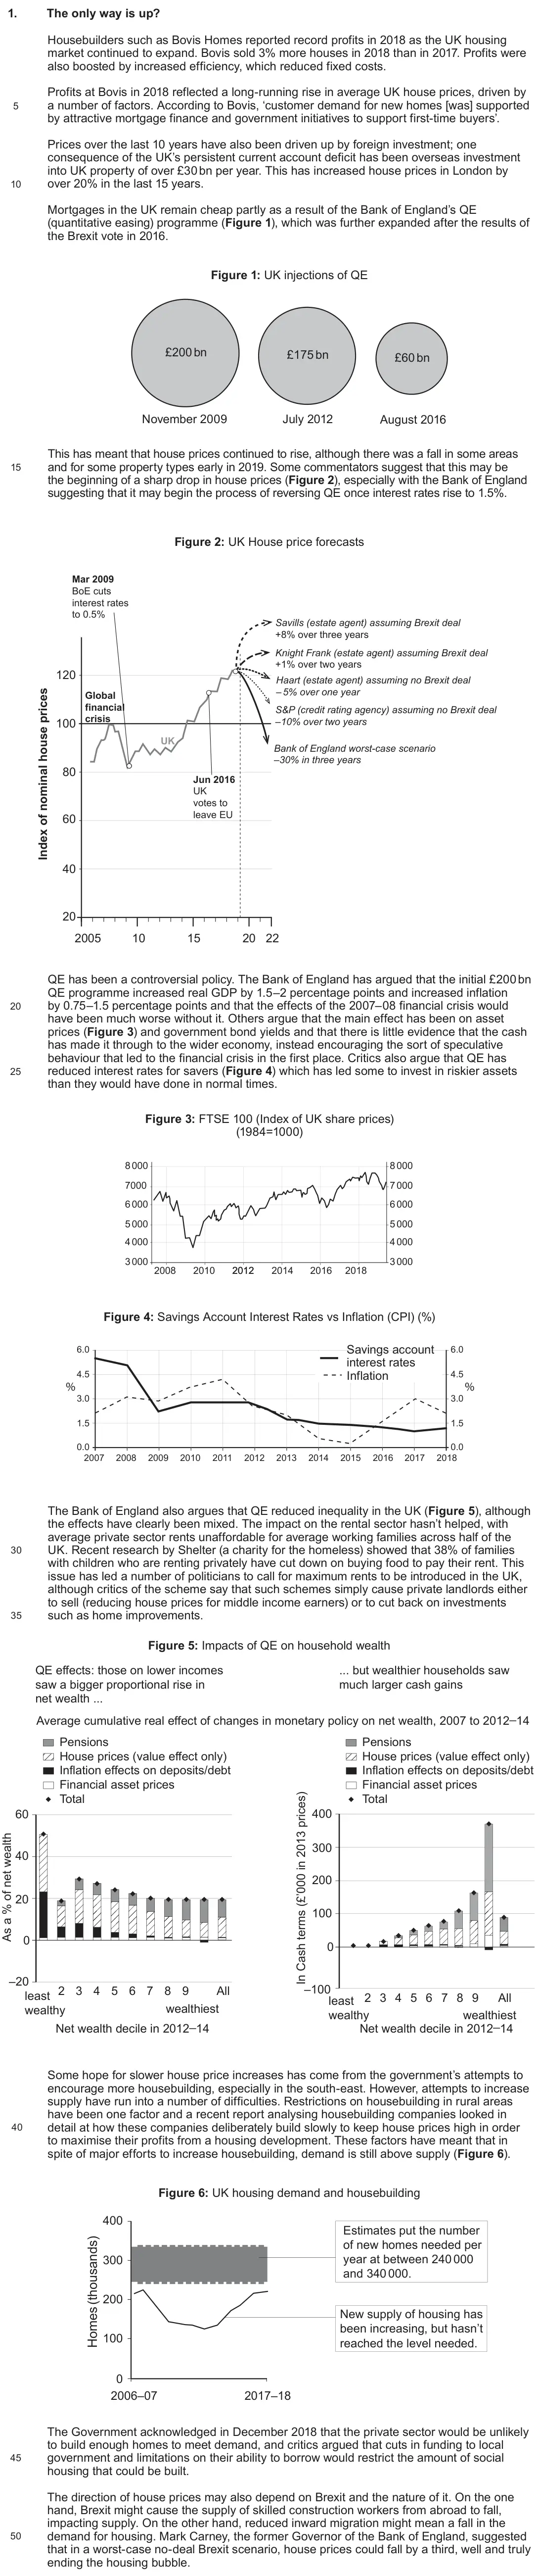
    Original question 1(a)(ii): Using a supply and demand diagram, discuss how likely it is that house prices will

    Loading the question…

  18. Q1(c)(ii)

    June 2018 · AS Component 2

    The whole paper ↗
    18
    Setup for original question 1(c)(ii)

    Loading the question setup…

    Original question 1(c)(ii): Using a supply and demand diagram, explain how the construction of a third runway

    Loading the question…

  19. Q2(a)

    June 2018 · AS Component 2

    The whole paper ↗
    19
    Setup for original question 2(a)

    Loading the question setup…

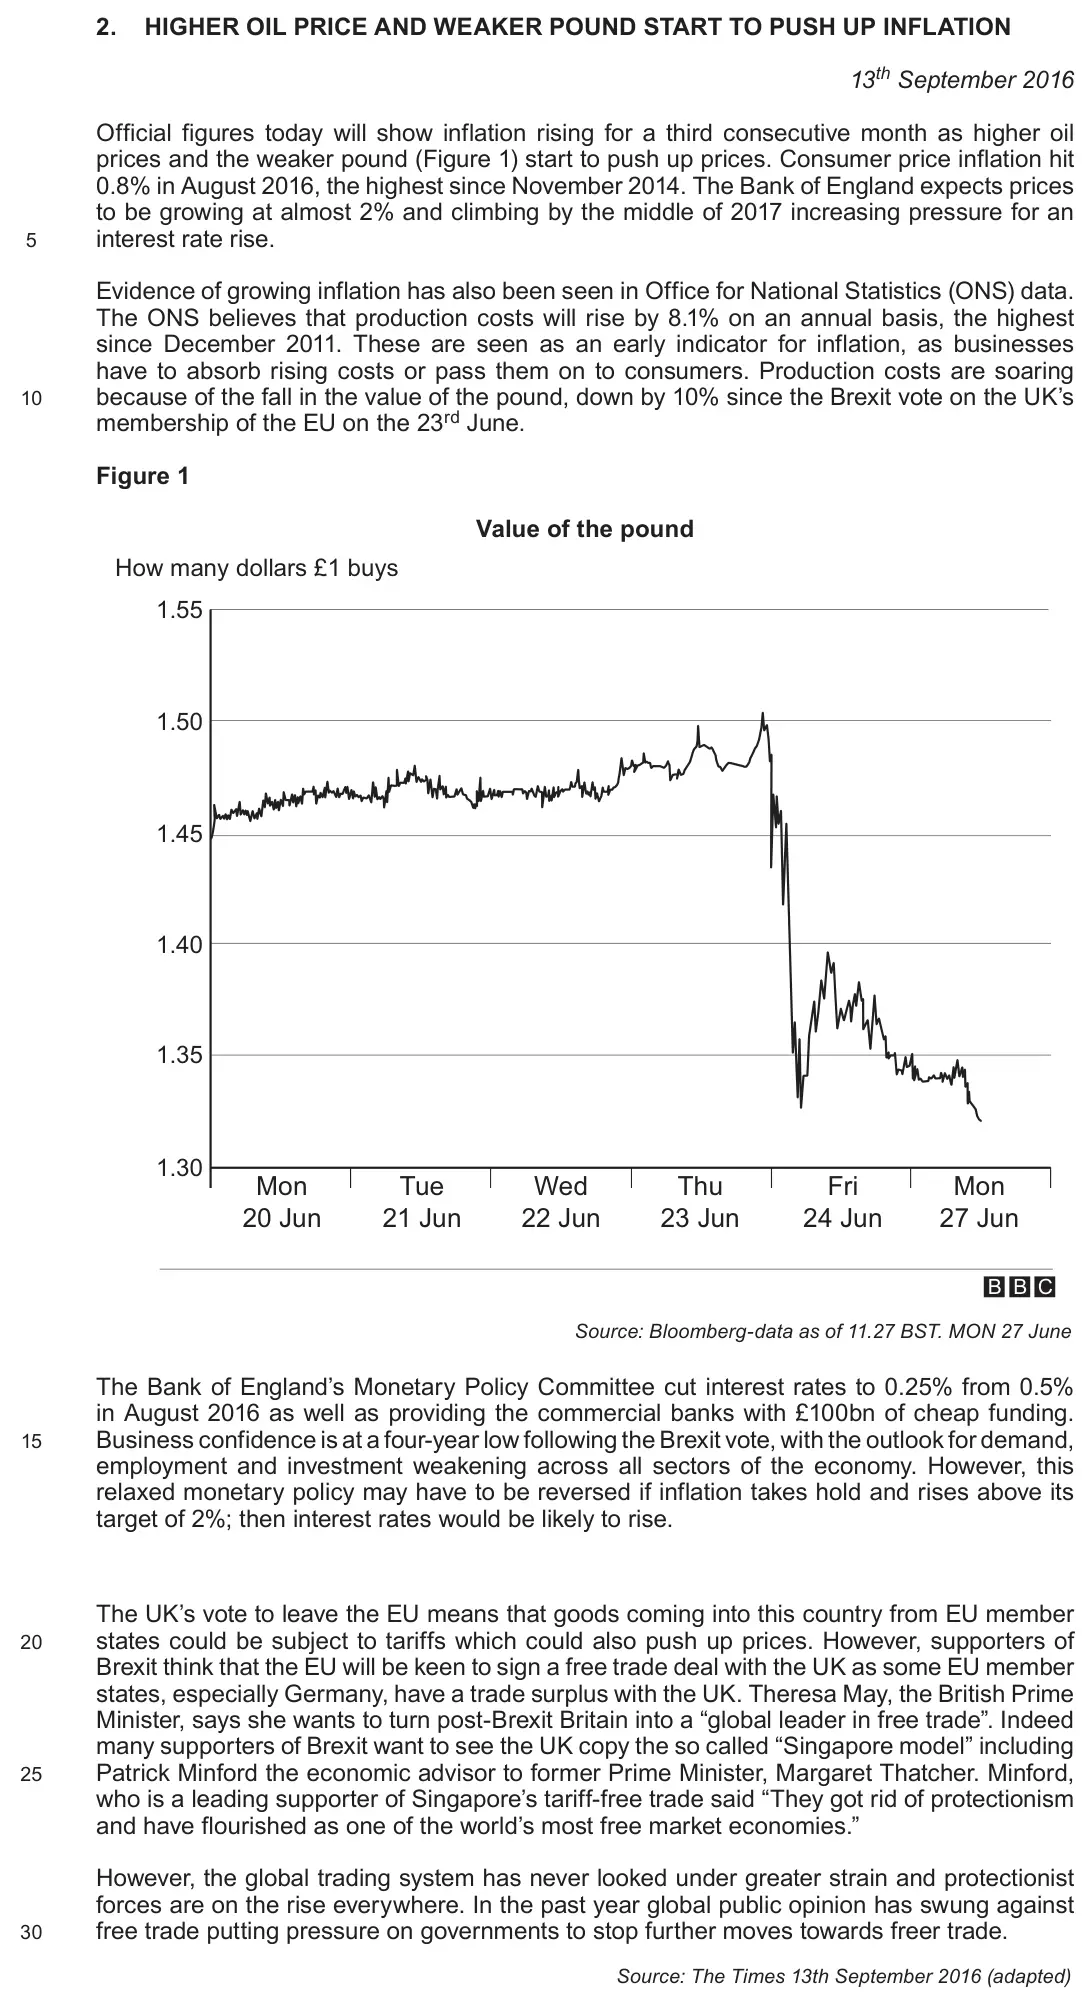
    Original question 2(a): Using a supply and demand diagram, explain why a higher oil price and a weaker pound

    Loading the question…

  20. Q5

    June 2017 · Component 1

    The whole paper ↗
    20
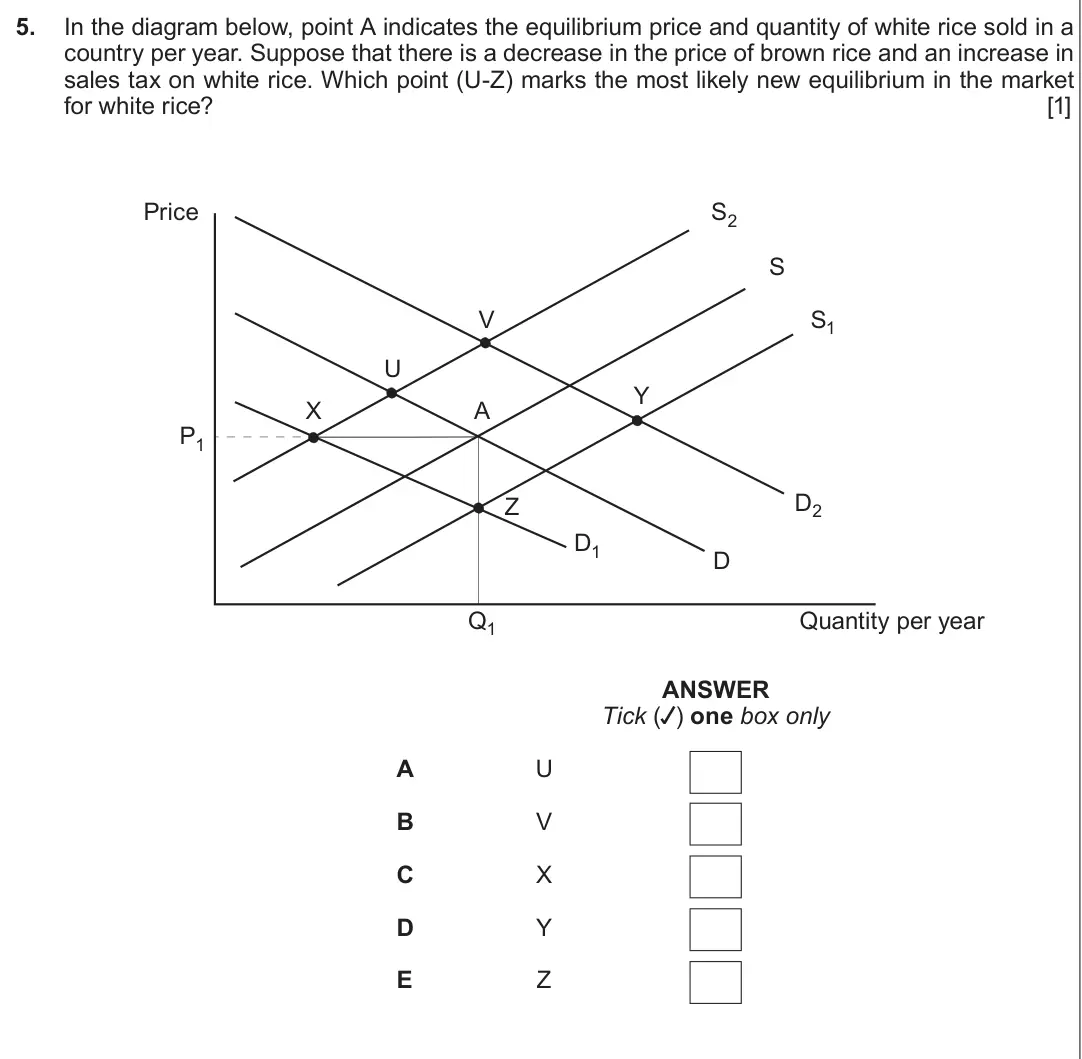
    Original question 5: In the diagram below, point A indicates the equilibrium price and quantity of white rice sold in a

    Loading the question…

    Your answer
All 24 questions on Equilibrium price and output, as a list
  1. June 2025, AS Component 2, Q1(a) (6 marks): Using Extract A and a demand and supply diagram(s), outline why rents were
  2. June 2025, AS Component 2, Q1(b)(ii) (8 marks): Evaluate whether interest rates are the most significant factor that determines the
  3. June 2024, Component 1, Q26 (9 marks): The chart and extract below give information on copper prices.
  4. June 2023, Component 1, Q14 (1 mark): The chart below gives information on the US beef industry in 2020.
  5. June 2023, Component 2, Q1(b) (4 marks): Using a demand and supply diagram, show how roads being ‘free at the point of use’
  6. June 2023, AS Component 2, Q2(b) (4 marks): Using a diagram, explain the likely impact of the Argentinian drought on the price of
  7. June 2022, Component 2, Q1(d) (8 marks): Based on the information available in the data (written in March 2019), discuss whether,
  8. Autumn 2021, Component 1, Q4 (1 mark): In 2019 global coal production rose as a result of new mines opening in India, Indonesia and
  9. Autumn 2021, Component 1, Q10 (1 mark): Property prices on the Gold Coast in Australia are expected to rise rapidly over the next few
  10. Autumn 2020, AS Component 1, Q7 (7 marks): As part of the US-China trade war, China has retaliated against US protectionism by imposing
  11. Autumn 2020, AS Component 2, Q1(a) (6 marks): With reference to the data and using a supply and demand diagram, explain why the price
  12. June 2019, Component 1, Q13 (1 mark): According to the website thisismoney.co.uk, diamond prices fell 9% in the first quarter of 2016.
  13. June 2019, AS Component 2, Q2(a)(ii) (5 marks): With reference to the data and using a demand and supply diagram, outline why the
  14. June 2018, Component 3, Q1(b) (20 marks): “A rise in price always leads to a fall in quantity demanded but a rise in demand always
  15. June 2018, AS Component 1, Q2(a) (4 marks): With the aid of a diagram, outline why the data suggests that the number of diesel cars on
  16. June 2018, AS Component 2, Q1(a)(i) (2 marks): Assuming that the eMoov forecast in Extract 2 is correct, calculate the predicted
  17. June 2018, AS Component 2, Q1(a)(ii) (8 marks): Using a supply and demand diagram, discuss how likely it is that house prices will
  18. June 2018, AS Component 2, Q1(c)(ii) (6 marks): Using a supply and demand diagram, explain how the construction of a third runway
  19. June 2018, AS Component 2, Q2(a) (4 marks): Using a supply and demand diagram, explain why a higher oil price and a weaker pound
  20. June 2017, Component 1, Q5 (1 mark): In the diagram below, point A indicates the equilibrium price and quantity of white rice sold in a
  21. June 2017, Component 1, Q19 (1 mark): A sharp increase in both supply and demand in a market would be likely to do which one of the
  22. June 2017, Component 1, Q21 (4 marks): Explain, using a demand and supply diagram, why in theory a rise in demand for music
  23. June 2016, AS Component 2, Q1(c)(i) (4 marks): Using a supply and demand diagram explain why the price of oil fell sharply in the
  24. June 2016, AS Component 2, Q2(b) (4 marks): Using a demand and supply diagram explain how the revenue of cigarette manufacturers

Questions, mark schemes and examiner’s reports are © WJEC Eduqas, from their published past papers. Plumi isn’t affiliated with any exam board. Want whole papers? Eduqas A-Level Economics past papers.

The Plumi iPad app also offers exam-style questions with AI feedback on your handwritten working.