 plumi
Climate models and predictions: Edexcel International A Level Biology questions
Edexcel International A Level Biology past-paper questions on 5.4.3 Climate models and predictions, 2019–2025, with mark schemes and examiner’s reports where available.
Paper
All papers
Exam
All years
Calculations
Q7(c)
The whole paper ↗
Q7(d)(ii)
The whole paper ↗Q5(a)(i)
The whole paper ↗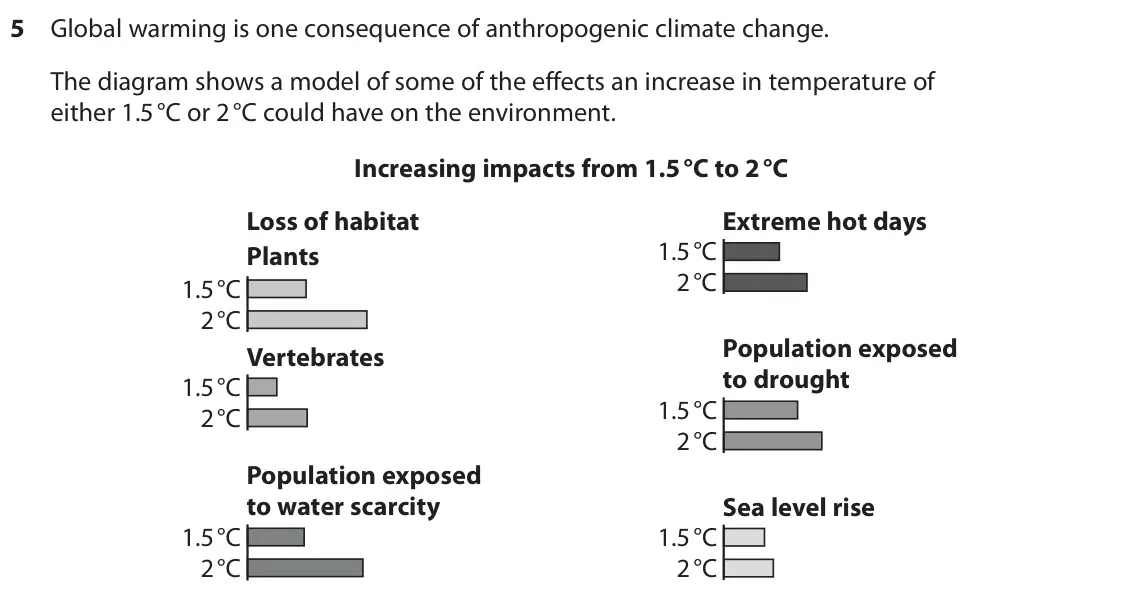
Q5(a)(ii)
The whole paper ↗Q9(a)(i)
The whole paper ↗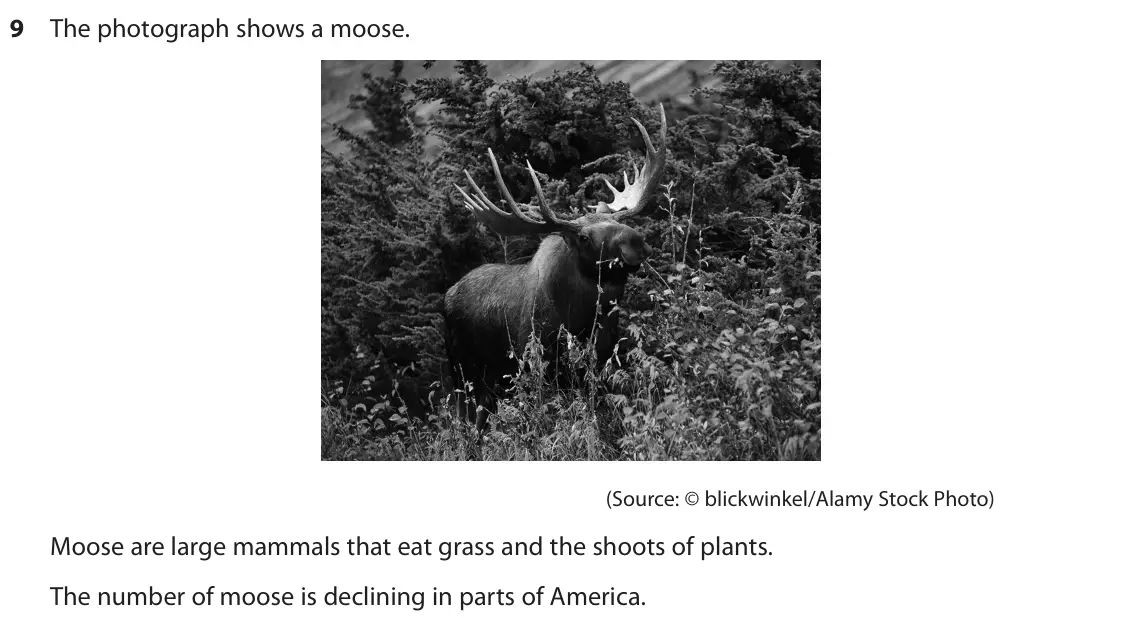
Q3(b)
The whole paper ↗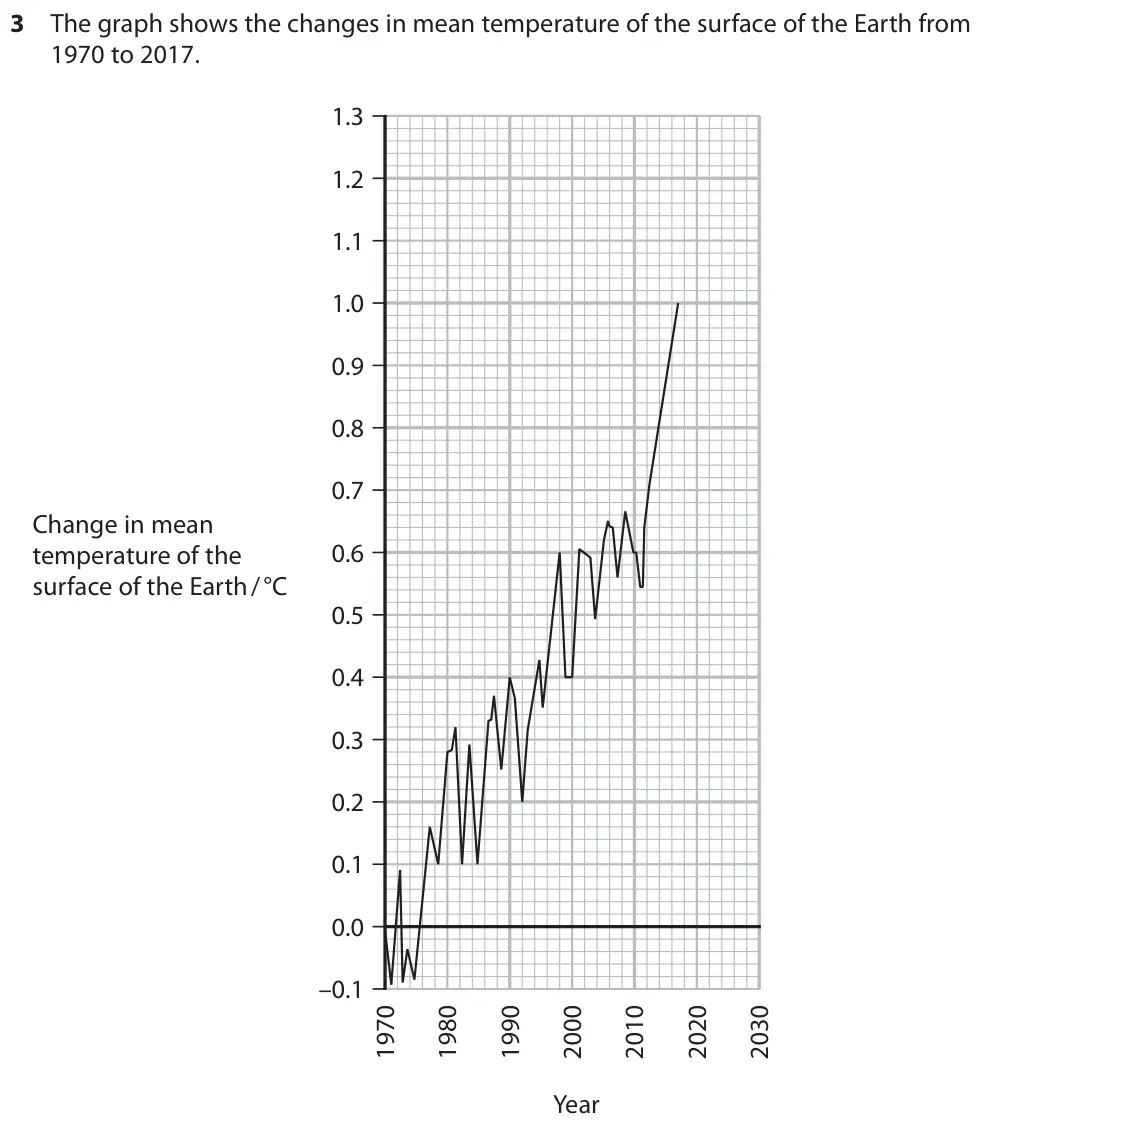 Your answer
All 6 questions on Climate models and predictions, as a list
- January 2025, Unit 4, Q7(c) (1 mark): The graph shows the changes in mean global temperature from 1975 to 2023. 1.50 1.25 1.00 0.75 Changes in mean global 0.50 temperature / C 0.25 0.00 –0.25 –0.50
- January 2025, Unit 4, Q7(d)(ii) (3 marks): Carbon dioxide can last in the atmosphere for thousands of years. Methane lasts for about 12 years and nitrous oxide for about 121 years. Discuss the implicatio
- January 2023, Unit 4, Q5(a)(i) (2 marks): Explain why this diagram is described as a model of the effects of an increase in temperature. (2)
- January 2023, Unit 4, Q5(a)(ii) (1 mark): Calculate the percentage increase in the population exposed to drought if the temperature increased by 2 °C and not 1.5 °C. Assume the bars in the diagram are d
- October 2020, Unit 4, Q9(a)(i) (1 mark): In 2016, the moose were not counted. The value shown on the graph is an estimate. Describe how these data were used to estimate the number of moose in 2016. (1)
- January 2020, Unit 4, Q3(b) (1 mark): What is the estimated change in the mean temperature of the surface of the Earth in 2030? (1) A 1.3 B 1.1 C 0.8 D 0.2
Questions, mark schemes and examiner’s reports are © Pearson Edexcel, from their published past papers. Plumi isn’t affiliated with any exam board. Want whole papers? Edexcel International A Level Biology past papers.
The Plumi iPad app also offers exam-style questions with AI feedback on your handwritten working.