 plumi
Histograms and cumulative frequency: Edexcel GCSE Maths questions
Every Edexcel GCSE Maths exam question on S3 Histograms and cumulative frequency, 2017–2025, with its mark scheme and examiner’s report.
Find questions997
Exam
All years
Calculator
All 31 questions on Histograms and cumulative frequency, as a list
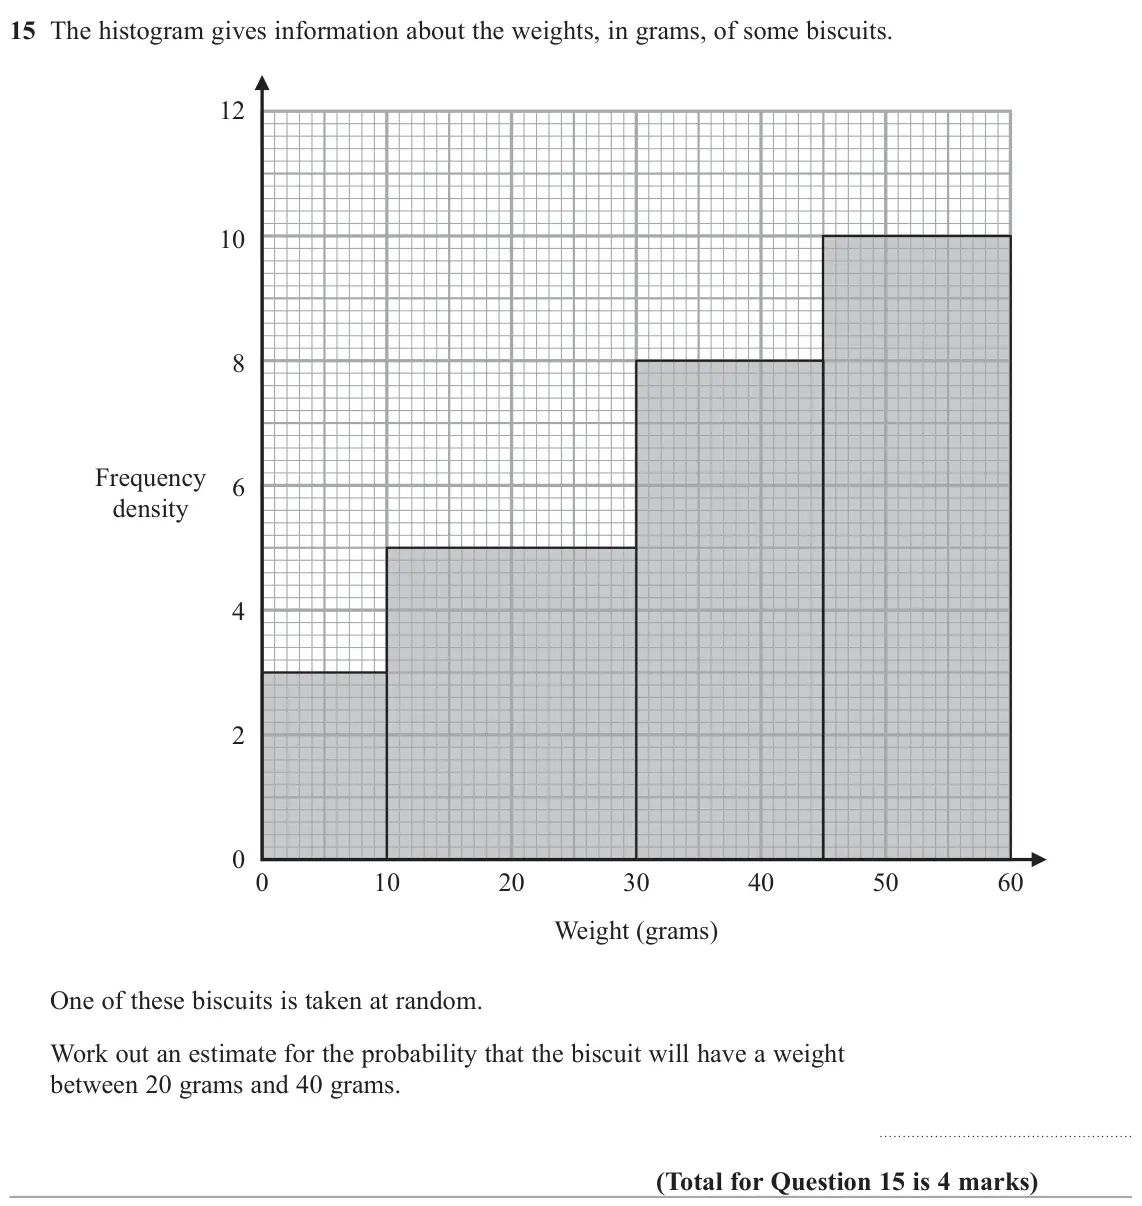
- June 2025, Paper 1H, Q15 (4 marks): The histogram gives information about the weights, in grams, of some biscuits. 12 10 8 Frequency 6 density 4 2 0 0 10 20 30 40 50 60 Weight (grams) One of these
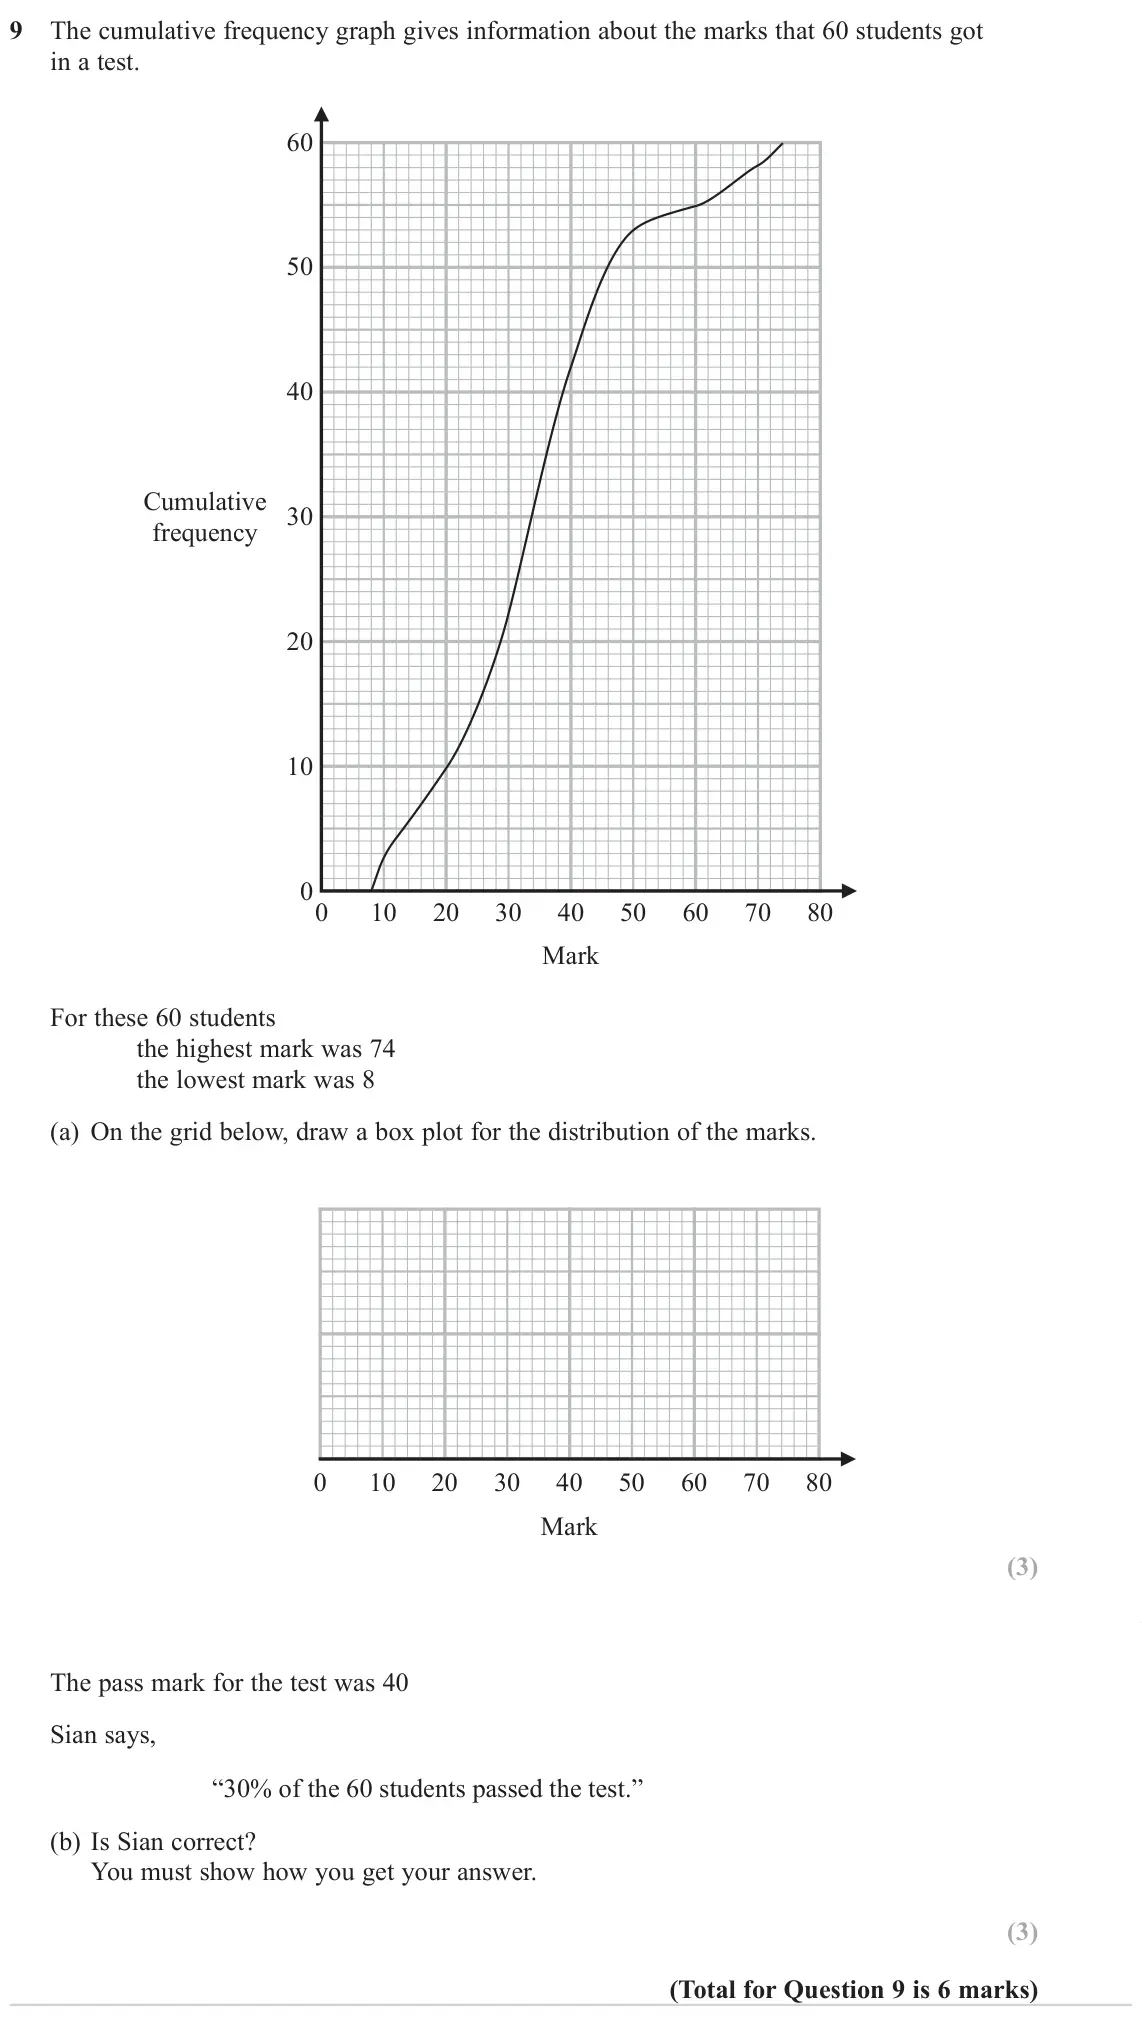
- November 2024, Paper 1H, Q9 (6 marks): The cumulative frequency graph gives information about the marks that 60 students got in a test. 60 50 40 Cumulative 30 frequency 20 10 0 0 10 20 30 40 50 60 70
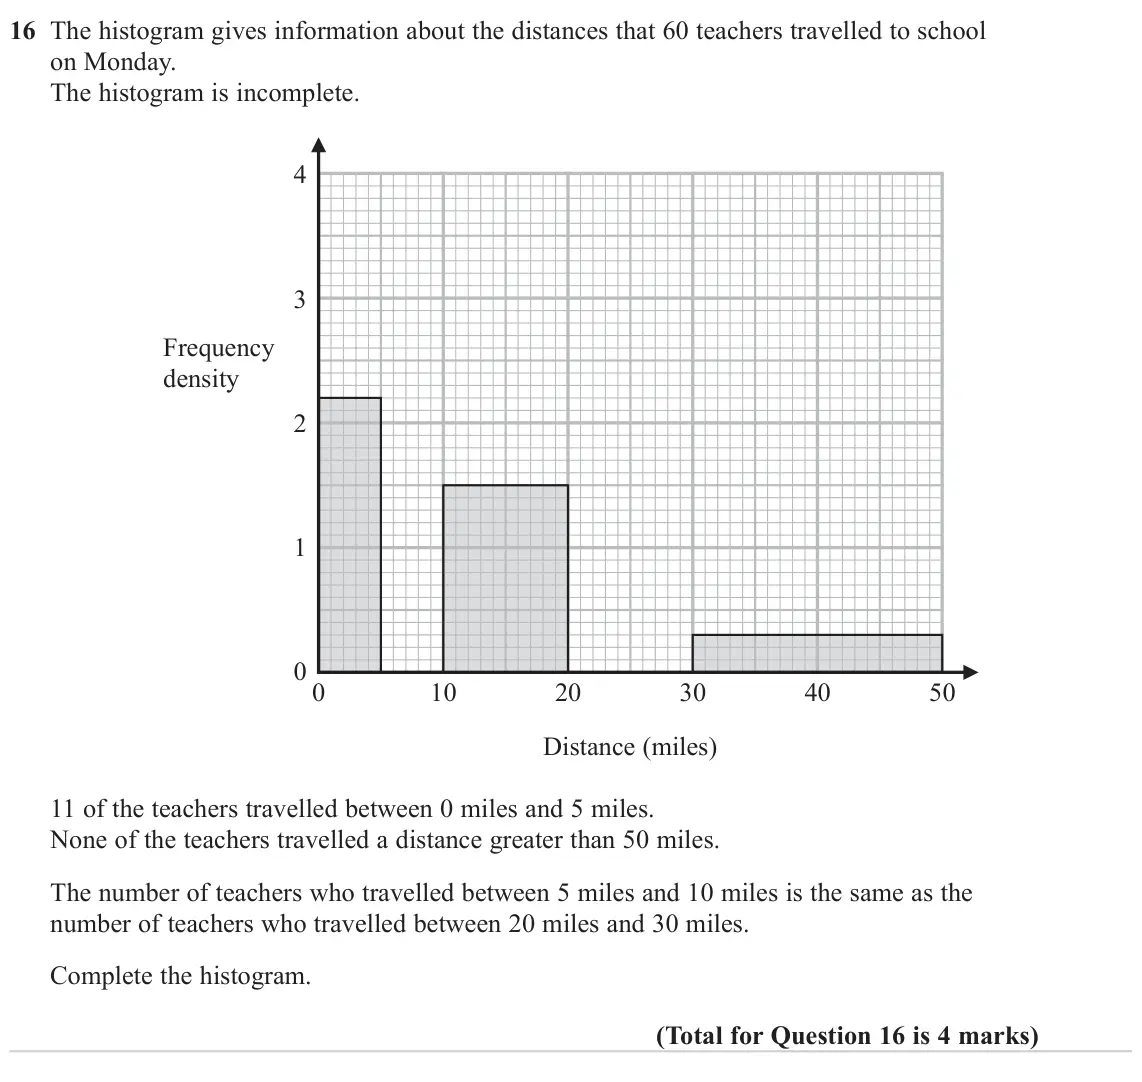
- November 2024, Paper 2H, Q16 (4 marks): The histogram gives information about the distances that 60 teachers travelled to school on Monday. The histogram is incomplete. 4 3 Frequency density 2 1 0 0 1
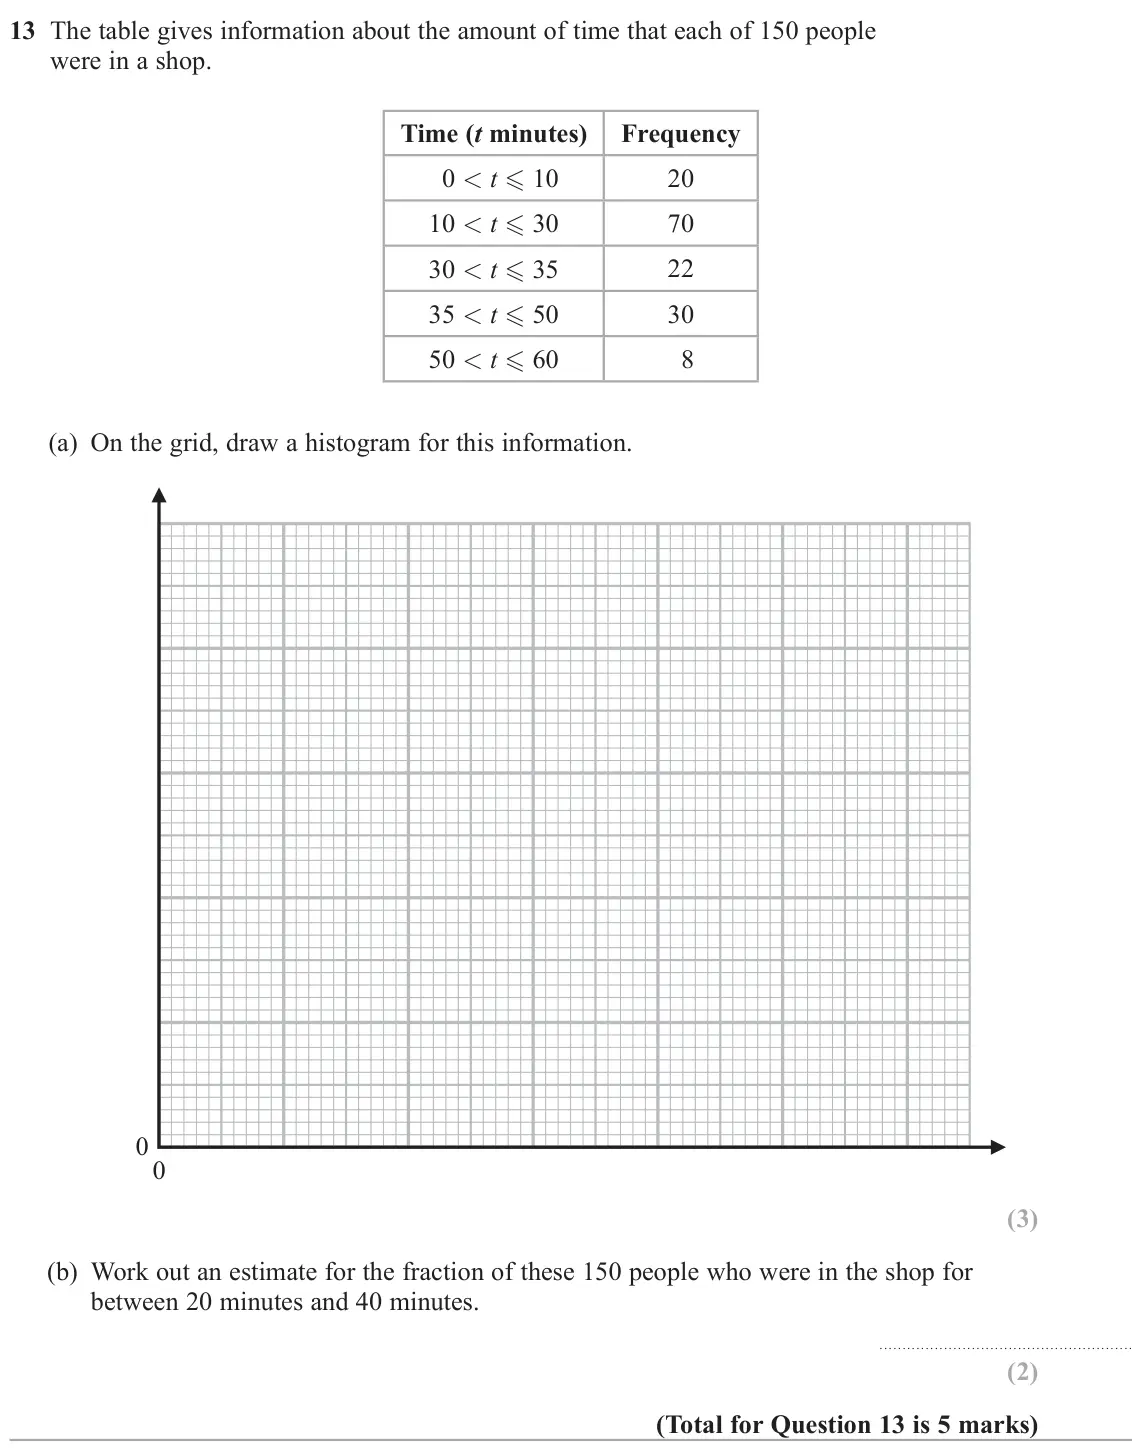
- June 2024, Paper 1H, Q13 (5 marks): The table gives information about the amount of time that each of 150 people were in a shop. Time (t minutes) Frequency 0 < t 10 20 10 < t 30 70 30 < t 35
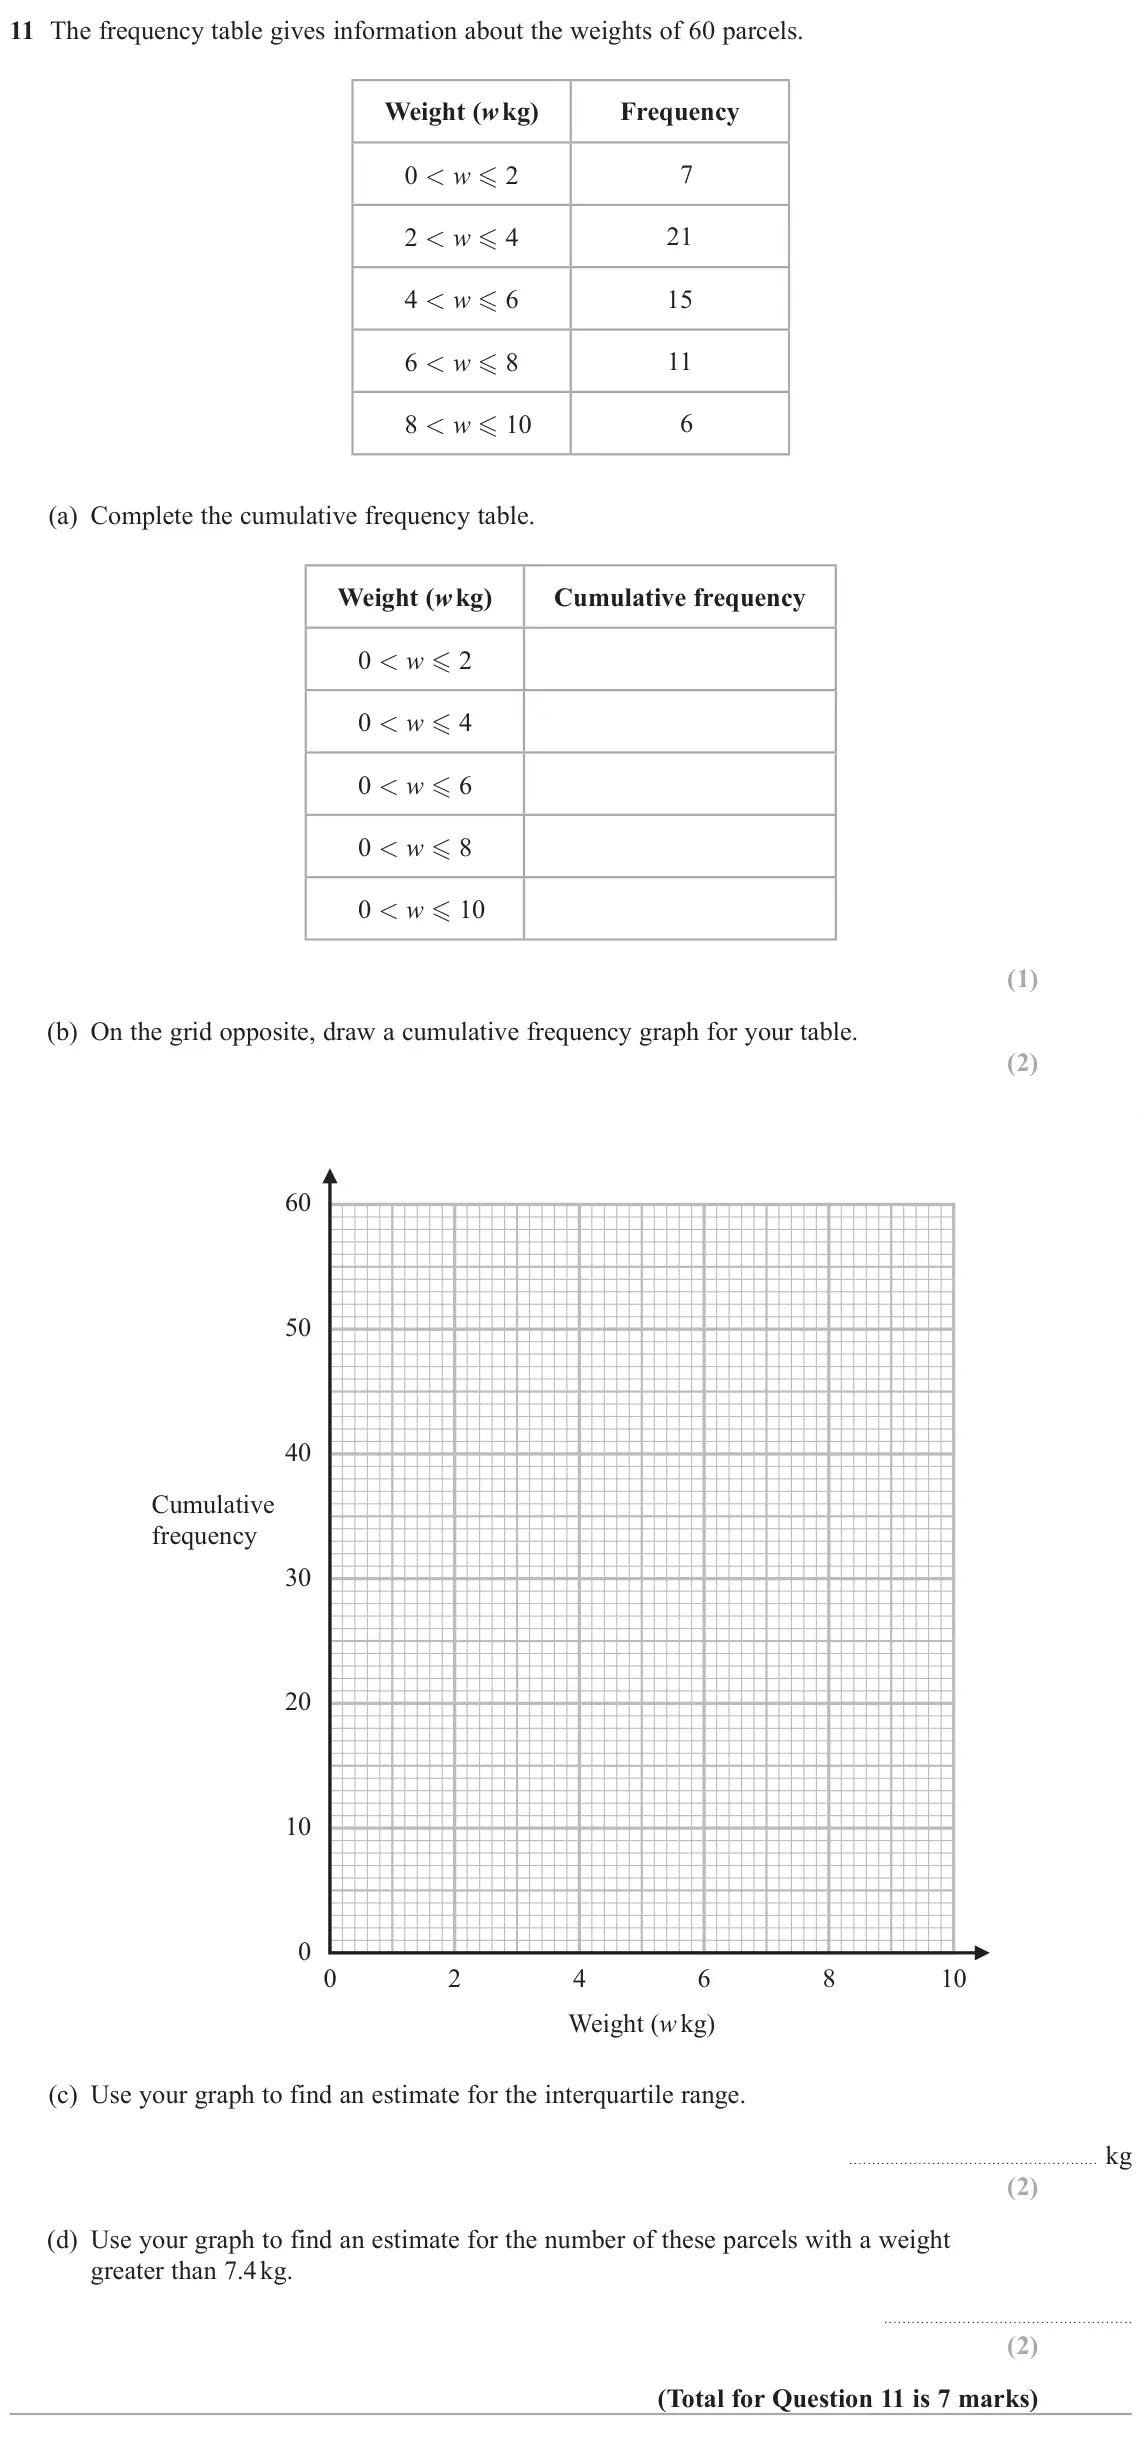
- June 2024, Paper 2H, Q11 (7 marks): The frequency table gives information about the weights of 60 parcels. Weight (w kg) Frequency 0 < w 2 7 2 < w 4 21 4 < w 6 15 6 < w 8 11 8 < w 10 6 (
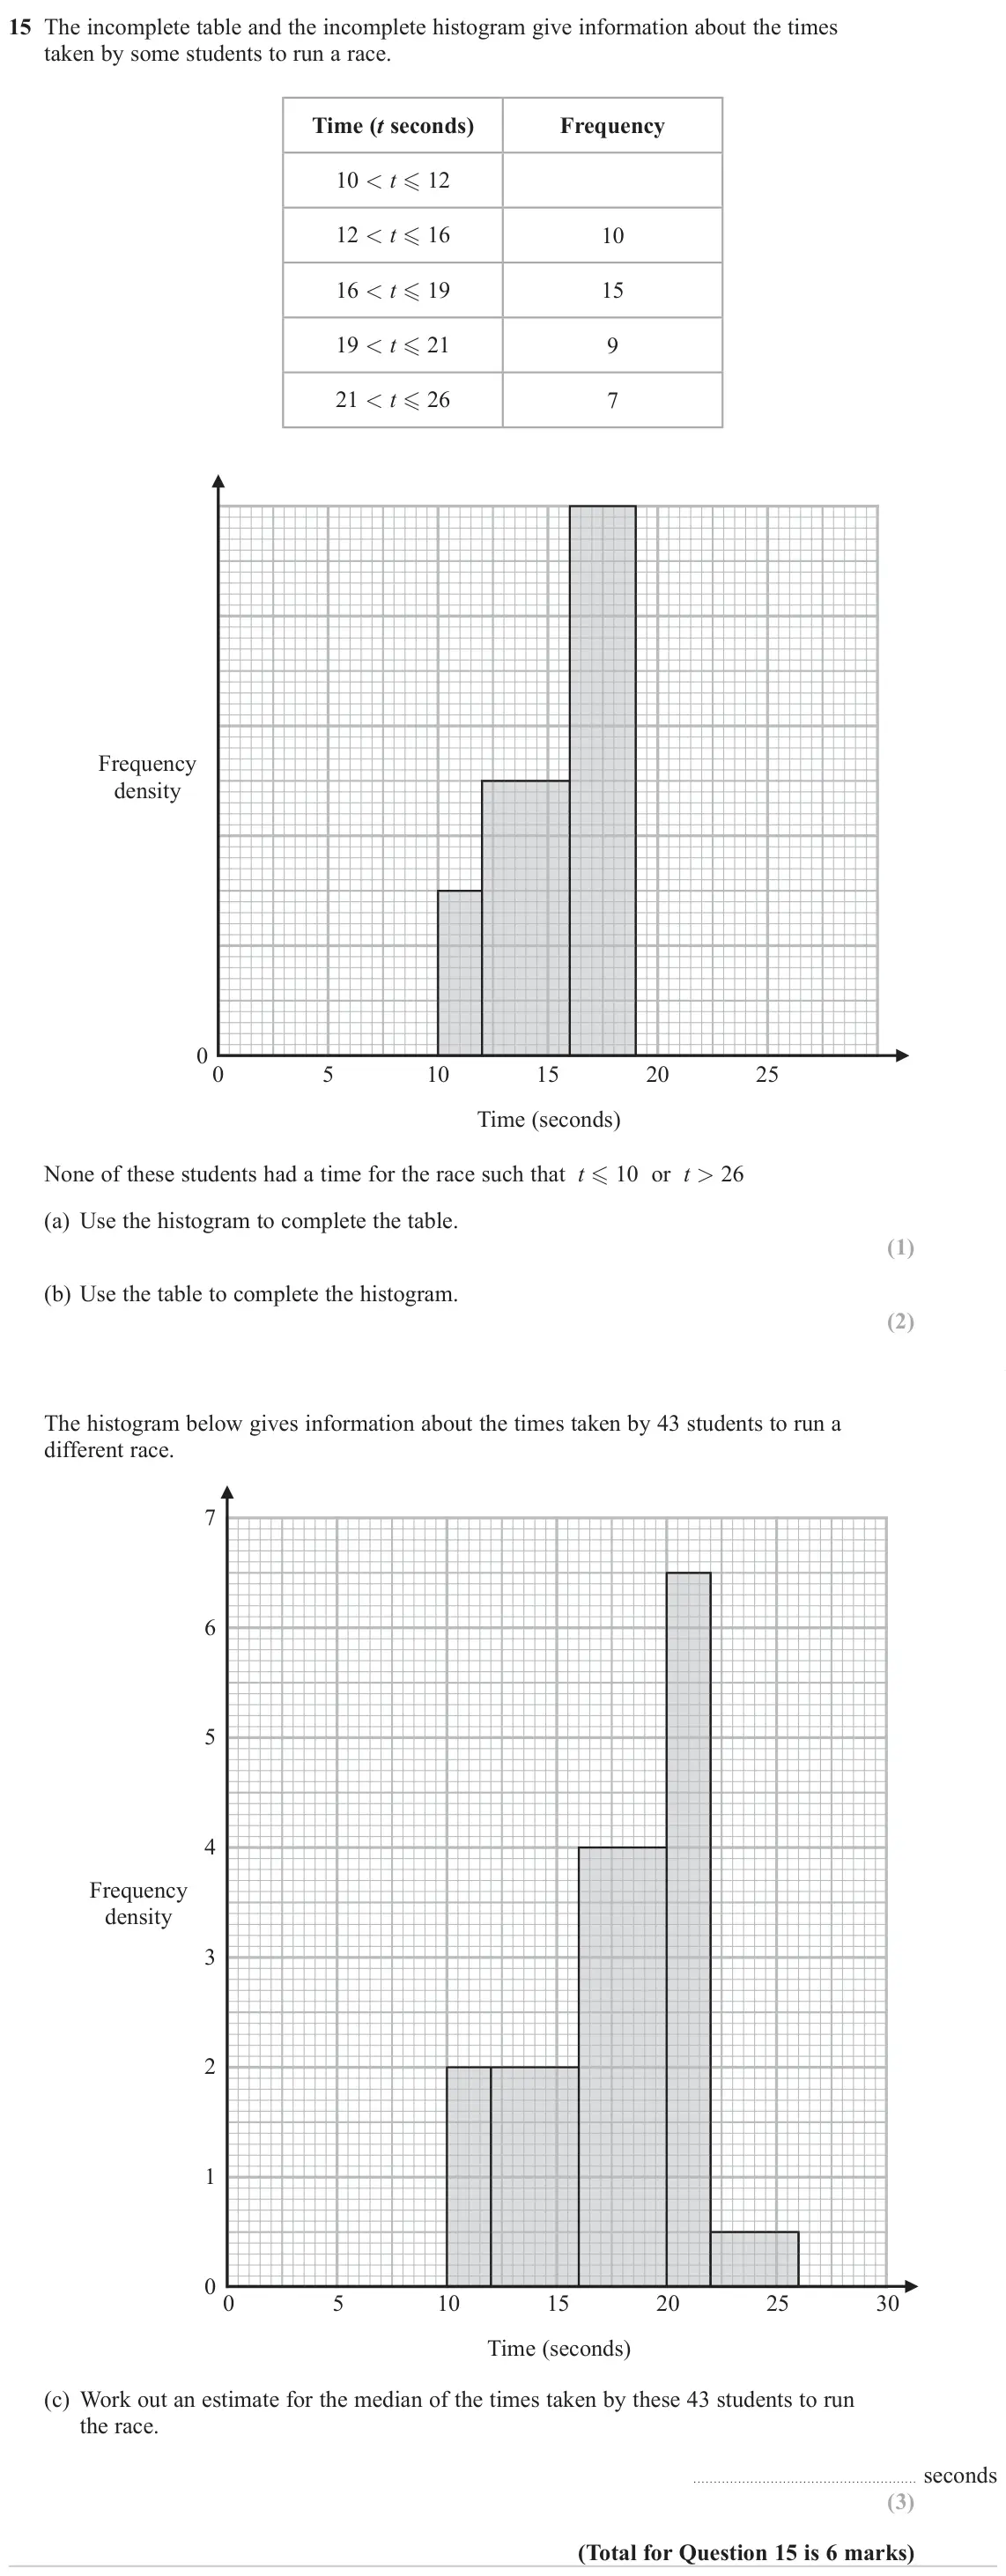
- November 2023, Paper 2H, Q15 (6 marks): The incomplete table and the incomplete histogram give information about the times taken by some students to run a race. Time (t seconds) Frequency 10 < t 12
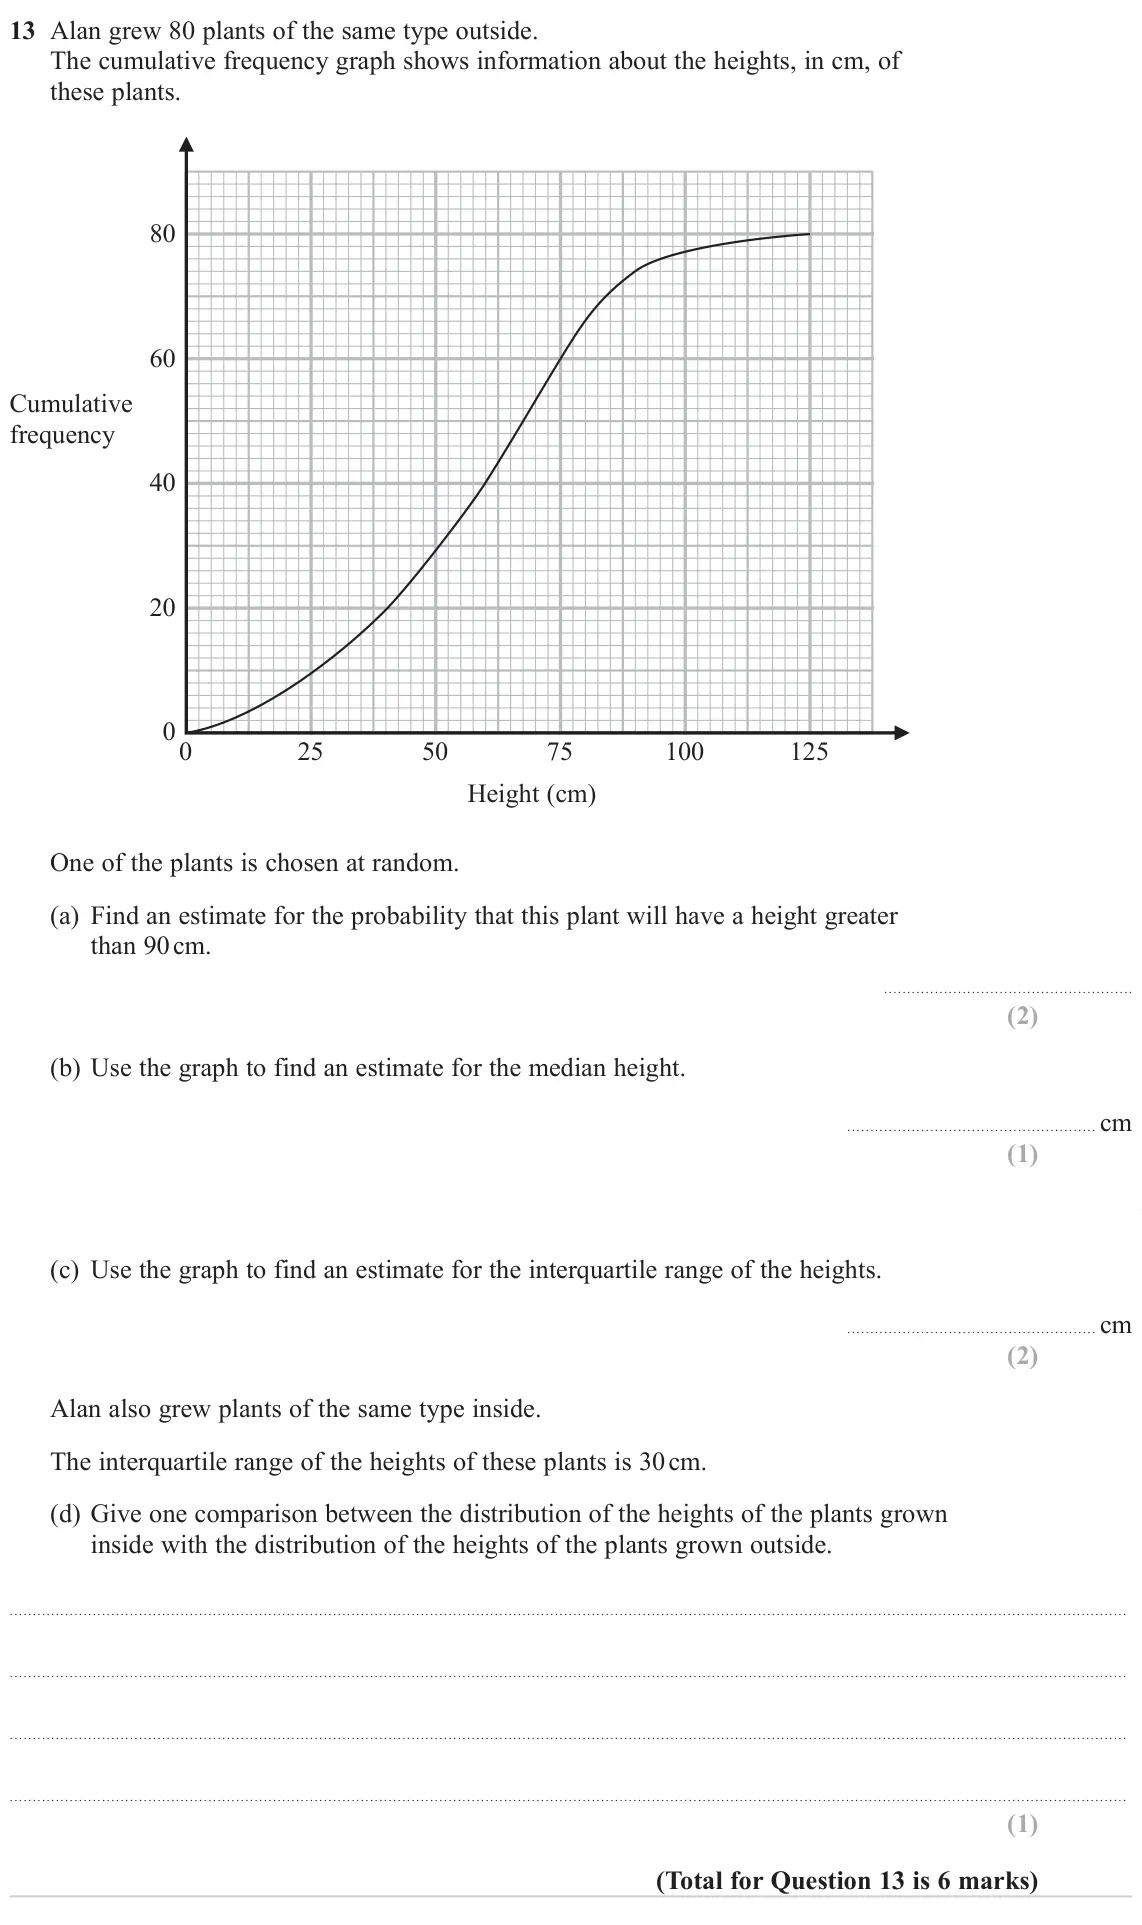
- November 2023, Paper 3H, Q13 (6 marks): Alan grew 80 plants of the same type outside. The cumulative frequency graph shows information about the heights, in cm, of these plants. 80 60 Cumulative frequ
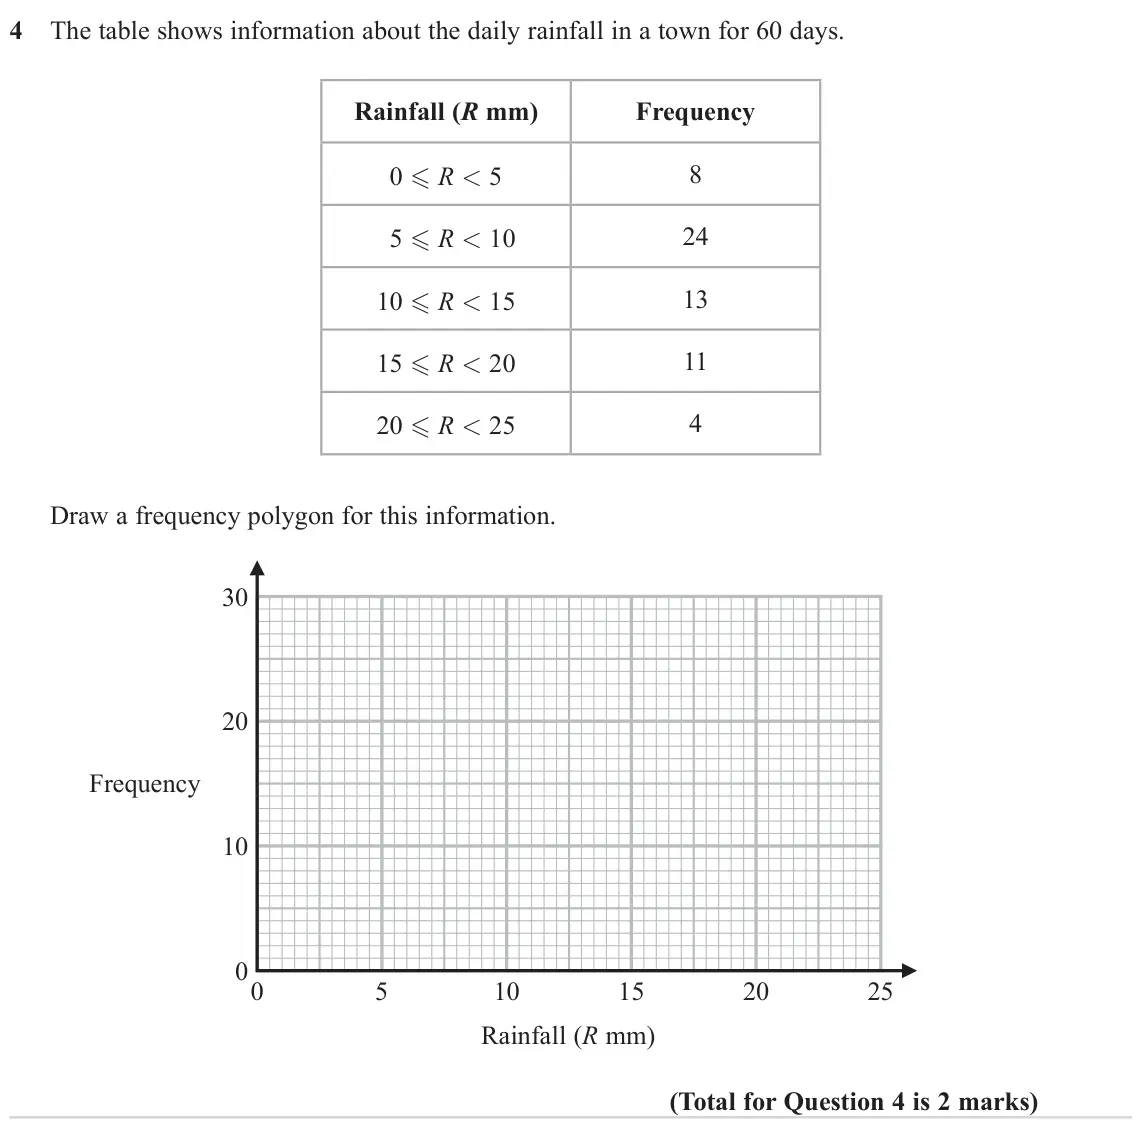
- June 2023, Paper 1H, Q4 (2 marks): The table shows information about the daily rainfall in a town for 60 days. Rainfall (R mm) Frequency 0 R < 5 8 24 5 R < 10 10 R < 15 13 15 R < 20 11 4
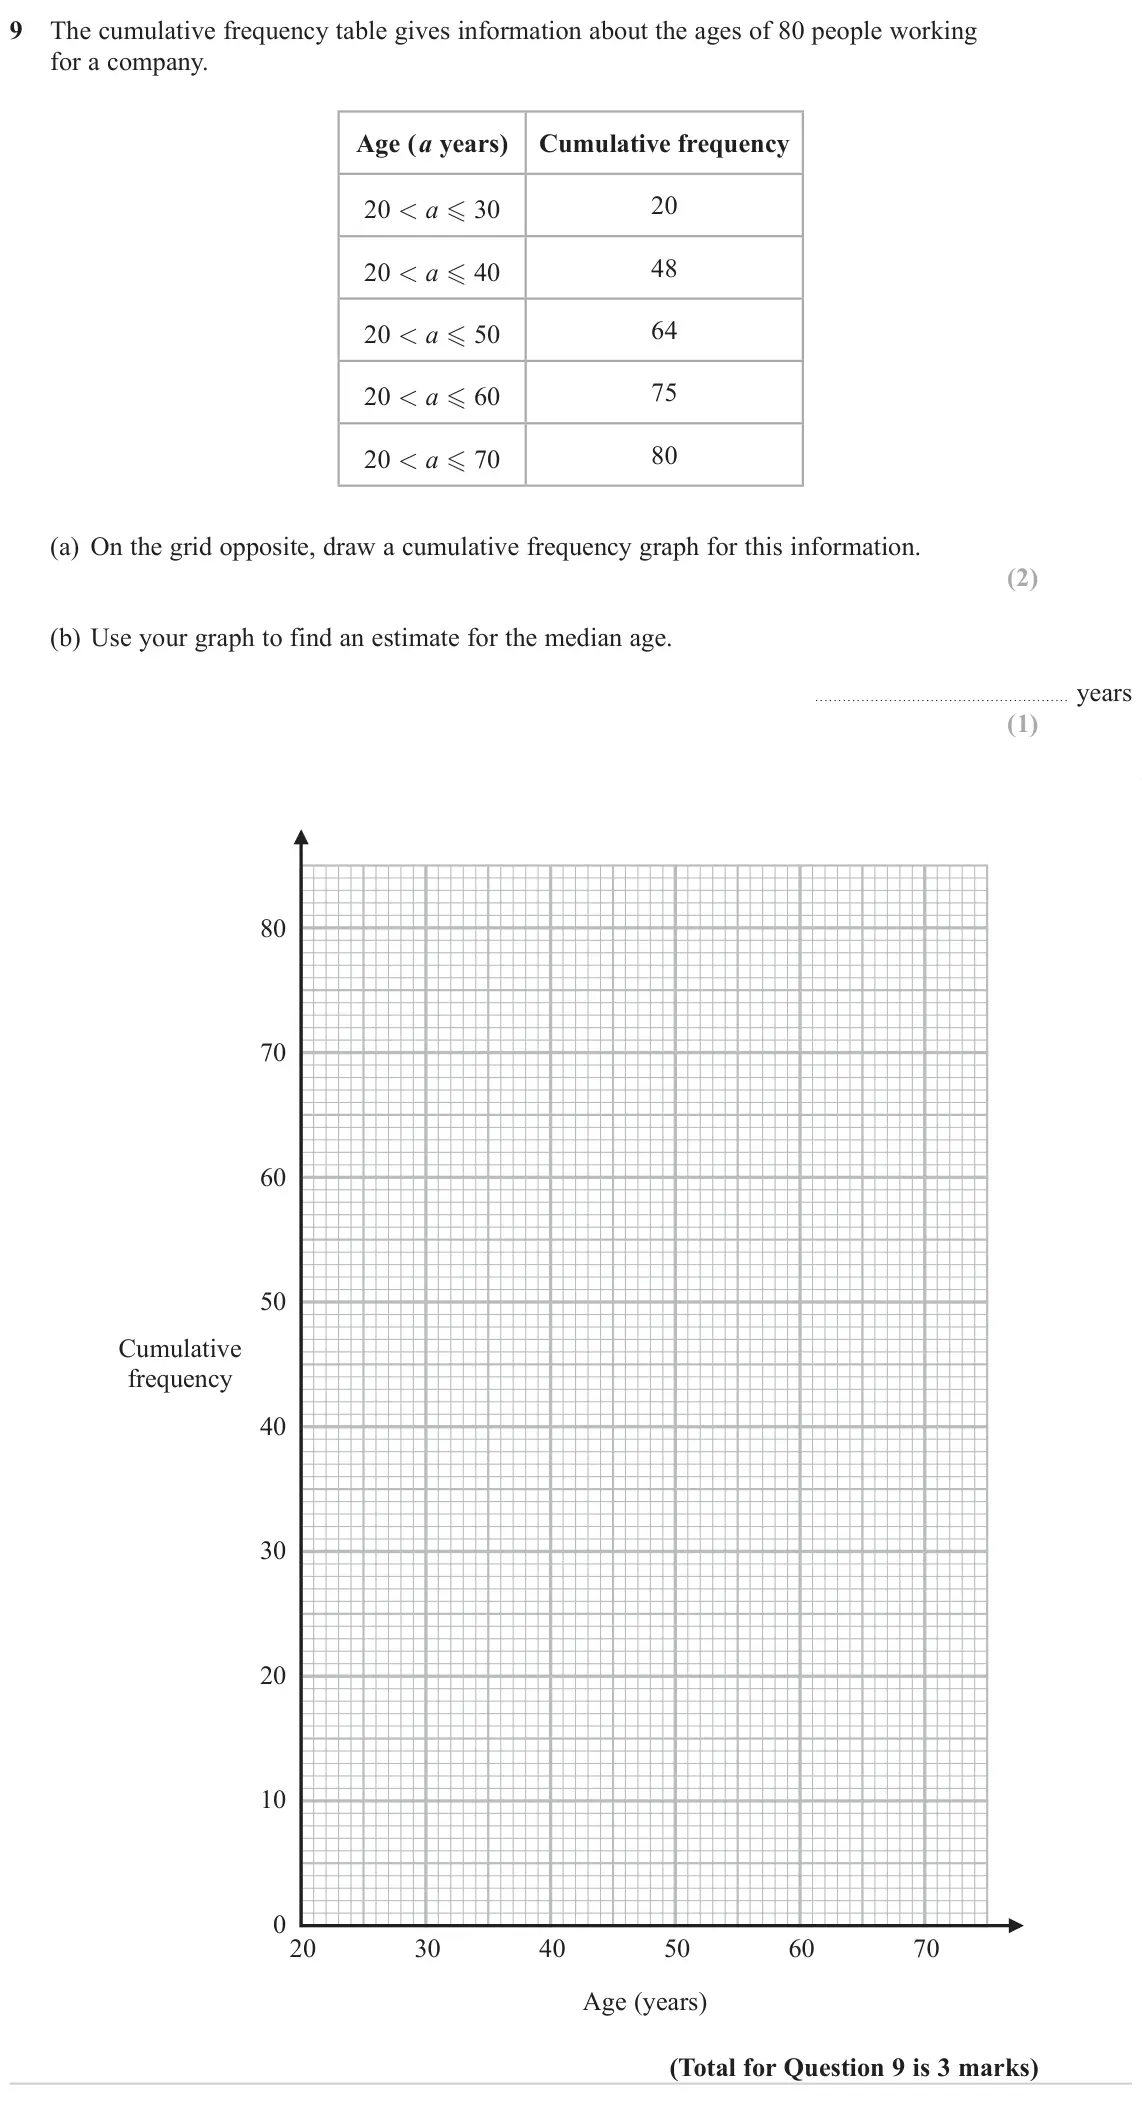
- June 2023, Paper 2H, Q9 (3 marks): The cumulative frequency table gives information about the ages of 80 people working for a company. Age (a years) Cumulative frequency 20 20 < a 30 48 20 < a
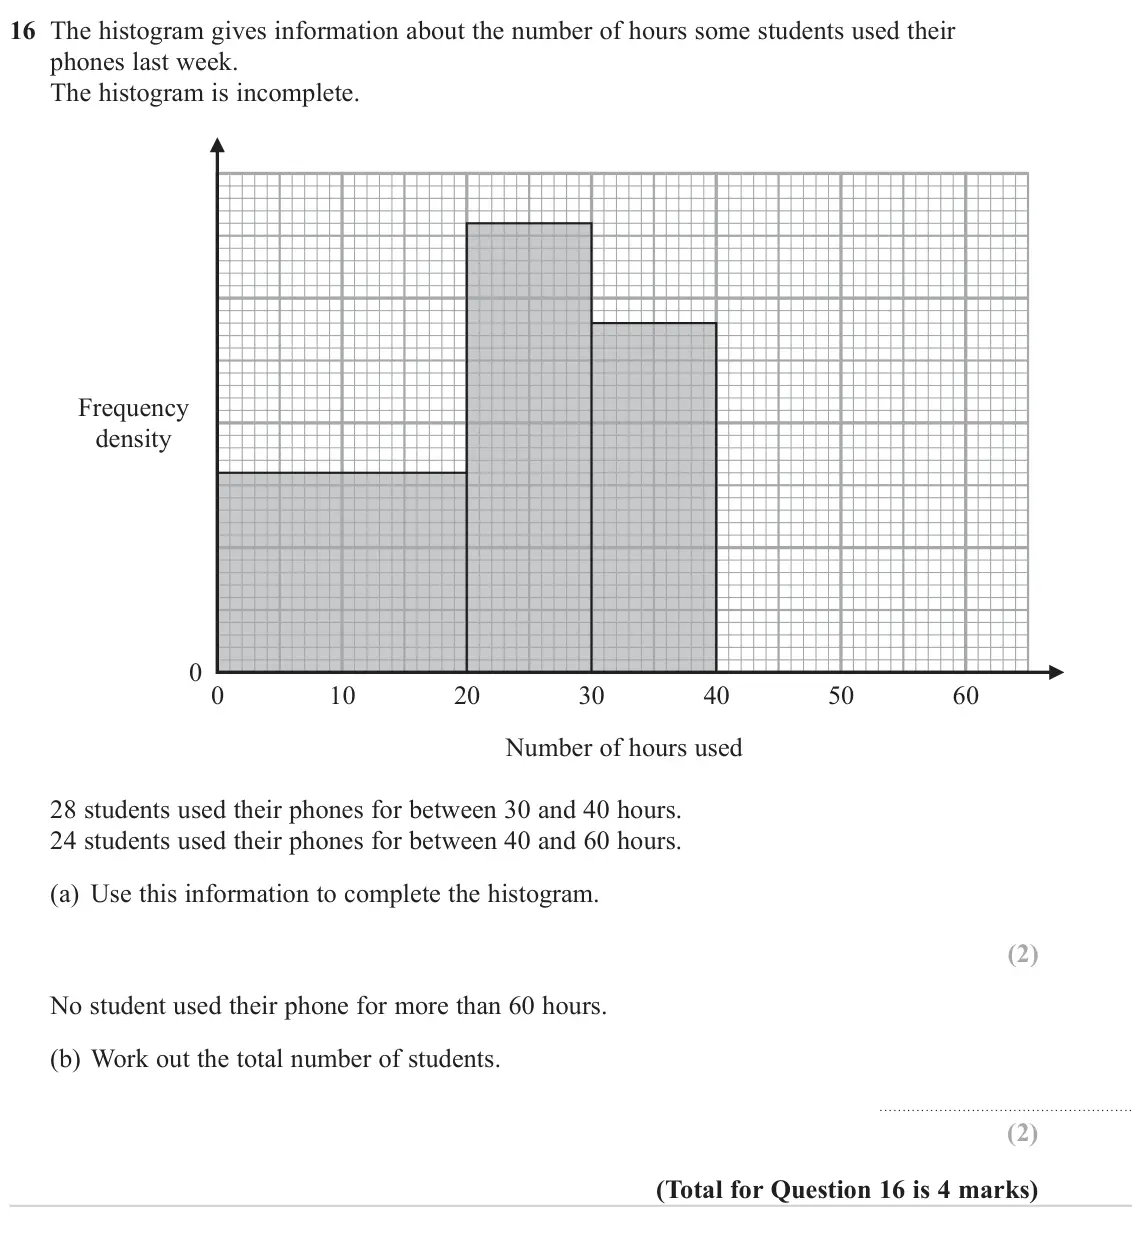
- June 2023, Paper 2H, Q16 (4 marks): The histogram gives information about the number of hours some students used their phones last week. The histogram is incomplete. Frequency density 0 0 10 20 30
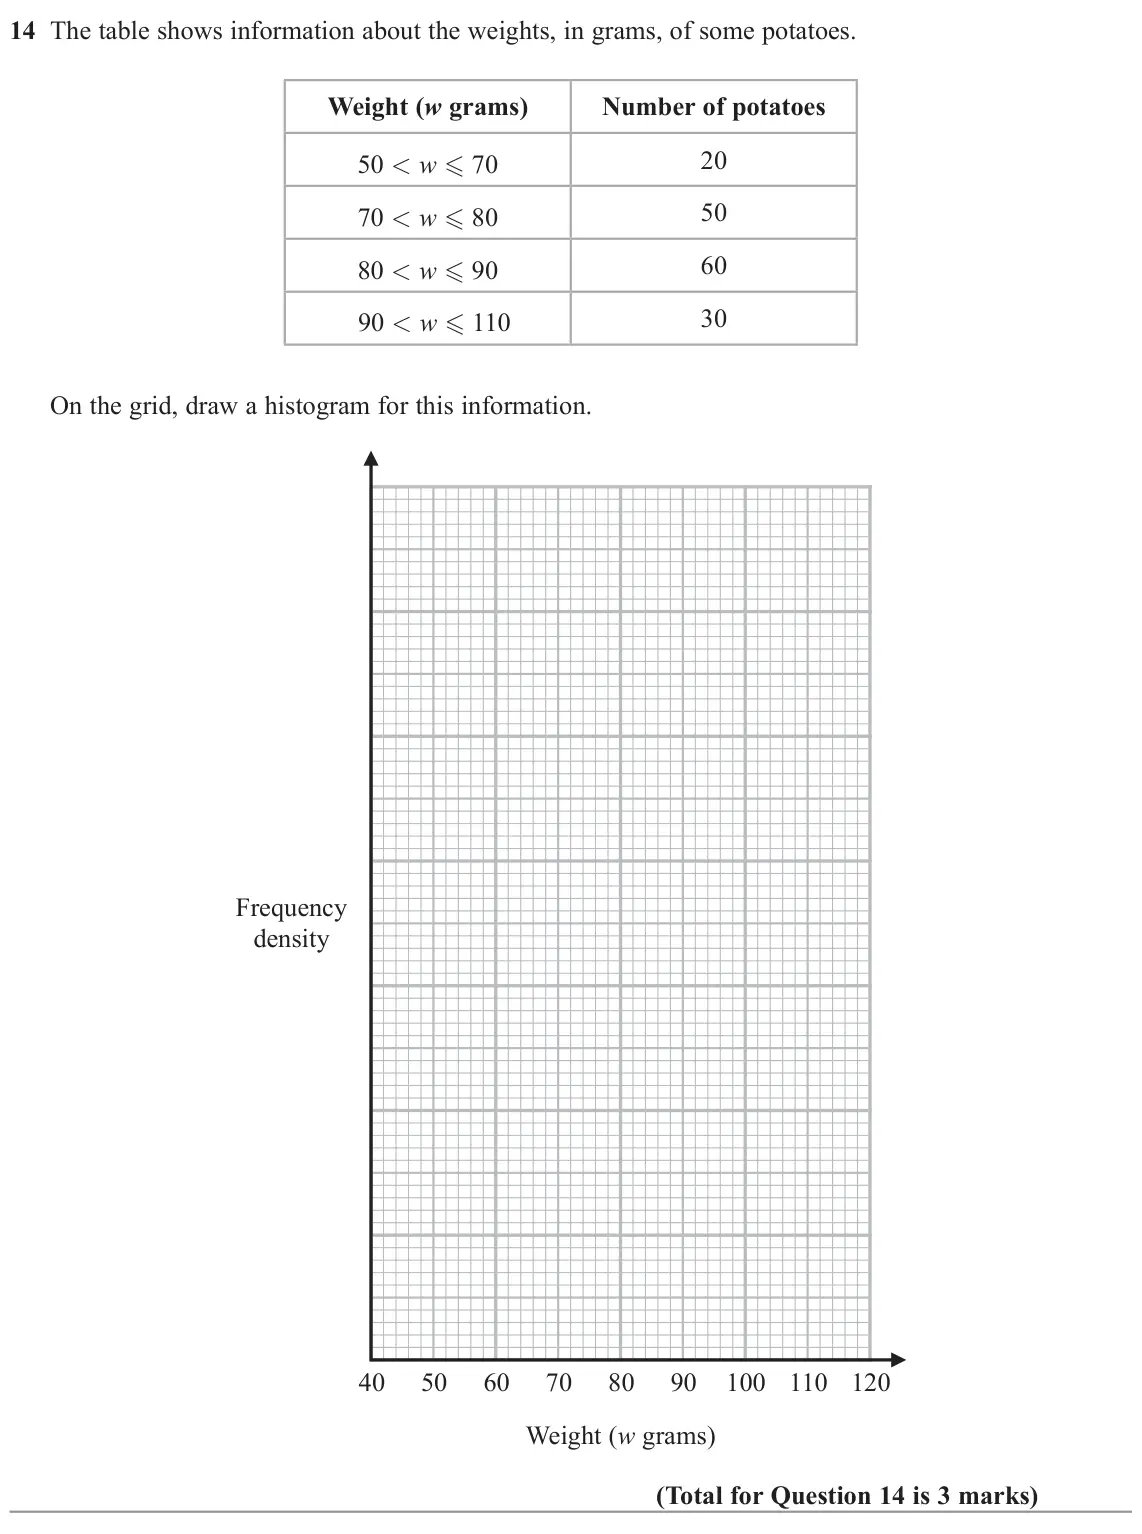
- November 2022, Paper 1H, Q14 (3 marks): The table shows information about the weights, in grams, of some potatoes. Weight (w grams) Number of potatoes 20 50 < w 70 50 70 < w 80 60 80 < w 90 30 9
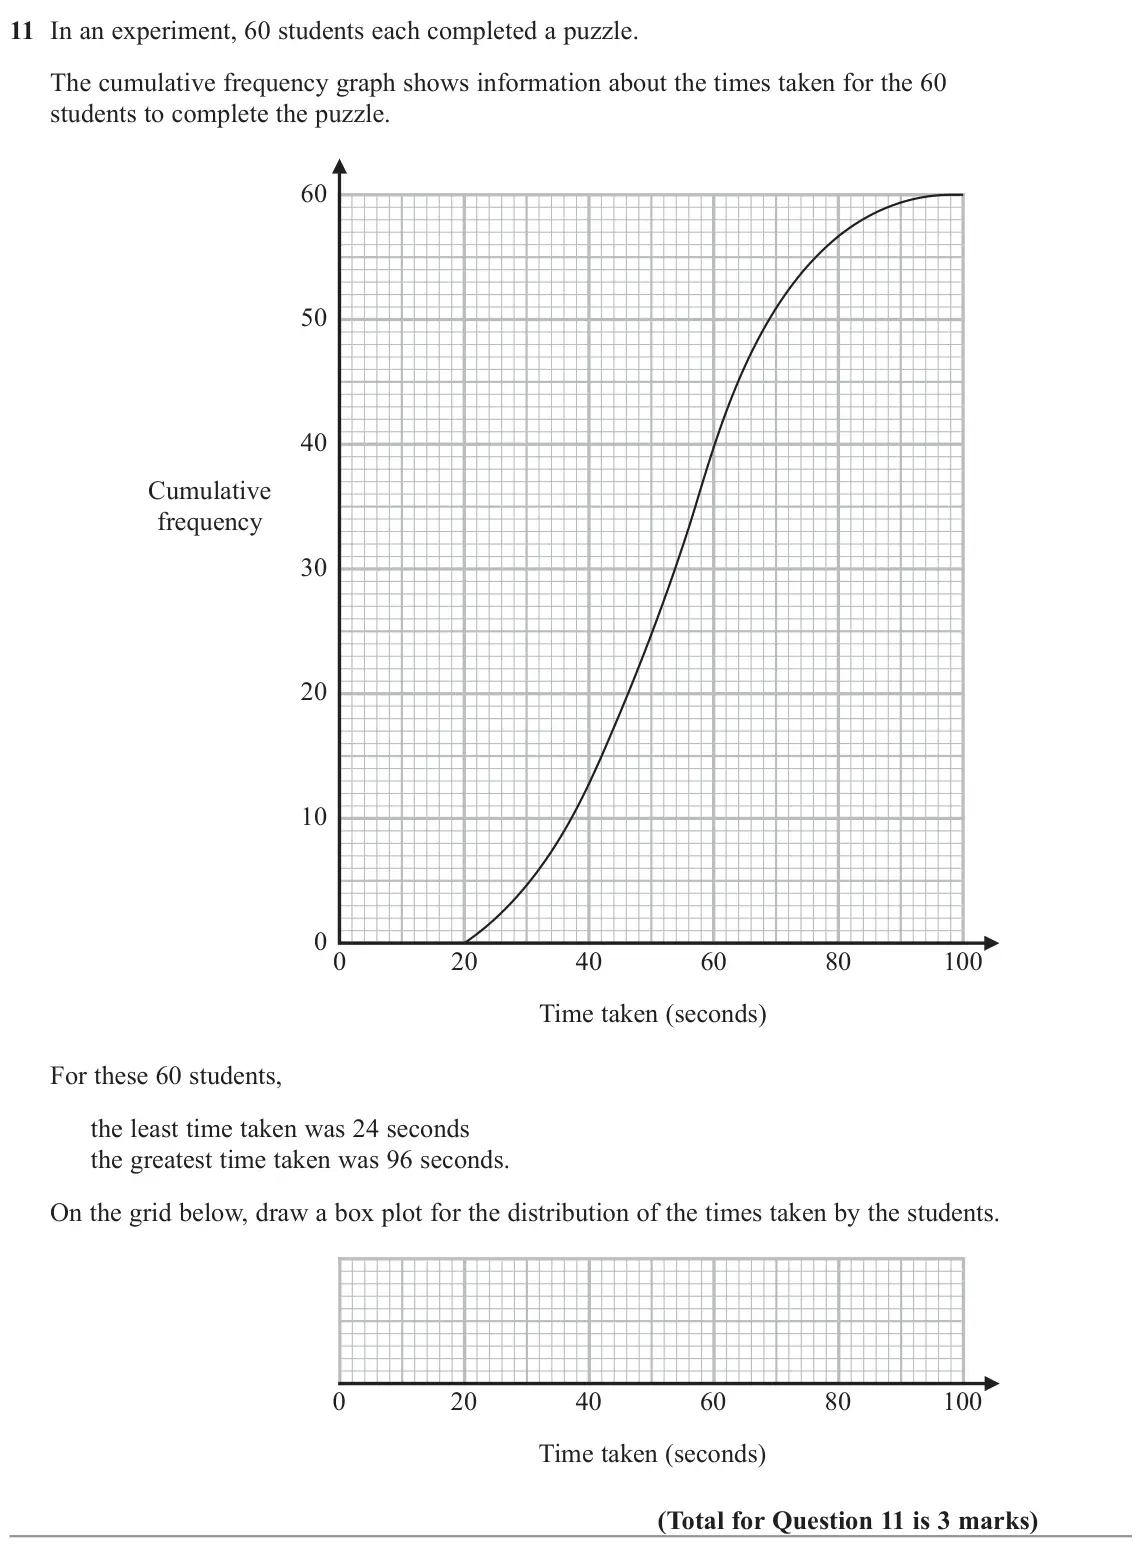
- November 2022, Paper 2H, Q11 (3 marks): In an experiment, 60 students each completed a puzzle. The cumulative frequency graph shows information about the times taken for the 60 students to complete th
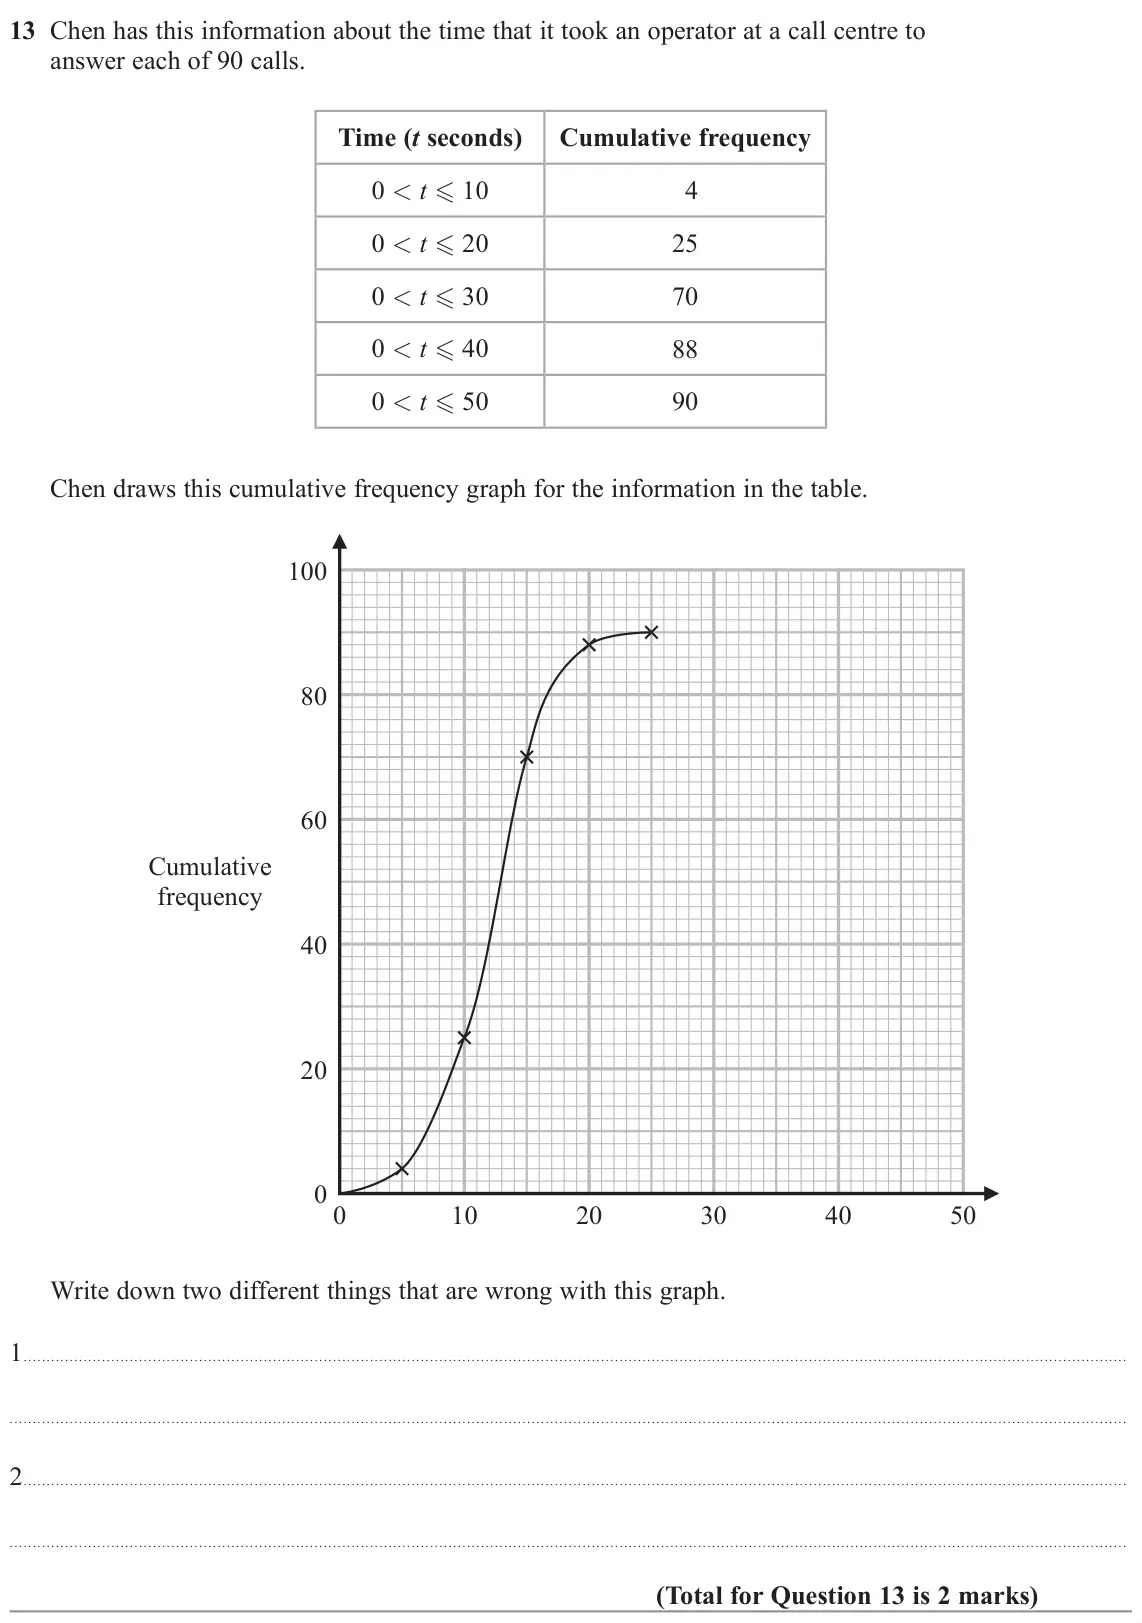
- November 2022, Paper 3H, Q13 (2 marks): Chen has this information about the time that it took an operator at a call centre to answer each of 90 calls. Time (t seconds) Cumulative frequency 0 < t 10
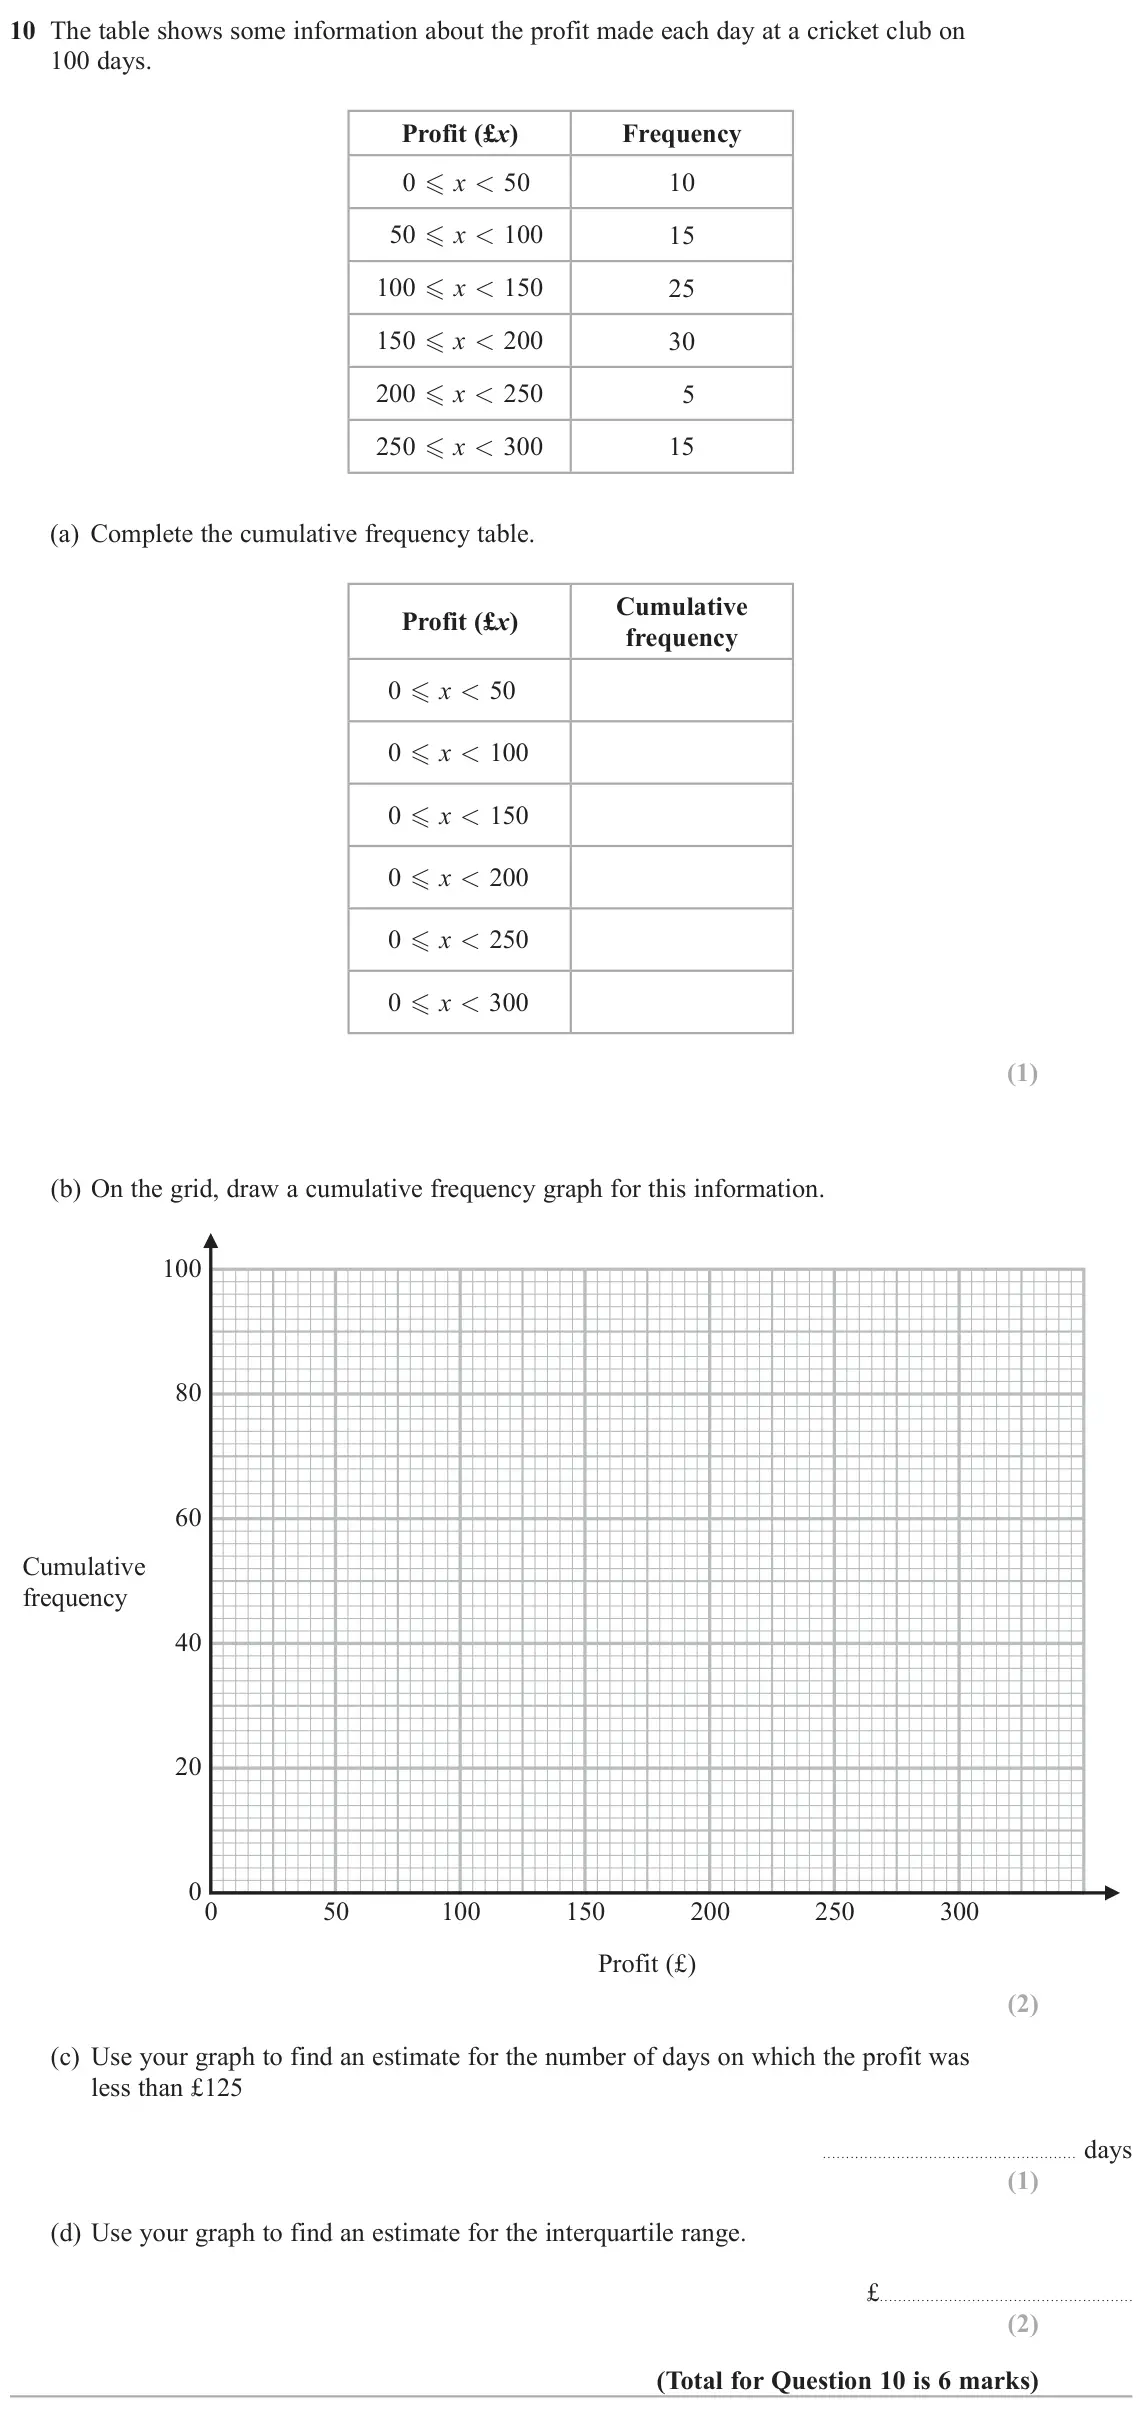
- June 2022, Paper 1H, Q10 (6 marks): The table shows some information about the profit made each day at a cricket club on 100 days. Profit (£x) Frequency 0 x < 50 10 50 x < 100 15 100 x < 150
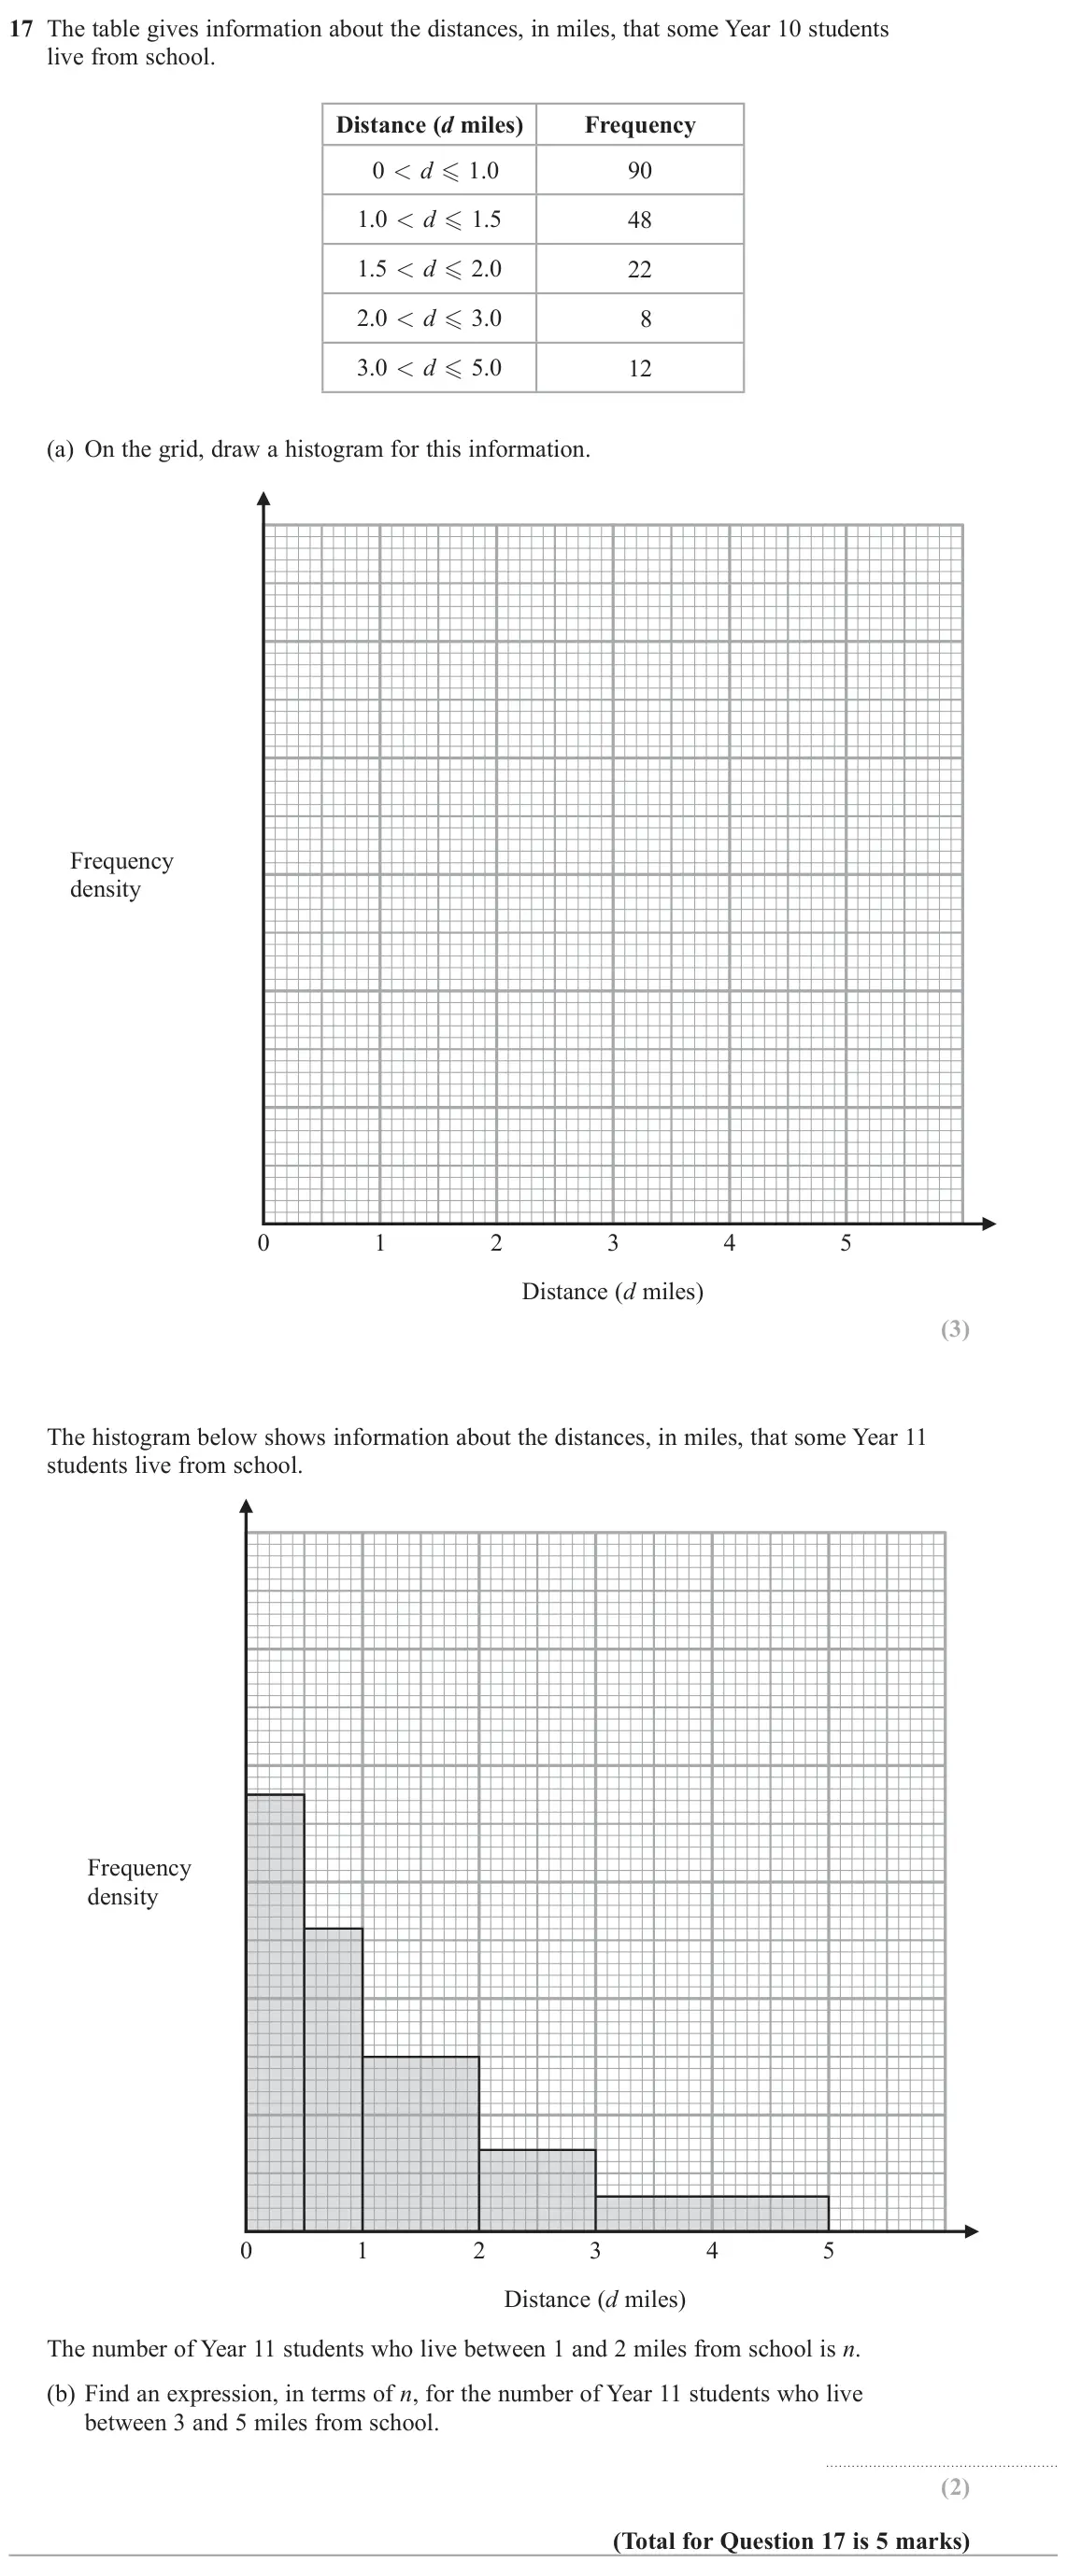
- June 2022, Paper 3H, Q17 (5 marks): The table gives information about the distances, in miles, that some Year 10 students live from school. Distance (d miles) Frequency 0 < d 1.0 90 1.0 < d 1.
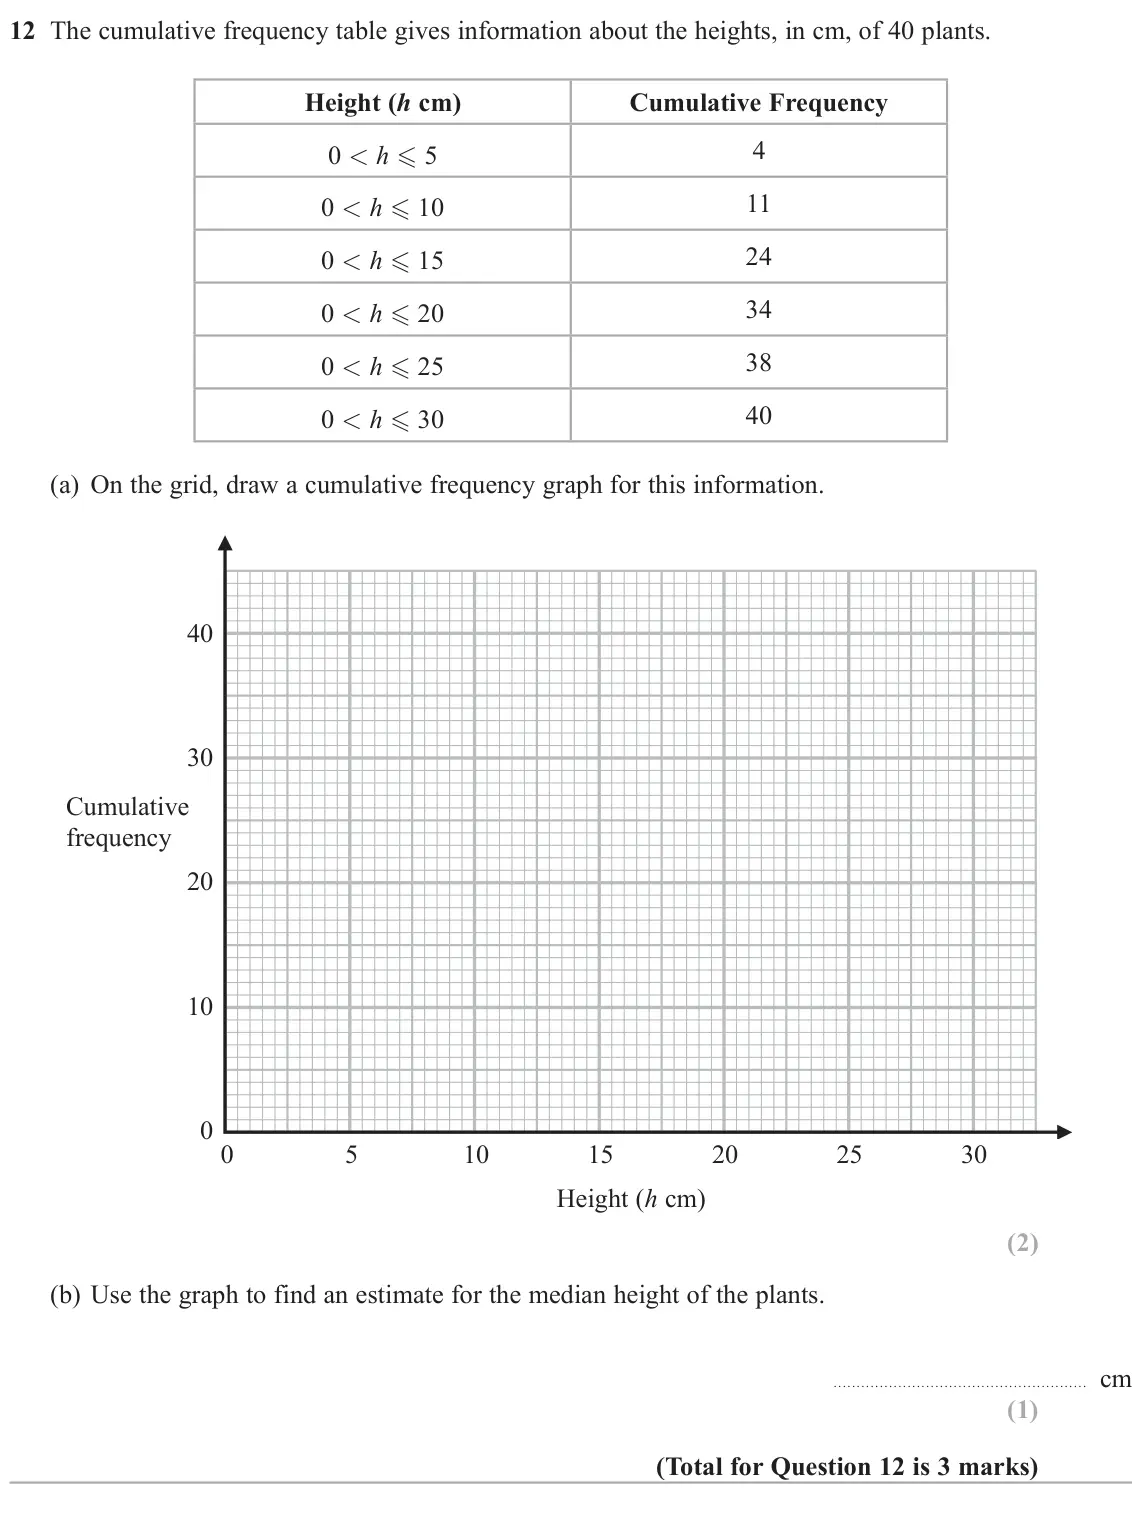
- November 2021, Paper 1H, Q12 (3 marks): The cumulative frequency table gives information about the heights, in cm, of 40 plants. Height (h cm) Cumulative Frequency 4 0 < h 5 11 0 < h 10 24 0 < h
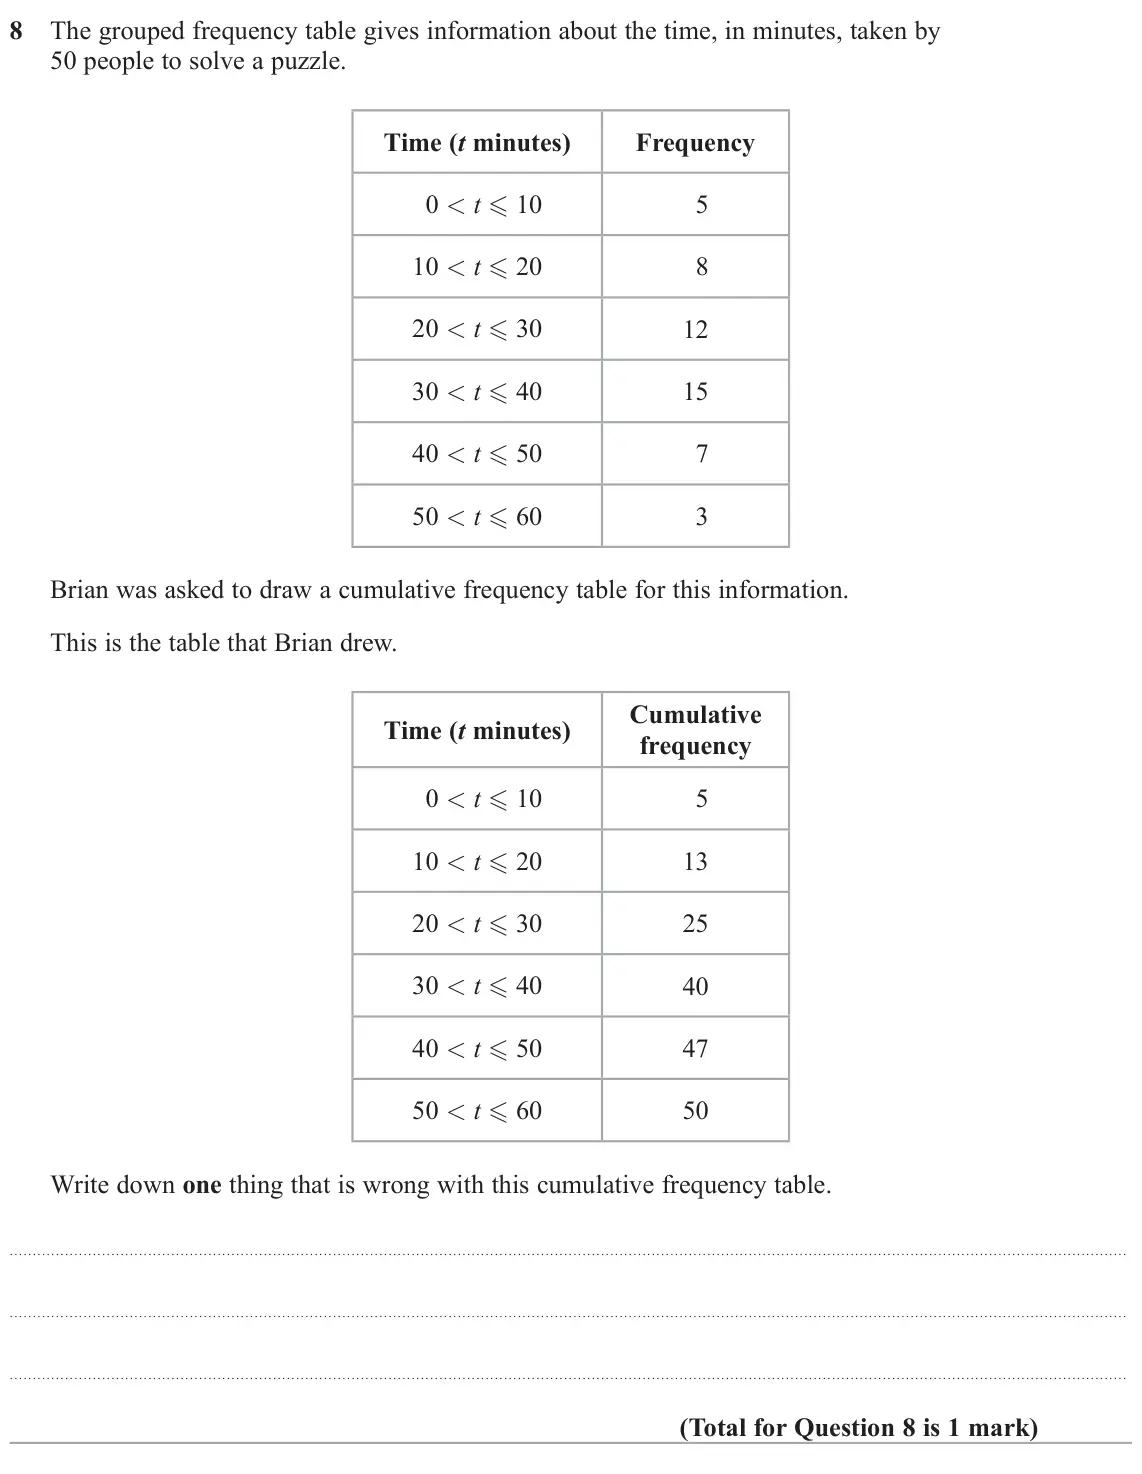
- November 2021, Paper 2H, Q8 (1 mark): The grouped frequency table gives information about the time, in minutes, taken by 50 people to solve a puzzle. Time (t minutes) Frequency 0 < t 10 5 10 < t
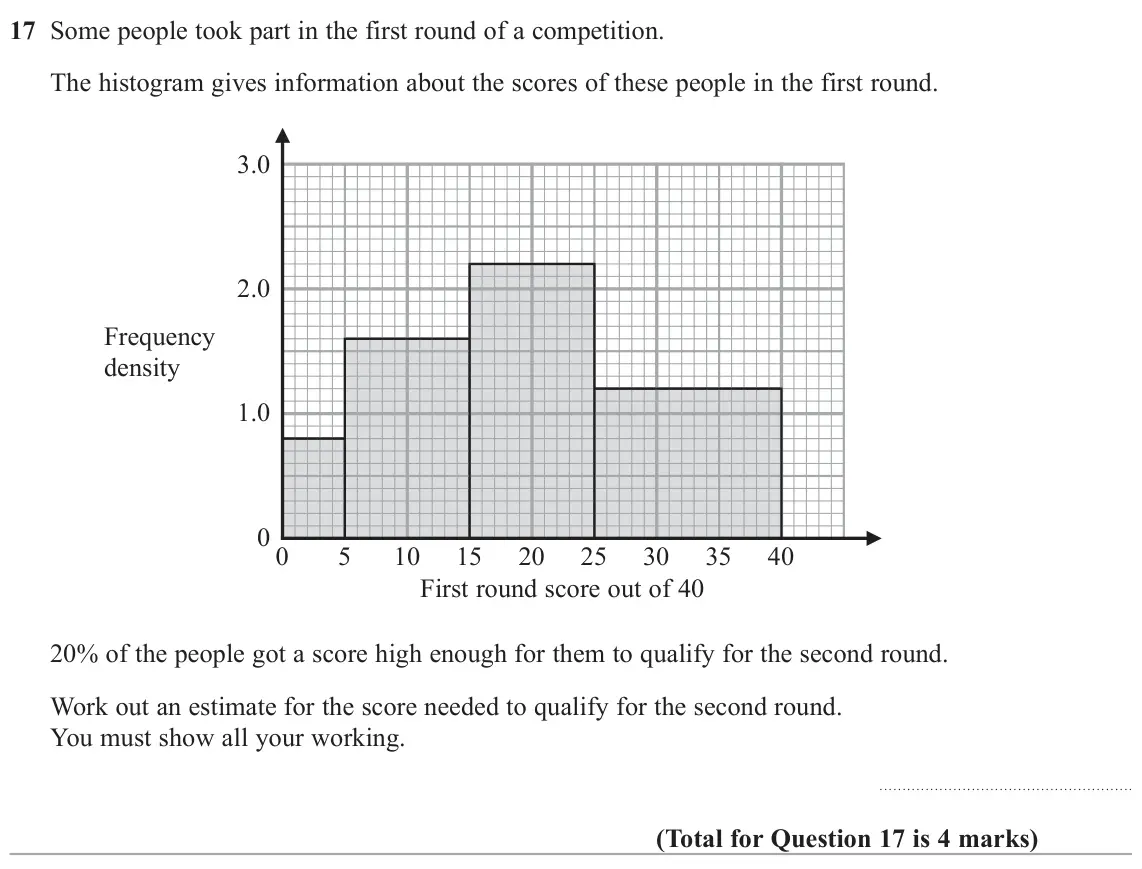
- November 2021, Paper 2H, Q17 (4 marks): Some people took part in the first round of a competition. The histogram gives information about the scores of these people in the first round. 3.0 2.0 Frequenc
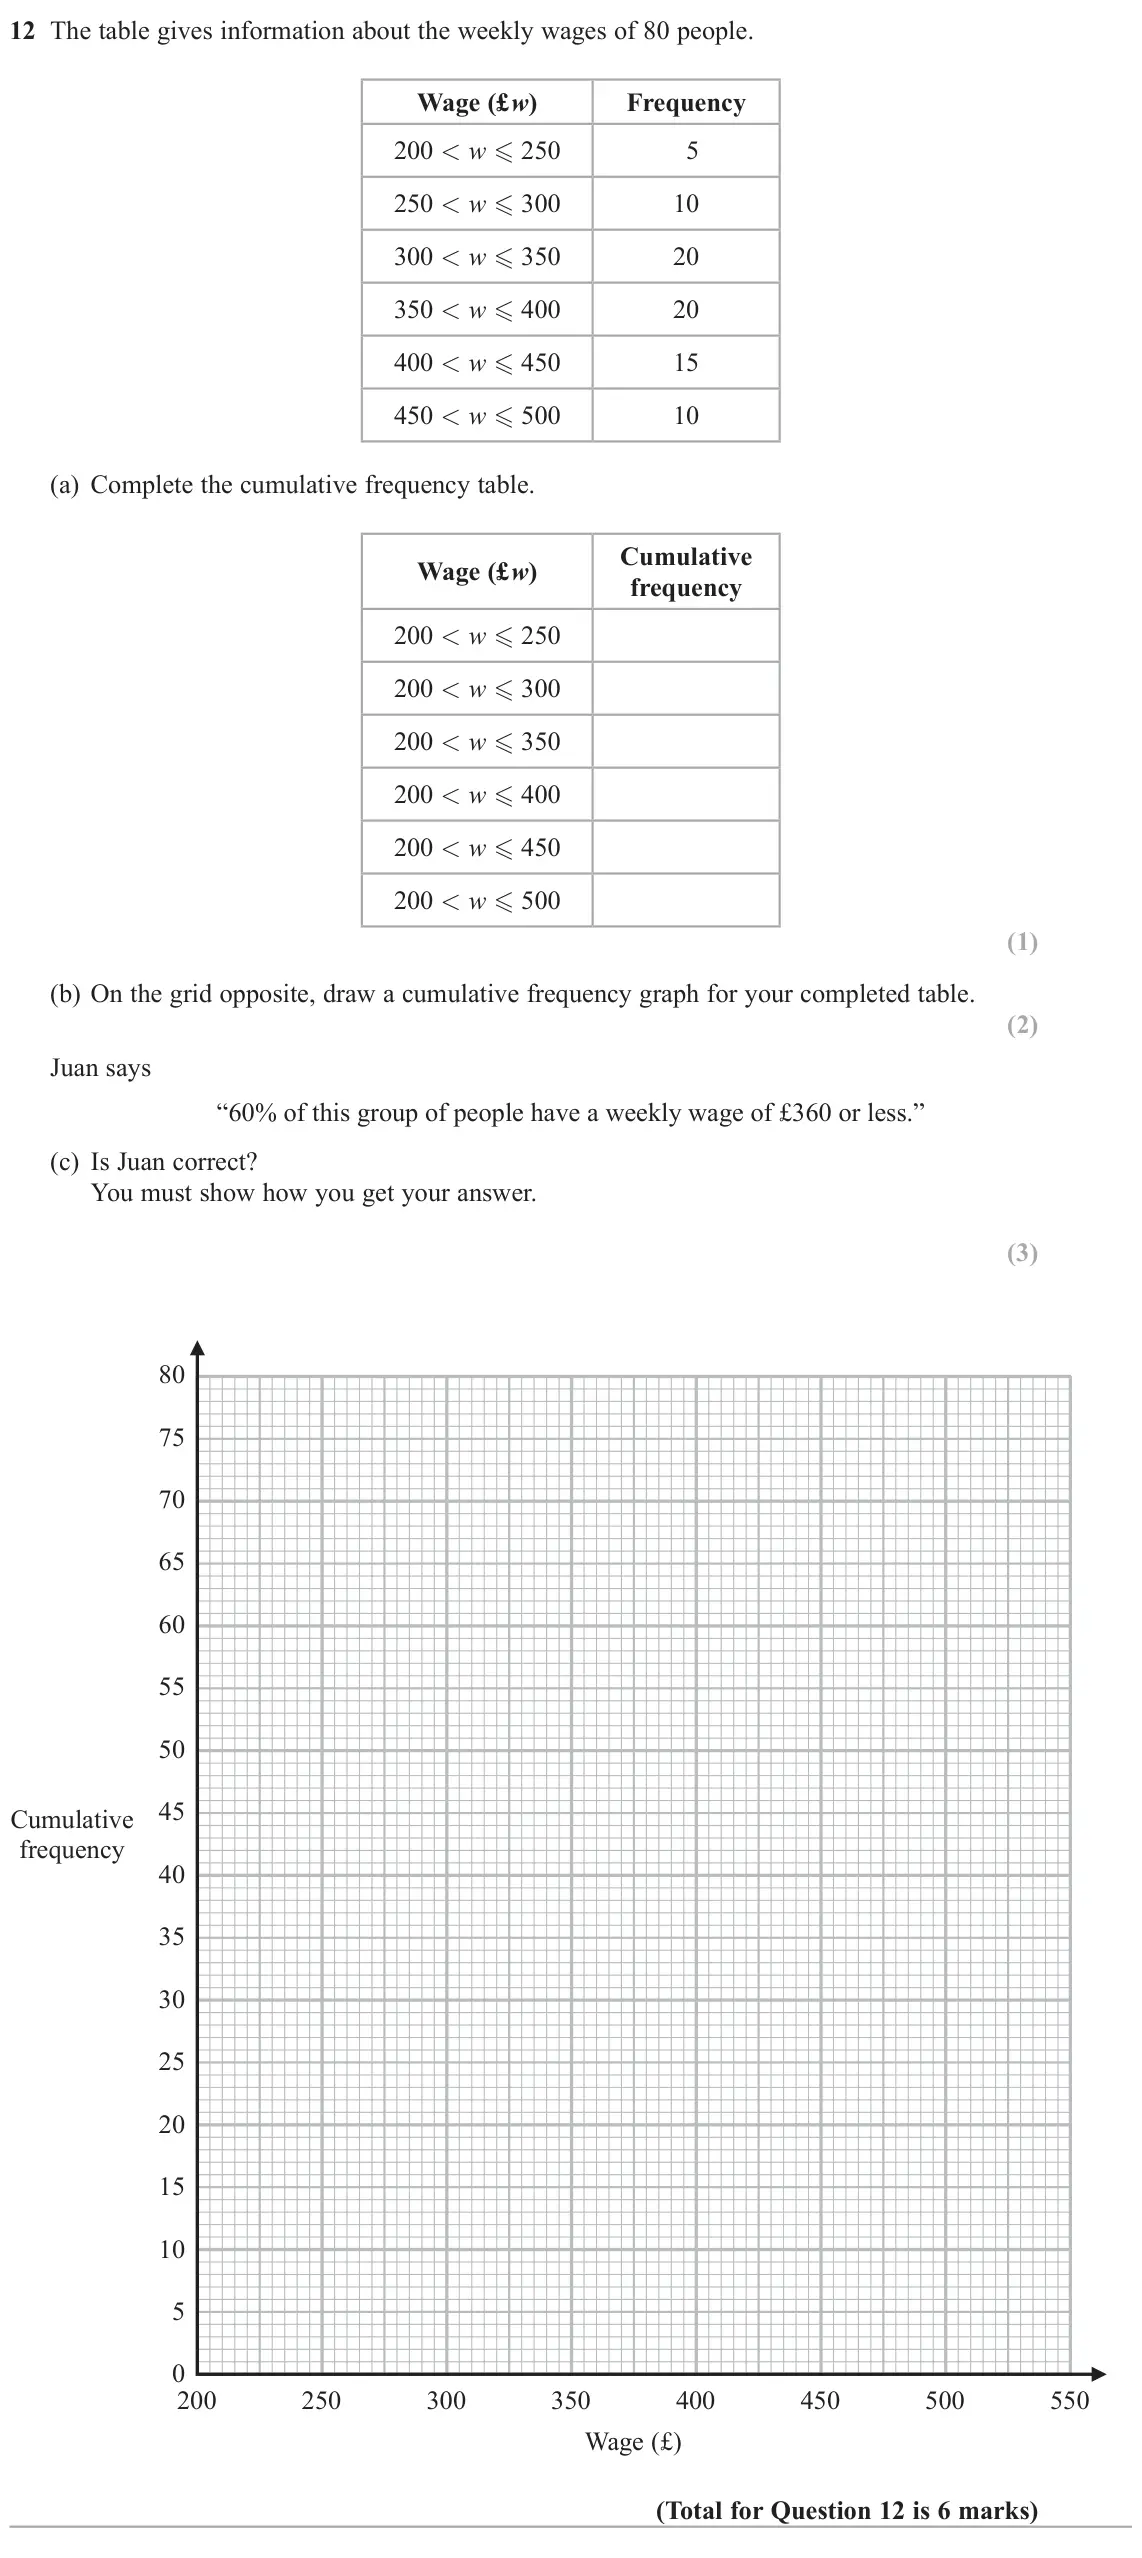
- November 2020, Paper 1H, Q12 (6 marks): The table gives information about the weekly wages of 80 people. Wage (£w) Frequency 200 < w 250 5 250 < w 300 10 300 < w 350 20 350 < w 400 20 400 < w
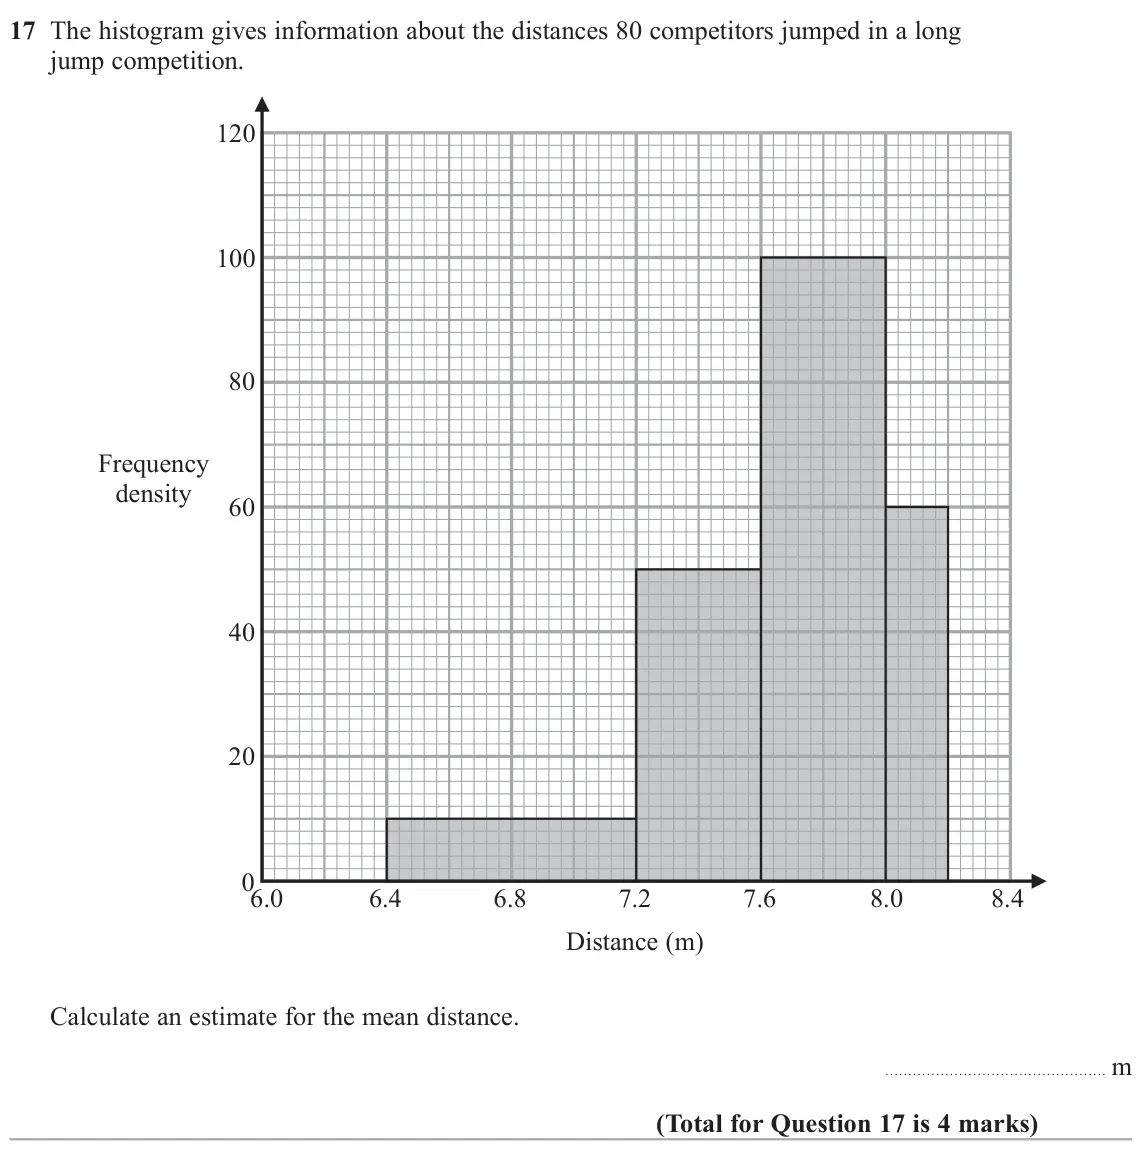
- November 2020, Paper 3H, Q17 (4 marks): The histogram gives information about the distances 80 competitors jumped in a long jump competition. 120 100 80 Frequency density 60 40 20 0 6.0 6.4 6.8 7.2 7.
- November 2019, Paper 1H, Q10 (6 marks): The cumulative frequency table shows information about the times, in minutes, taken by 40 people to complete a puzzle. Cumulative Time (m minutes) frequency 5 2
- November 2019, Paper 2H, Q18 (3 marks): The histogram gives information about the heights, in metres, of the trees in a park. The histogram is incomplete. 4 3 Frequency 2 density 1 0 0 5 10 15 20 25 H
- June 2019, Paper 2H, Q11 (6 marks): The grouped frequency table gives information about the times, in minutes, that 80 office workers take to get to work. Time (t minutes) Frequency 0 t - 20 5 20
- June 2019, Paper 3H, Q21 (4 marks): The histogram gives information about the distribution of the weights of some onions grown by a farmer. 10 9 8 7 6 Frequency 5 density 4 3 2 1 00 30 60 90 120 1
- November 2018, Paper 1H, Q9 (6 marks): The times that 48 trains left a station on Monday were recorded. The cumulative frequency graph gives information about the numbers of minutes the trains were d
- November 2018, Paper 3H, Q17 (5 marks): The table shows information about the distances 570 students travelled to a university open day. Distance (d miles) Frequency 0 d - 20 120 20 d - 50 90 50 d - 8
- June 2018, Paper 2H, Q17 (4 marks): The histogram shows information about the times taken by some students to finish a puzzle. 1 0.8 0.6 Frequency density 0.4 0.2 0 0 10 20 30 40 50 60 Time taken
- November 2017, Paper 2H, Q17 (5 marks): is 5 marks)
- November 2017, Paper 3H, Q11 (4 marks): The cumulative frequency graph shows information about the weights of 60 potatoes. 60 50 40 Cumulative frequency 30 20 10 0 30 40 50 60 70 80 Weight (g) (a) Use
- June 2017, Paper 2H, Q8 (2 marks): The cumulative frequency graph shows some information about the heights, in cm, of 60 students. 60 50 40 Cumulative frequency 30 20 10 0 120 130 140 150 160 170
- June 2017, Paper 2H, Q13 (3 marks): The histogram shows some information about the ages of the 134 members of a sports club. 3.0 2.5 2.0 Frequency density 1.5 1.0 0.5 0 0 20 40 60 80 100 Age in ye
Questions, mark schemes and examiner’s reports are © Pearson Edexcel, from their published past papers. Plumi isn’t affiliated with any exam board. Want whole papers? Every Edexcel GCSE Maths paper.
Rather write your answers by hand on iPad? Plumi marks them against the same mark schemes.