Skip to content

Charts and tables: Edexcel GCSE Maths questions

Every Edexcel GCSE Maths exam question on S2 Charts and tables, 2017–2025, with its mark scheme and examiner’s report.

Find questions997
Exam
All years
Calculator
997 questions

  1. Q1

    June 2025 · Paper 3H

    The whole paper ↗
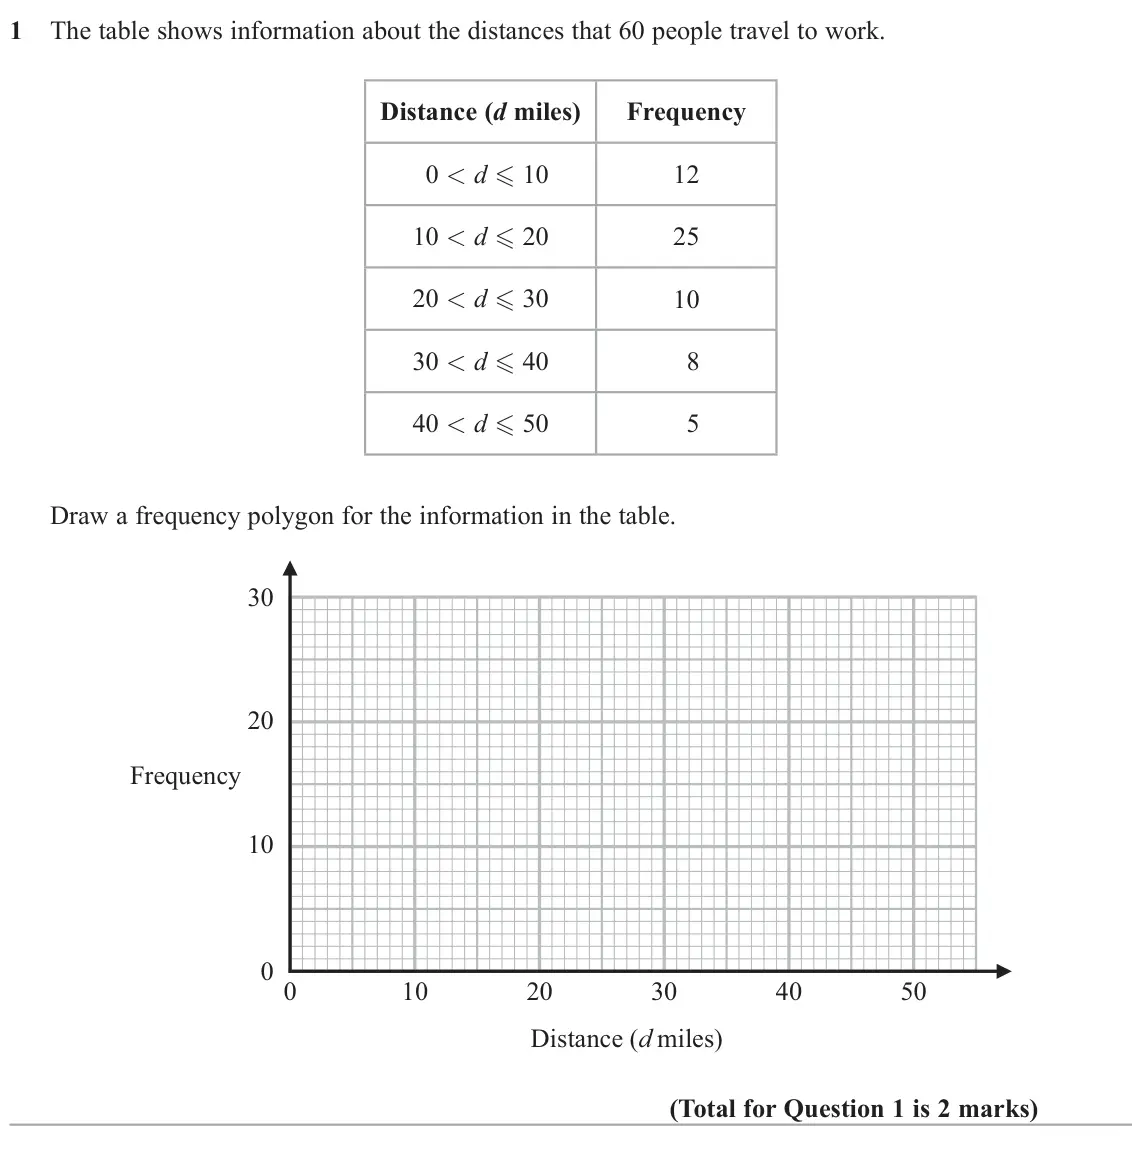
    June 2025 Paper 3H, question 1: The table shows information about the distances that 60 people travel to work. Distance (d miles) Frequency 0 < d  10 12 10 < d  20 25 20 < d  30 10 30 < d 
  2. Q1

    November 2024 · Paper 3H

    The whole paper ↗
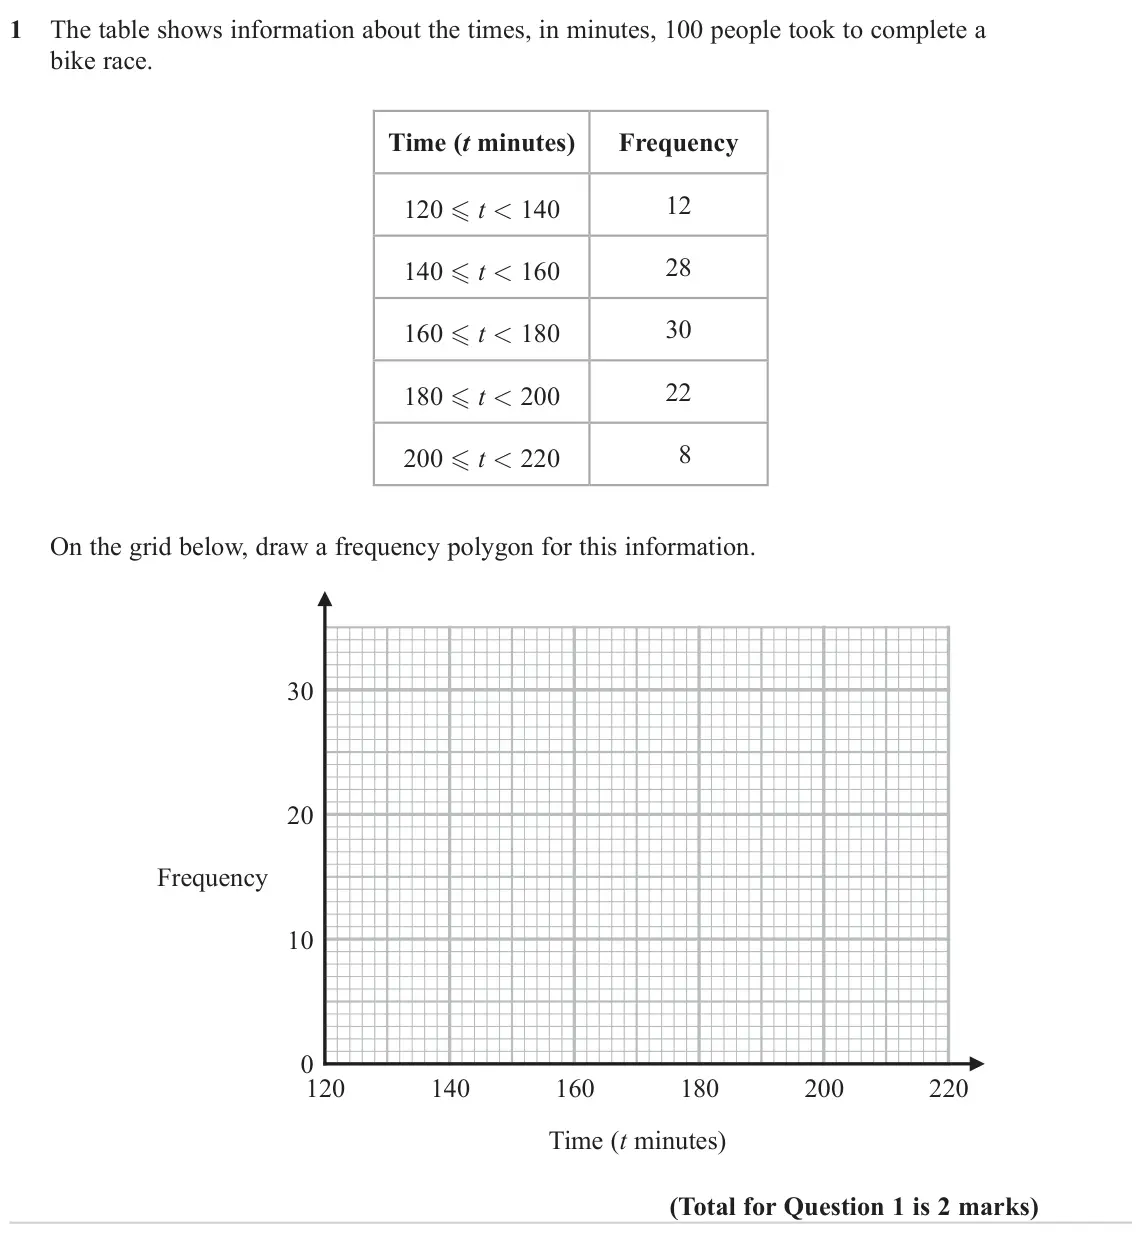
    November 2024 Paper 3H, question 1: The table shows information about the times, in minutes, 100 people took to complete a bike race. Time (t minutes) Frequency 12 120  t < 140 28 140  t < 160 3
  3. Q6

    November 2024 · Paper 3H

    The whole paper ↗
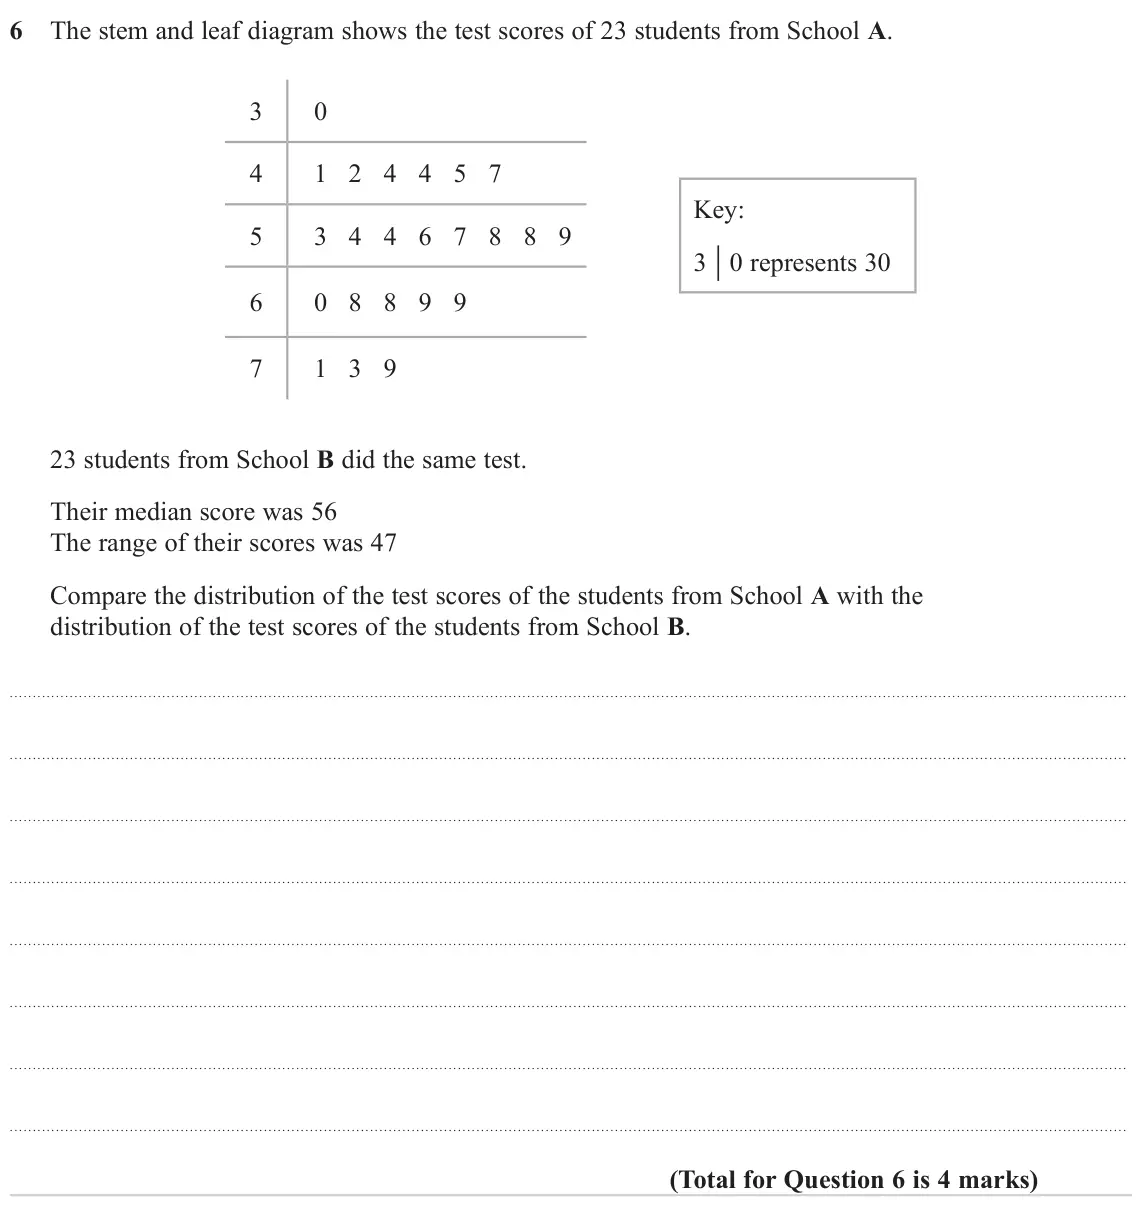
    November 2024 Paper 3H, question 6: The stem and leaf diagram shows the test scores of 23 students from School A. 3 0 4 1 2 4 4 5 7 Key: 5 3 4 4 6 7 8 8 9 3 0 represents 30 6 0 8 8 9 9 7 1 3 9 23
  4. Q5

    June 2022 · Paper 3H

    The whole paper ↗
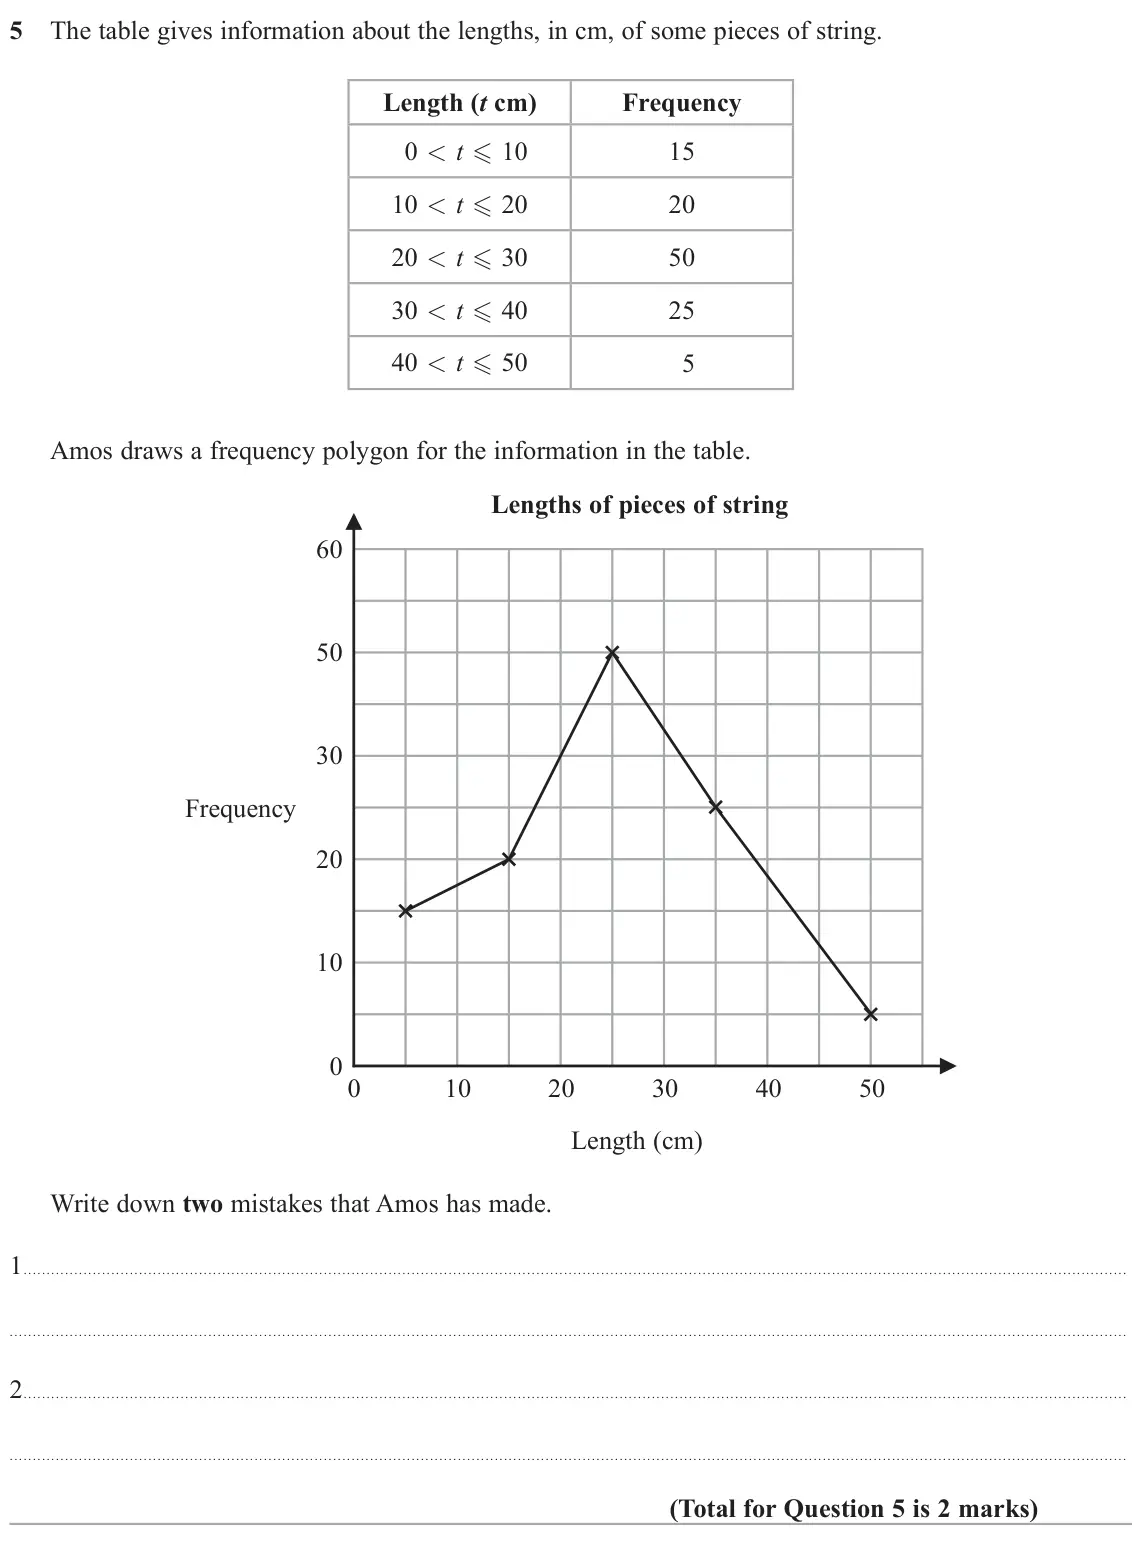
    June 2022 Paper 3H, question 5: The table gives information about the lengths, in cm, of some pieces of string. Length (t cm) Frequency 0 < t  10 15 10 < t  20 20 20 < t  30 50 30 < t  40
  5. Q1

    November 2019 · Paper 2H

    The whole paper ↗
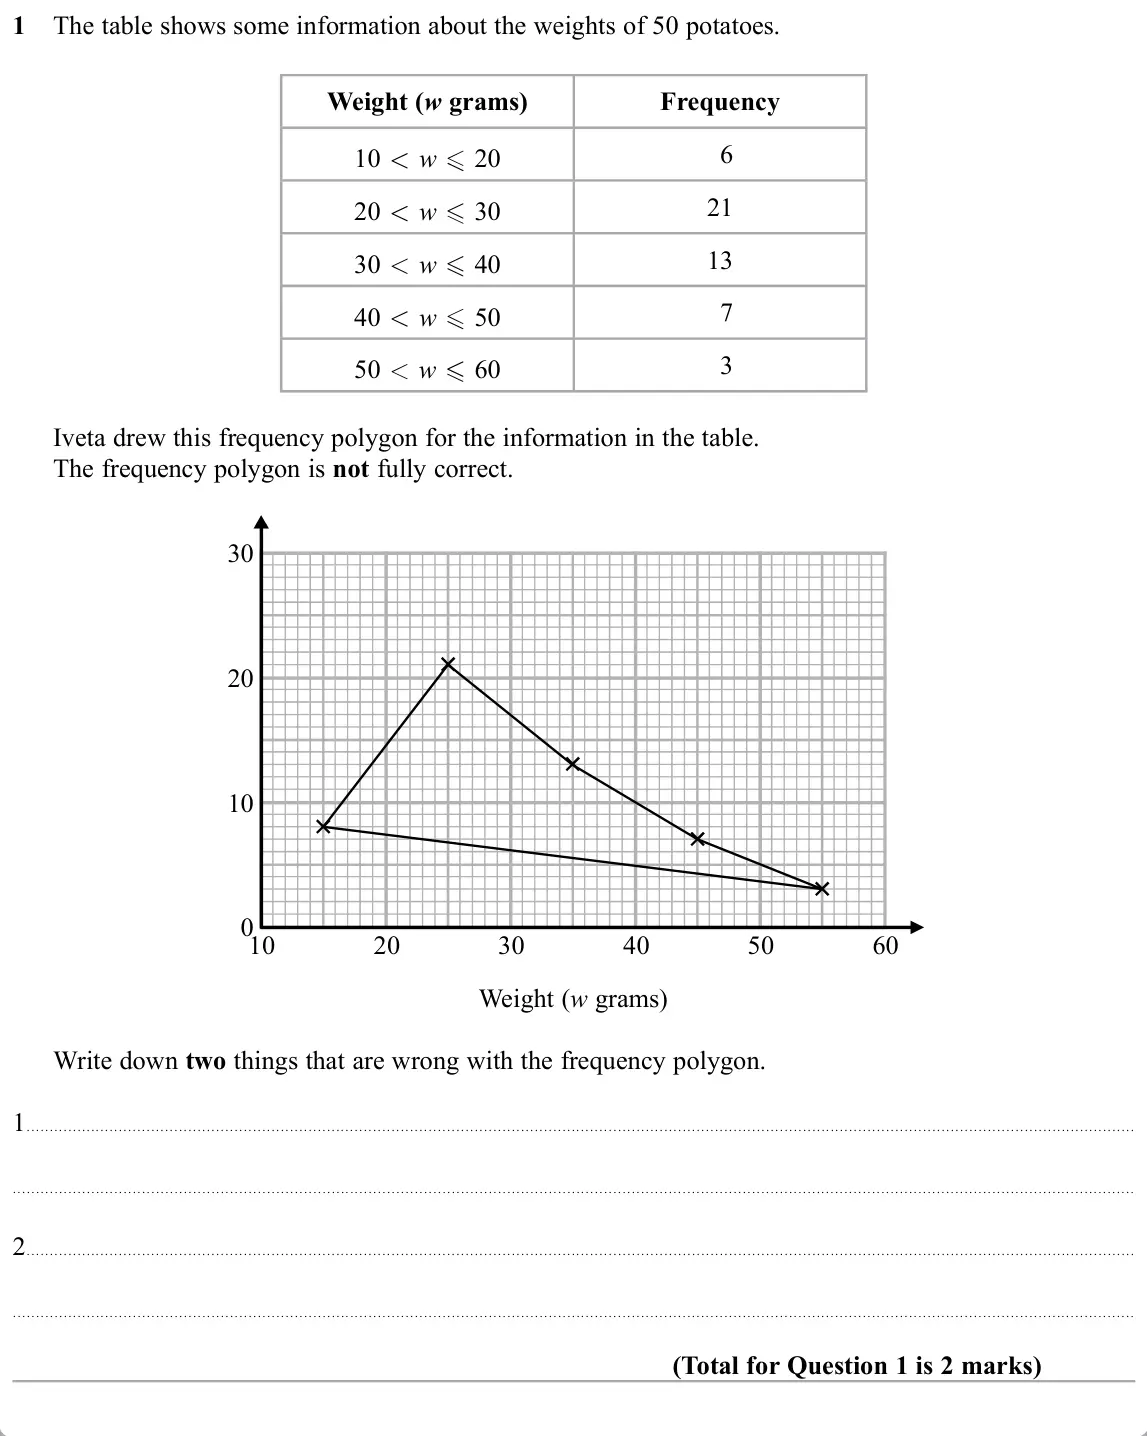
    November 2019 Paper 2H, question 1: The table shows some information about the weights of 50 potatoes. Weight (w grams) Frequency 6 10 w 20 21 20 w 30 13 30 w 40 7 40 w 50 3 50 w 60 Iveta drew thi
  6. Q3

    June 2019 · Paper 3H

    The whole paper ↗
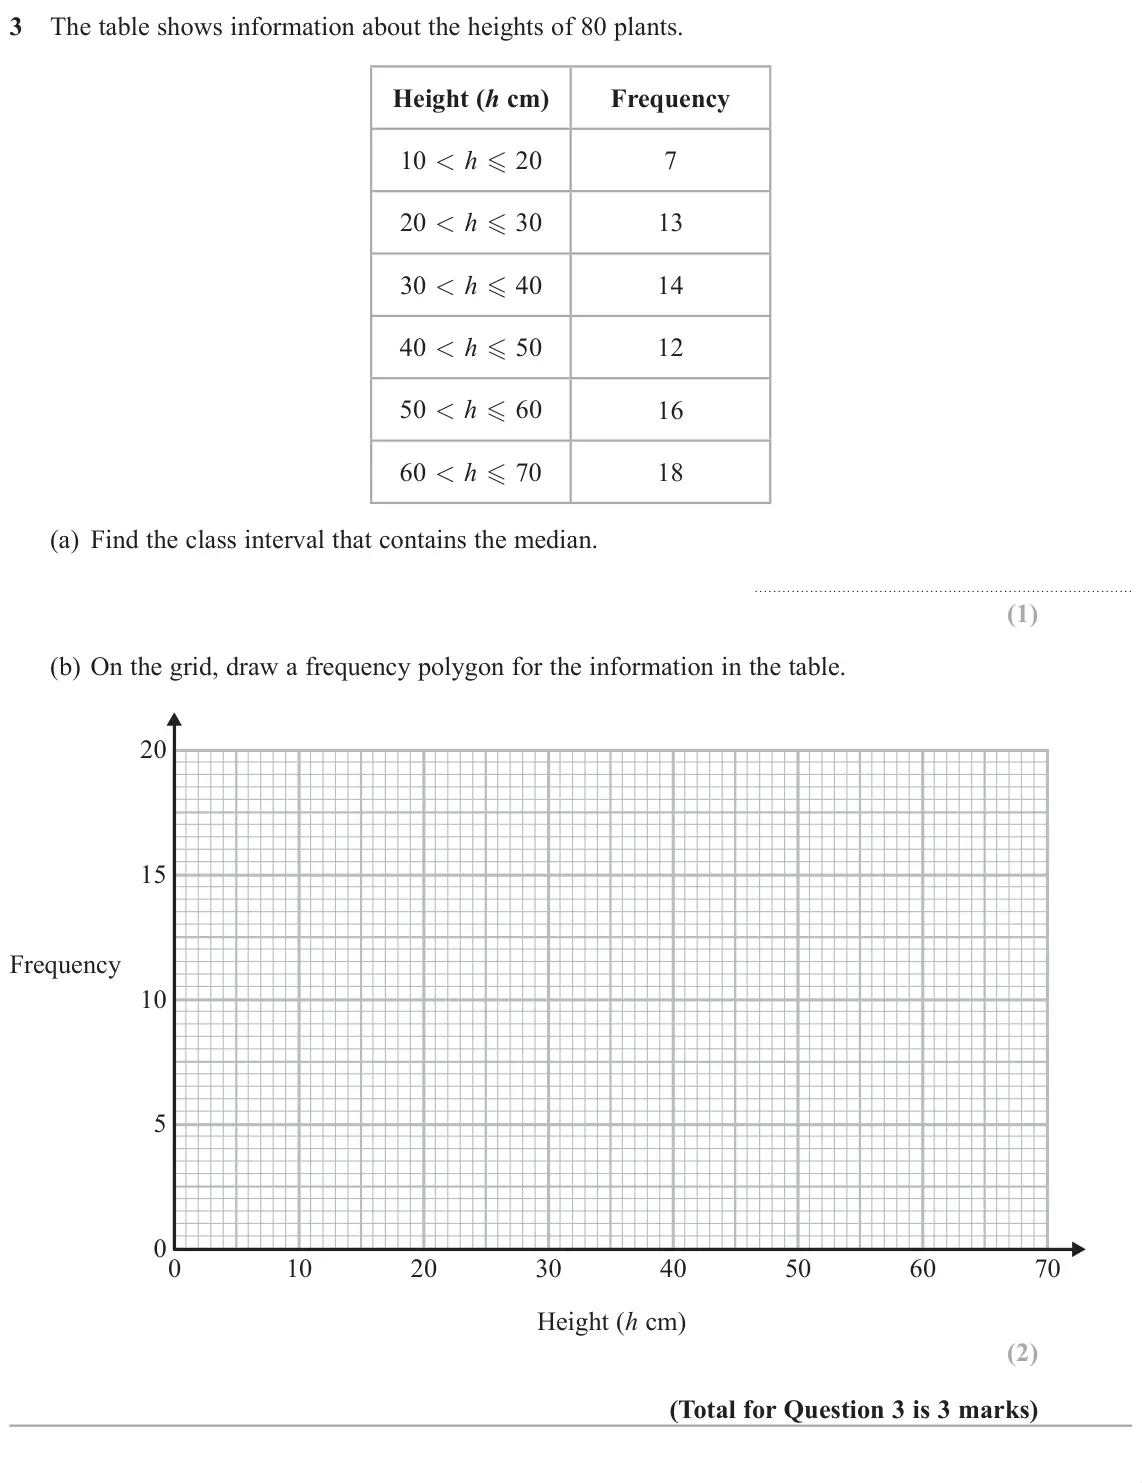
    June 2019 Paper 3H, question 3: The table shows information about the heights of 80 plants. Height (h cm) Frequency 10 h - 20 7 20 h - 30 13 30 h - 40 14 40 h - 50 12 50 h - 60 16 60 h - 70 18
  7. Q4

    June 2019 · Paper 3H

    The whole paper ↗
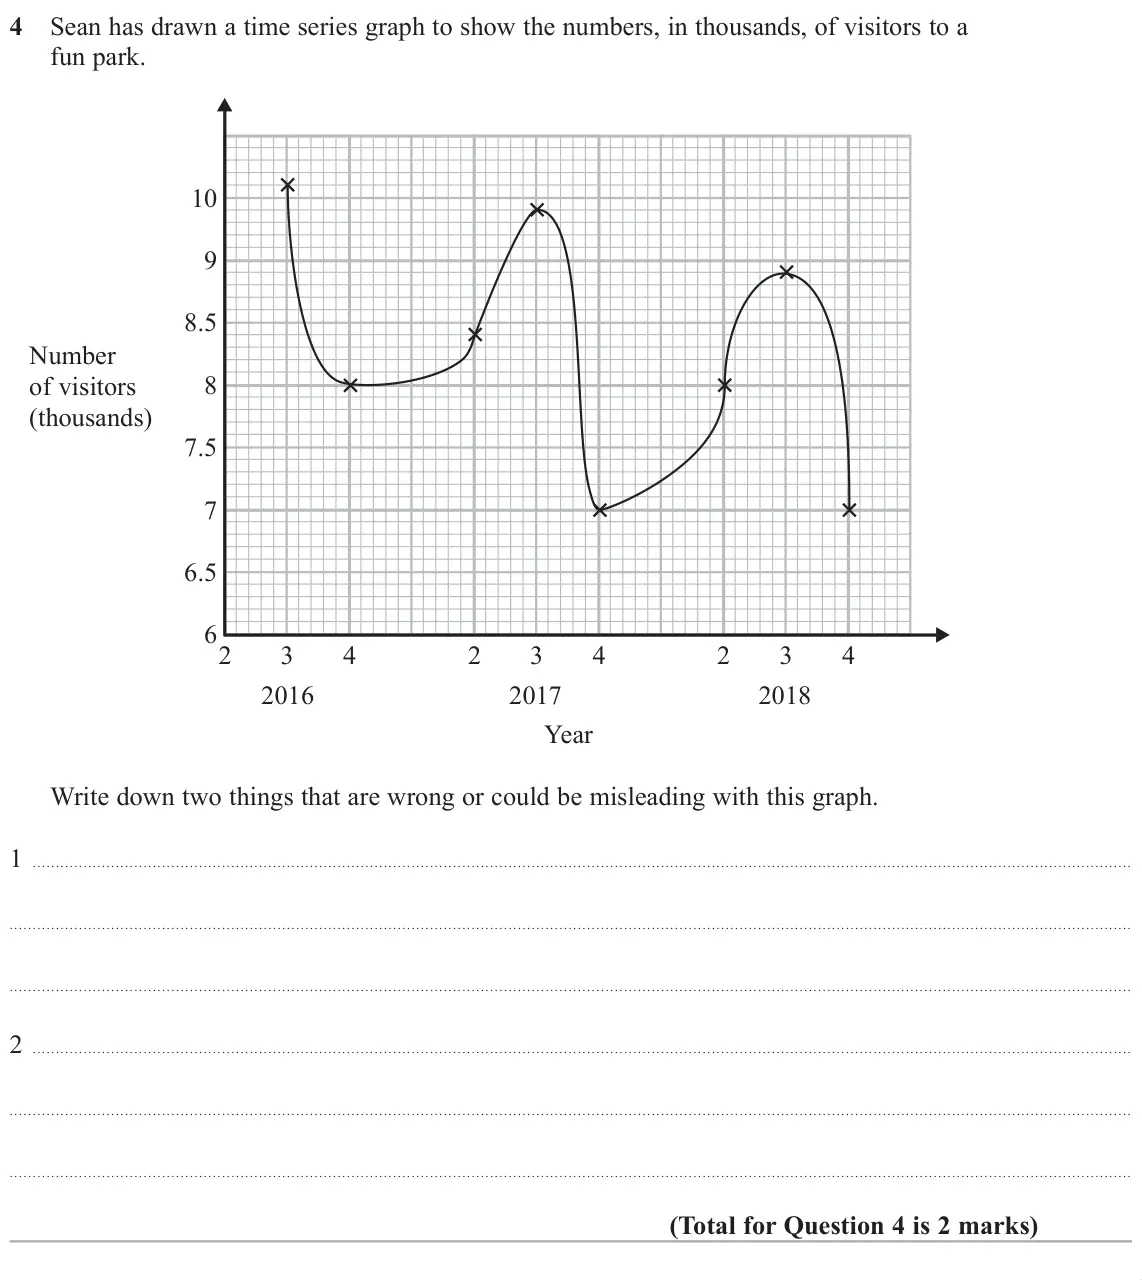
    June 2019 Paper 3H, question 4: Sean has drawn a time series graph to show the numbers, in thousands, of visitors to a fun park. 10 9 8.5 Number 8 of visitors (thousands) 7.5 7 6.5 62 3 4 2 3
  8. Q21

    June 2019 · Paper 3H

    The whole paper ↗
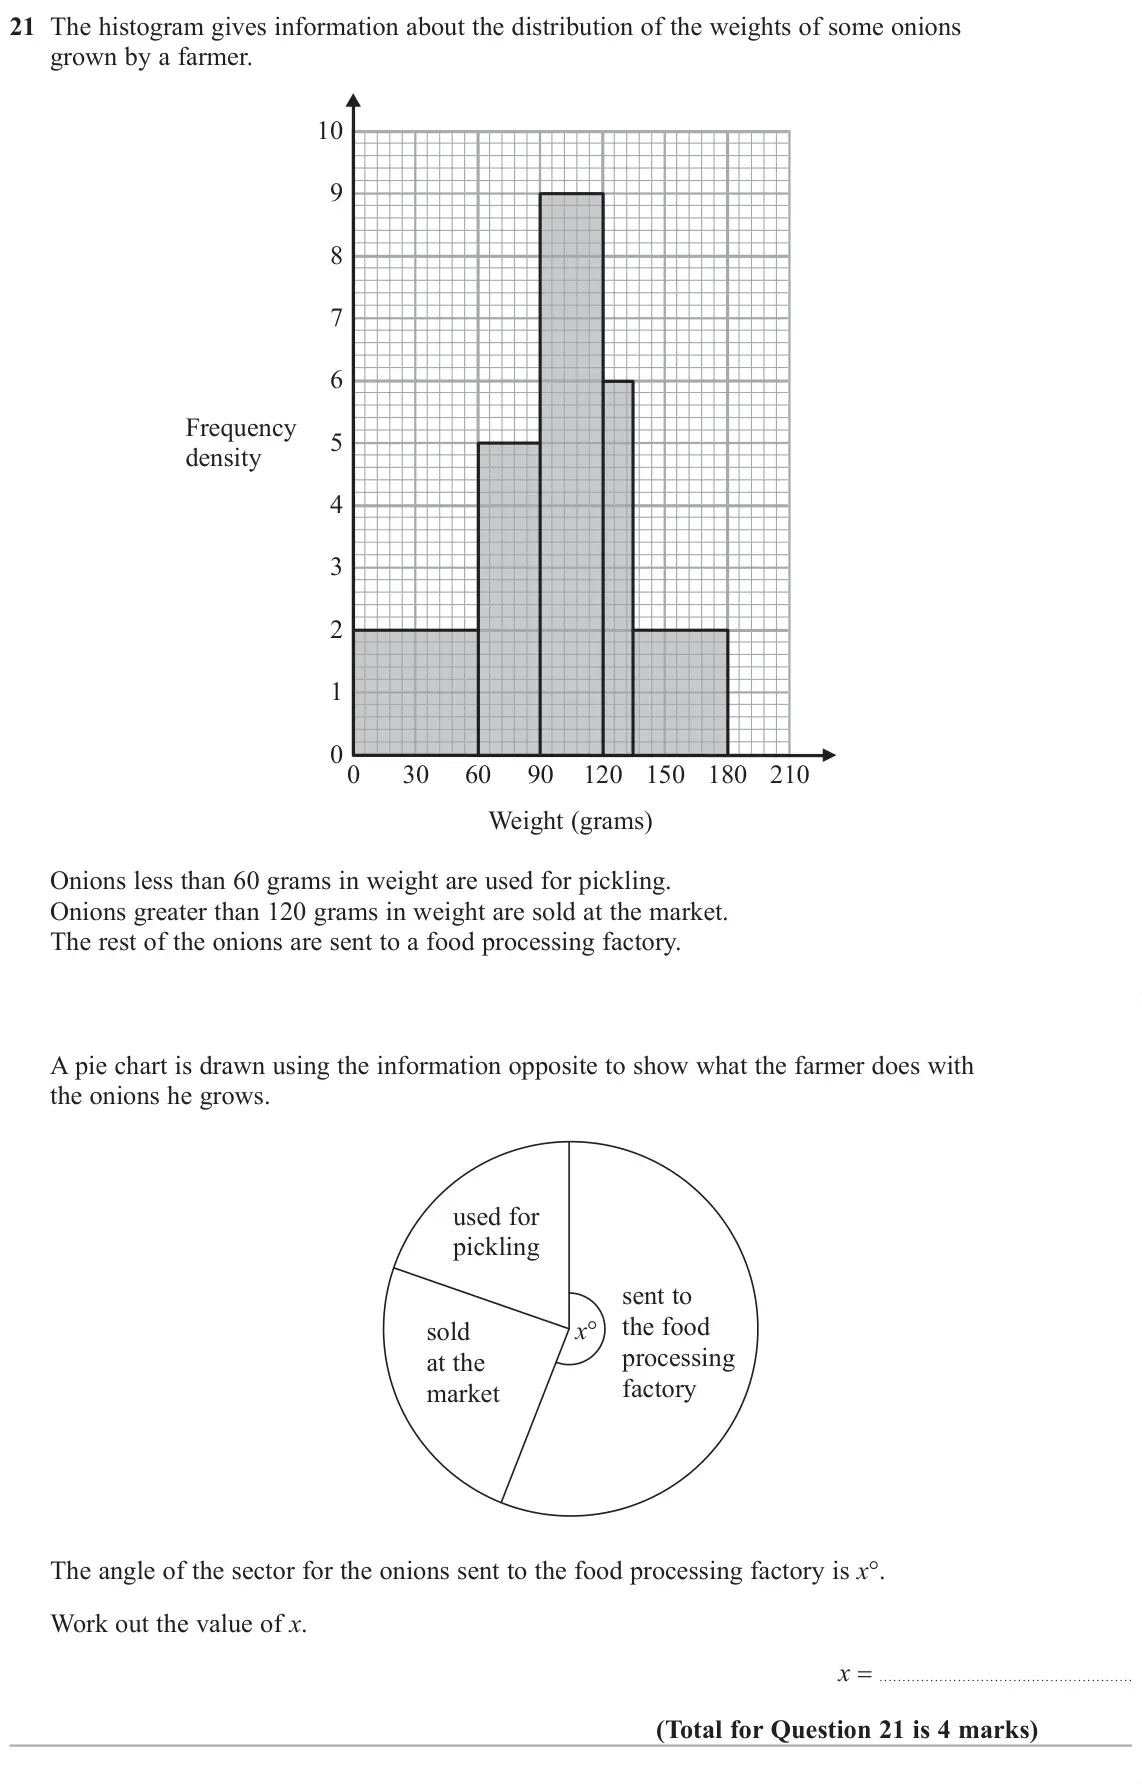
    June 2019 Paper 3H, question 21: The histogram gives information about the distribution of the weights of some onions grown by a farmer. 10 9 8 7 6 Frequency 5 density 4 3 2 1 00 30 60 90 120 1
  9. Q4

    November 2018 · Paper 3H

    The whole paper ↗
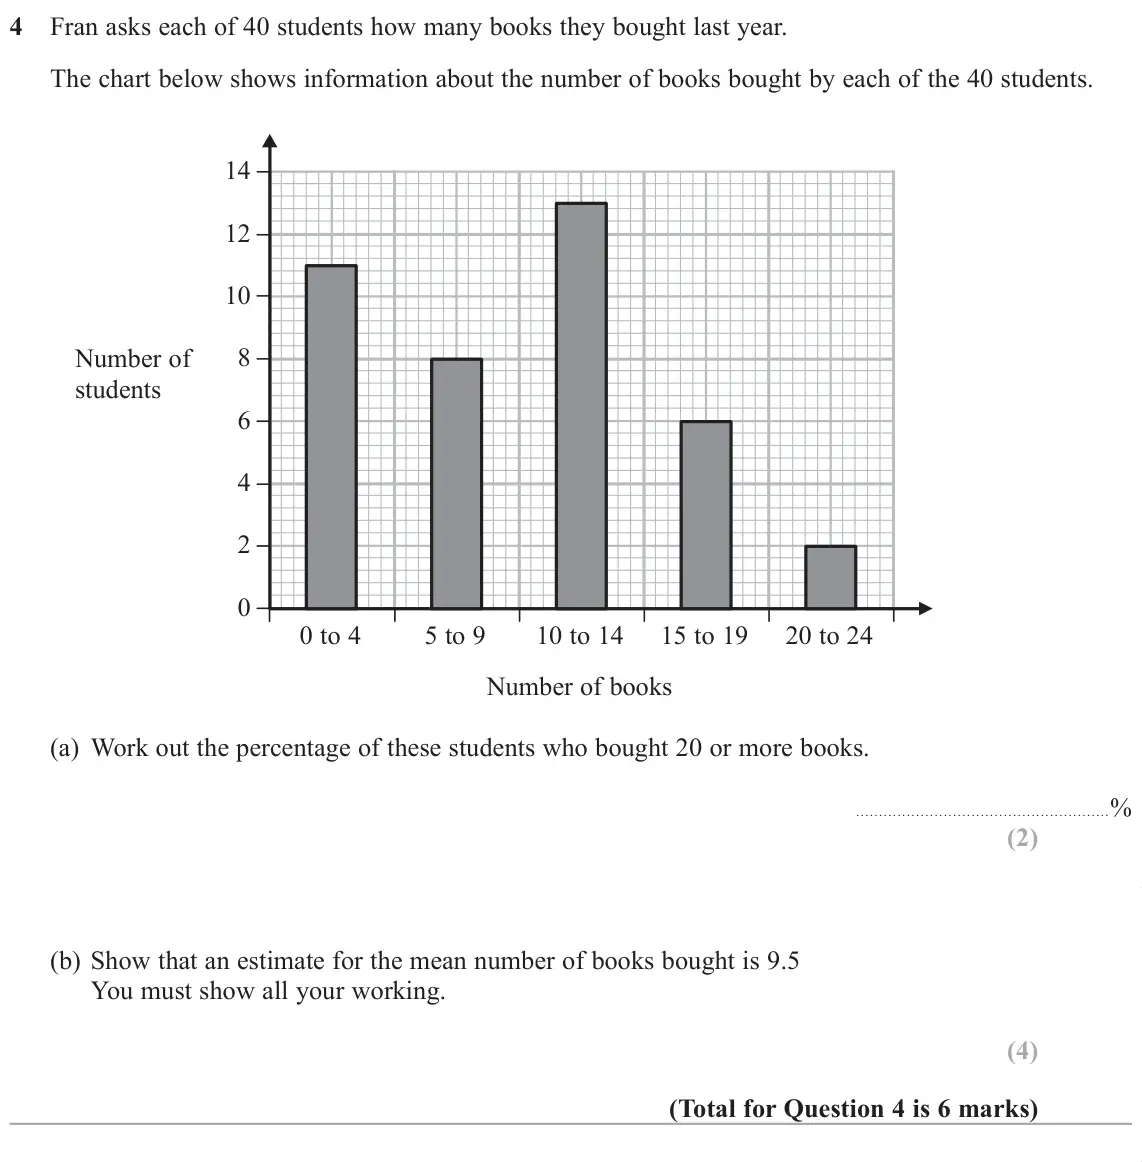
    November 2018 Paper 3H, question 4: Fran asks each of 40 students how many books they bought last year. The chart below shows information about the number of books bought by each of the 40 student
  10. Q7

    November 2018 · Paper 3H

    The whole paper ↗
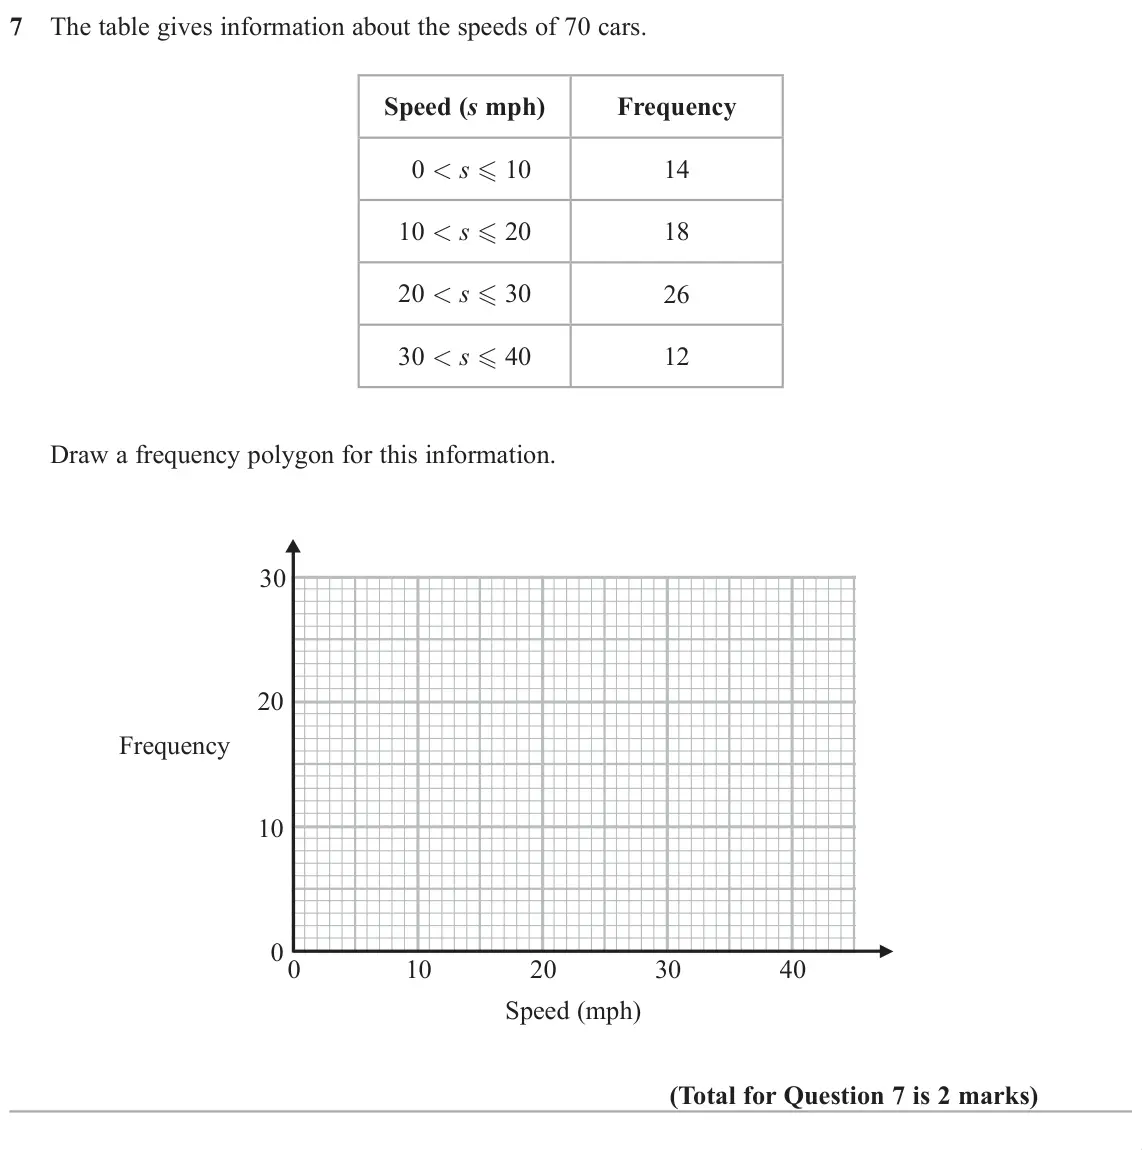
    November 2018 Paper 3H, question 7: The table gives information about the speeds of 70 cars. Speed (s mph) Frequency 0 s - 10 14 10 s - 20 18 20 s - 30 26 30 s - 40 12 Draw a frequency polygon for
  11. Q11

    November 2017 · Paper 2H

    The whole paper ↗
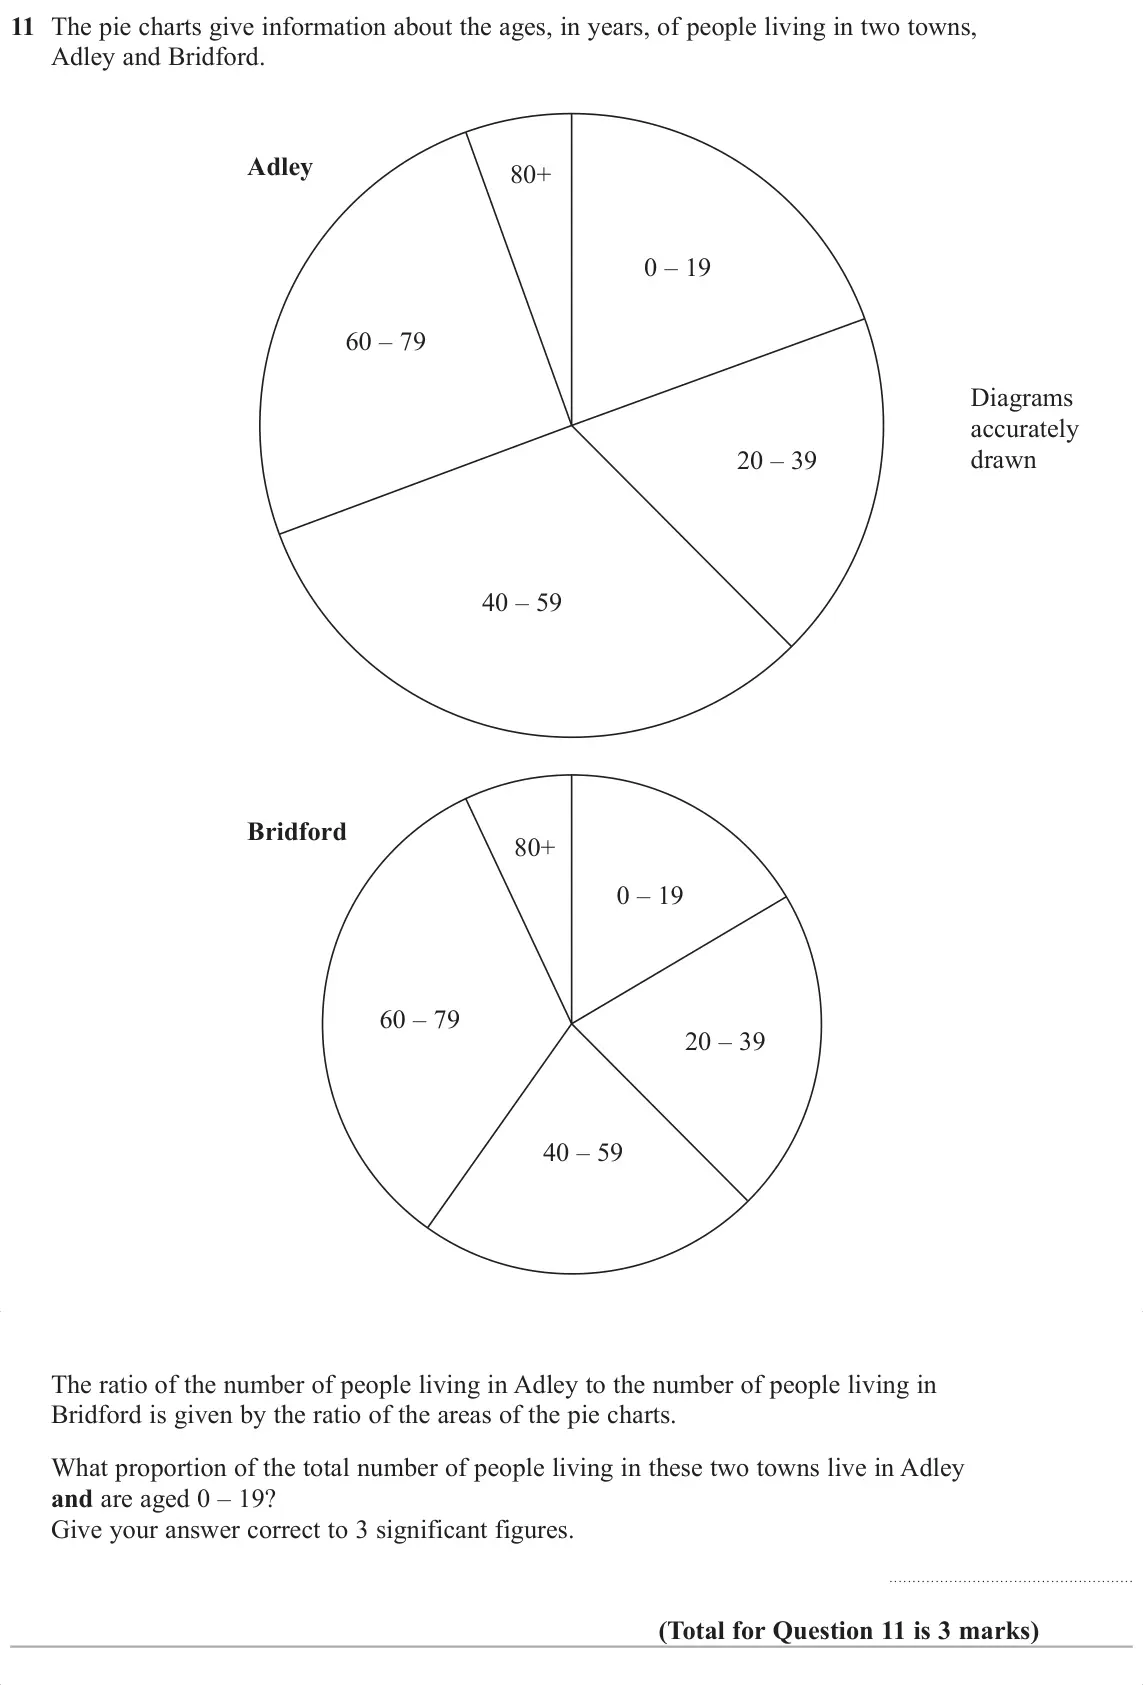
    November 2017 Paper 2H, question 11: is 3 marks)
  12. Q1

    November 2017 · Paper 3H

    The whole paper ↗
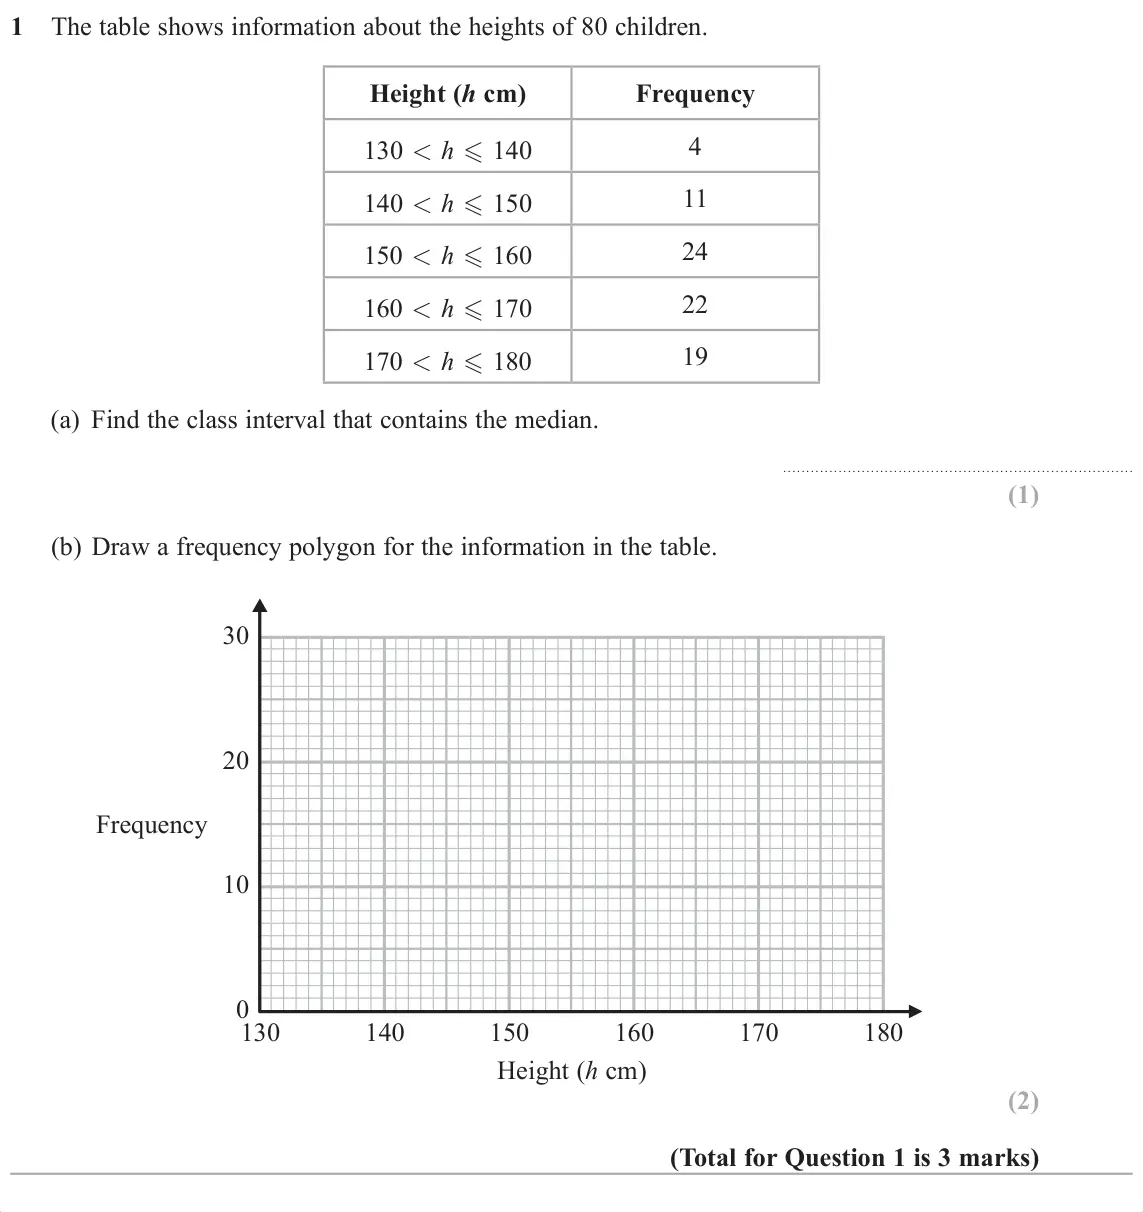
    November 2017 Paper 3H, question 1: The table shows information about the heights of 80 children. Height (h cm) Frequency 130 h - 140 4 11 140 h - 150 24 150 h - 160 22 160 h - 170 19 170 h - 180
All 12 questions on Charts and tables, as a list
  1. June 2025, Paper 3H, Q1 (2 marks): The table shows information about the distances that 60 people travel to work. Distance (d miles) Frequency 0 < d  10 12 10 < d  20 25 20 < d  30 10 30 < d 
  2. November 2024, Paper 3H, Q1 (2 marks): The table shows information about the times, in minutes, 100 people took to complete a bike race. Time (t minutes) Frequency 12 120  t < 140 28 140  t < 160 3
  3. November 2024, Paper 3H, Q6 (4 marks): The stem and leaf diagram shows the test scores of 23 students from School A. 3 0 4 1 2 4 4 5 7 Key: 5 3 4 4 6 7 8 8 9 3 0 represents 30 6 0 8 8 9 9 7 1 3 9 23
  4. June 2022, Paper 3H, Q5 (2 marks): The table gives information about the lengths, in cm, of some pieces of string. Length (t cm) Frequency 0 < t  10 15 10 < t  20 20 20 < t  30 50 30 < t  40
  5. November 2019, Paper 2H, Q1 (2 marks): The table shows some information about the weights of 50 potatoes. Weight (w grams) Frequency 6 10 w 20 21 20 w 30 13 30 w 40 7 40 w 50 3 50 w 60 Iveta drew thi
  6. June 2019, Paper 3H, Q3 (3 marks): The table shows information about the heights of 80 plants. Height (h cm) Frequency 10 h - 20 7 20 h - 30 13 30 h - 40 14 40 h - 50 12 50 h - 60 16 60 h - 70 18
  7. June 2019, Paper 3H, Q4 (2 marks): Sean has drawn a time series graph to show the numbers, in thousands, of visitors to a fun park. 10 9 8.5 Number 8 of visitors (thousands) 7.5 7 6.5 62 3 4 2 3
  8. June 2019, Paper 3H, Q21 (4 marks): The histogram gives information about the distribution of the weights of some onions grown by a farmer. 10 9 8 7 6 Frequency 5 density 4 3 2 1 00 30 60 90 120 1
  9. November 2018, Paper 3H, Q4 (6 marks): Fran asks each of 40 students how many books they bought last year. The chart below shows information about the number of books bought by each of the 40 student
  10. November 2018, Paper 3H, Q7 (2 marks): The table gives information about the speeds of 70 cars. Speed (s mph) Frequency 0 s - 10 14 10 s - 20 18 20 s - 30 26 30 s - 40 12 Draw a frequency polygon for
  11. November 2017, Paper 2H, Q11 (3 marks): is 3 marks)
  12. November 2017, Paper 3H, Q1 (3 marks): The table shows information about the heights of 80 children. Height (h cm) Frequency 130 h - 140 4 11 140 h - 150 24 150 h - 160 22 160 h - 170 19 170 h - 180

Questions, mark schemes and examiner’s reports are © Pearson Edexcel, from their published past papers. Plumi isn’t affiliated with any exam board. Want whole papers? Every Edexcel GCSE Maths paper.

Rather write your answers by hand on iPad? Plumi marks them against the same mark schemes.