 plumi
There are differences between the water consumption patterns of developing countries and developed countries: Edexcel GCSE Geography A questions
Edexcel GCSE Geography A past-paper questions on 6.9 There are differences between the water consumption patterns of developing countries and developed countries, 2018–2025, with mark schemes and examiner’s reports where available.
Paper
All papers
Exam
All years
Calculations
Loading the full question list…
Q5(a)(i)
The whole paper ↗ (Total for Question 5 is 2 marks)
Q5(a)(ii)
The whole paper ↗(Total for Question 5 is 1 mark)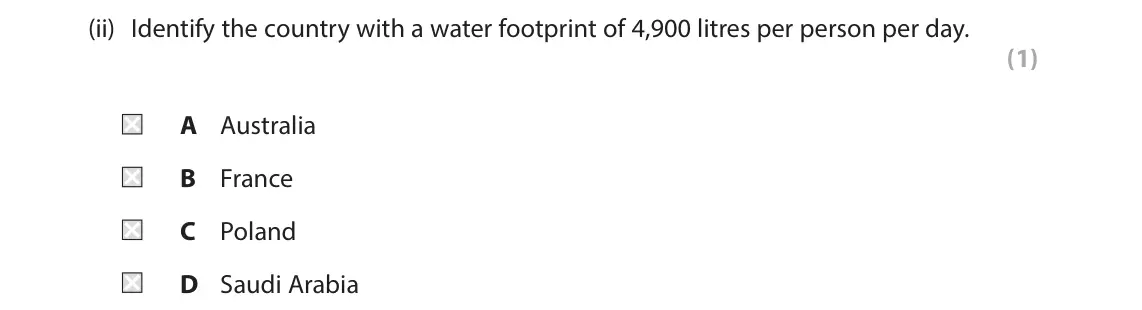
Q5(a)(iii)
The whole paper ↗(Total for Question 5 is 1 mark)
Q5(a)(iv)
The whole paper ↗(Total for Question 5 is 2 marks)
Q5(d)(i)
The whole paper ↗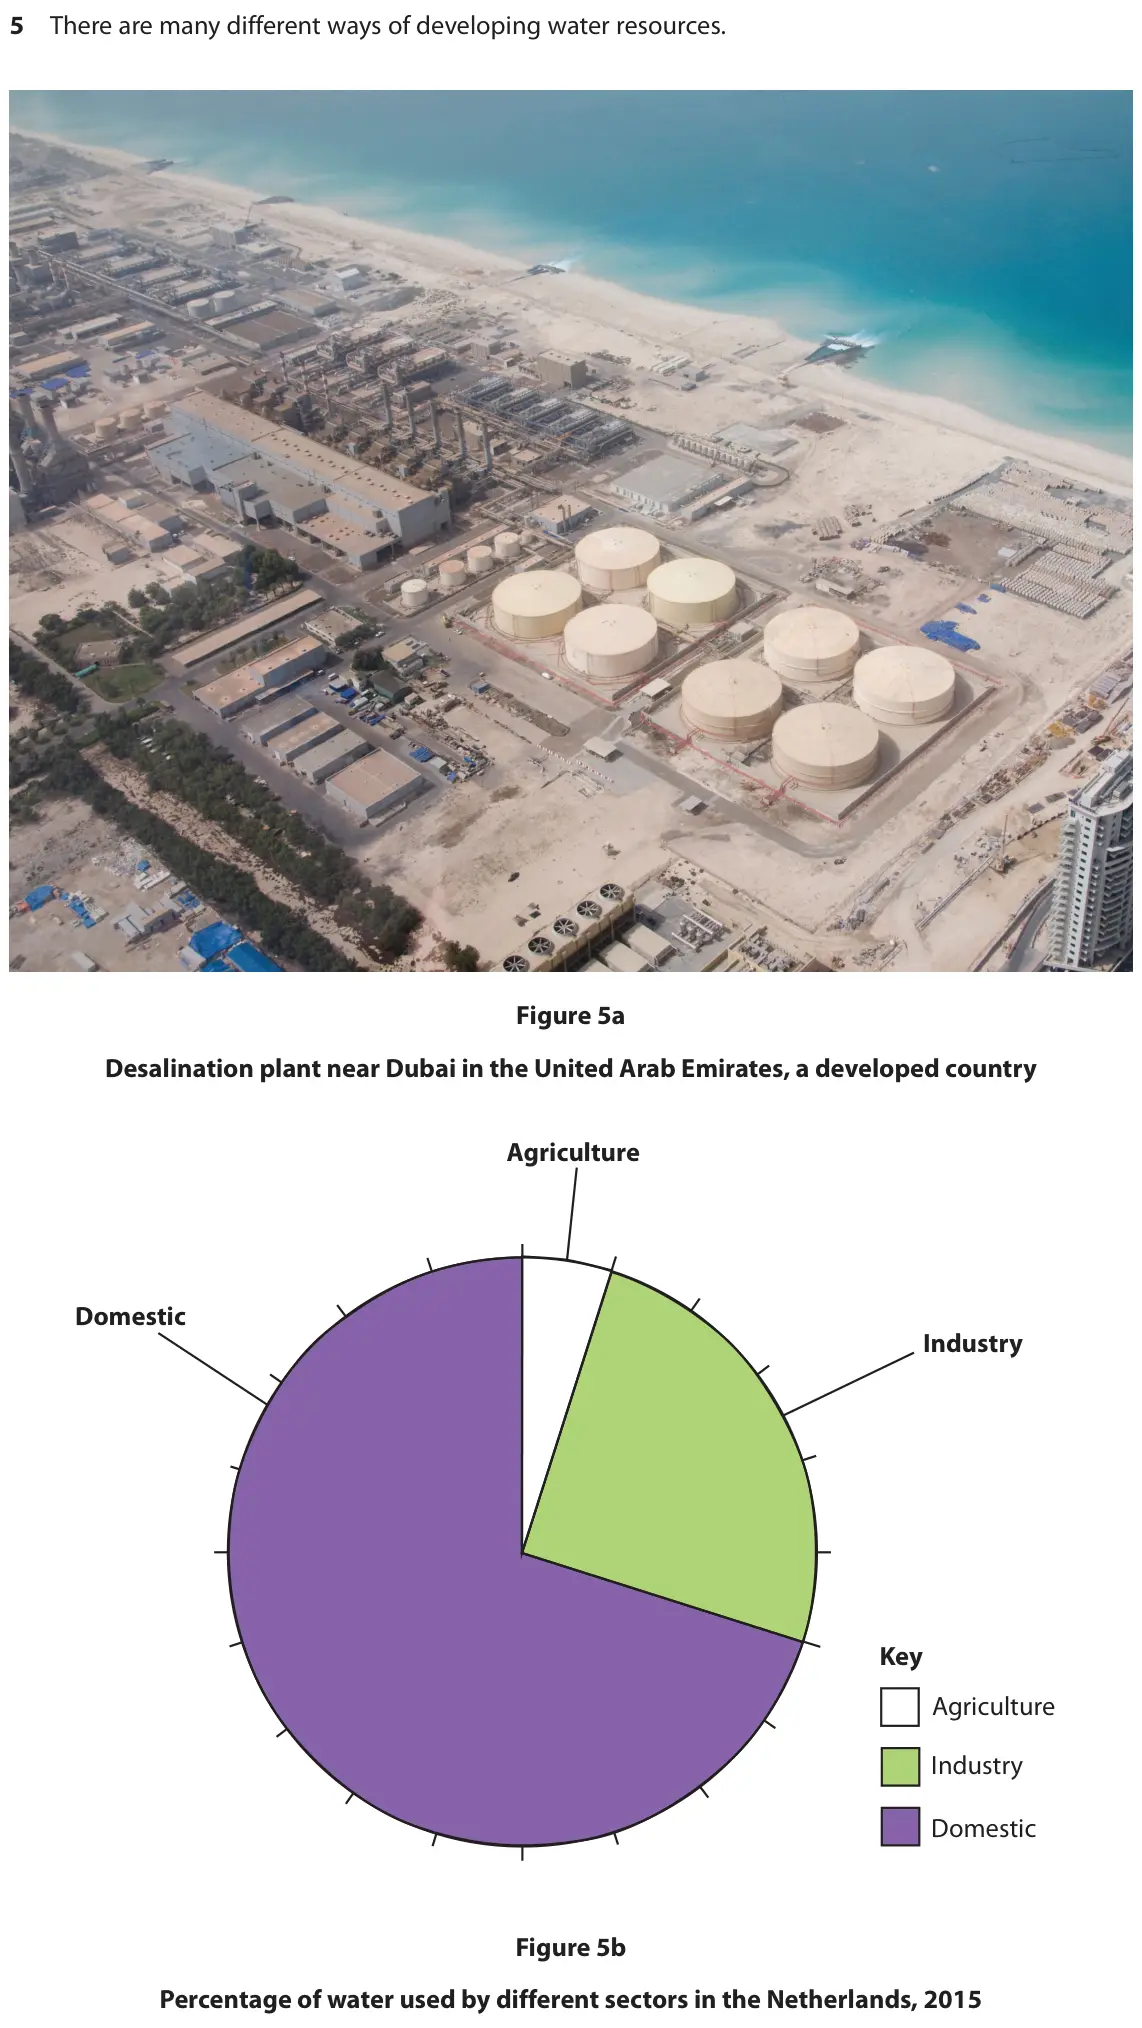 (Total for Question 5 is 1 mark)
Q5(d)(ii)
The whole paper ↗(Total for Question 5 is 2 marks)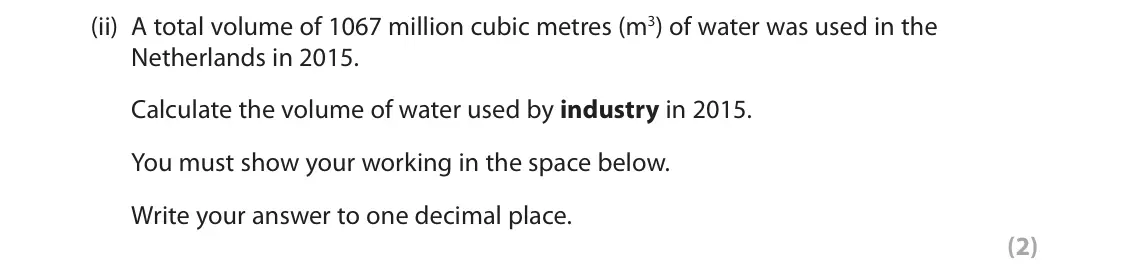
Q5(d)(iii)
The whole paper ↗(Total for Question 5 is 2 marks)
Q5(c)
The whole paper ↗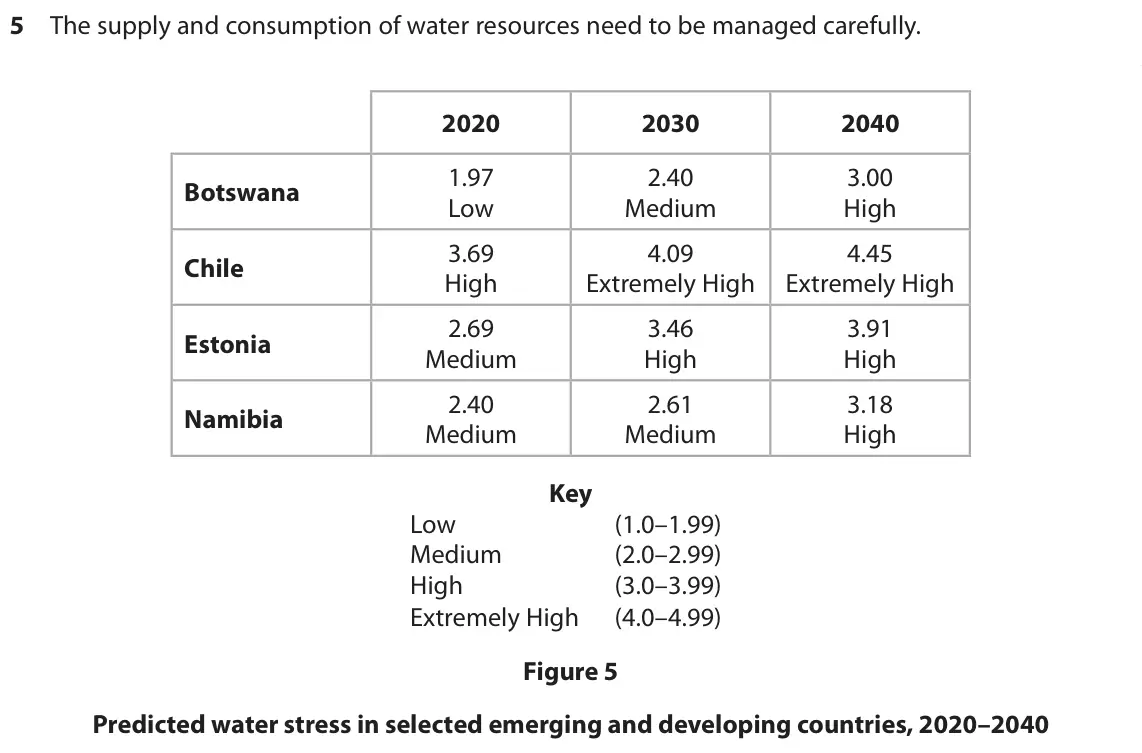 (Total for Question 5 is 1 mark)

Q5(c)
The whole paper ↗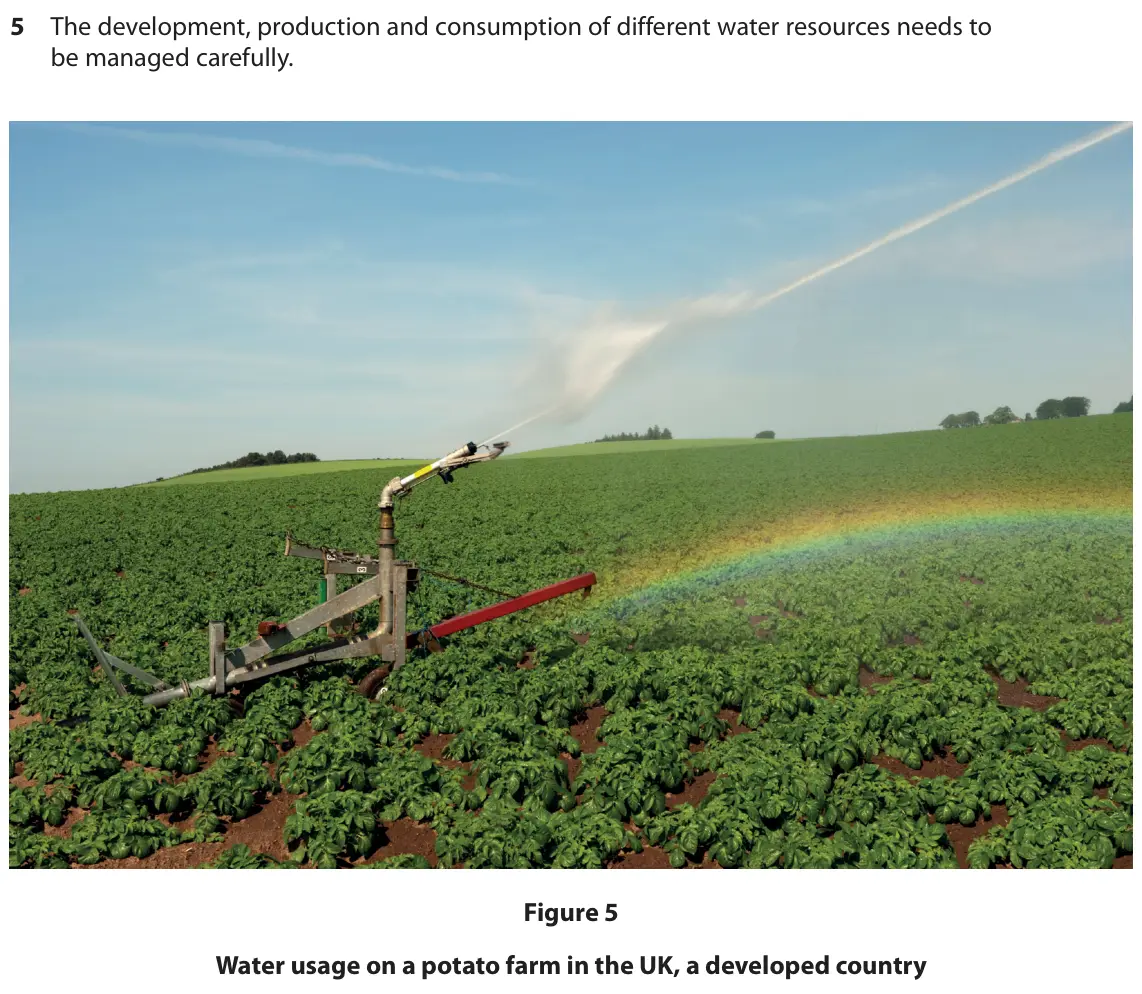 (Total for Question 5 is 3 marks)

Q5(d)(i)
The whole paper ↗(Total for Question 5 is 1 mark)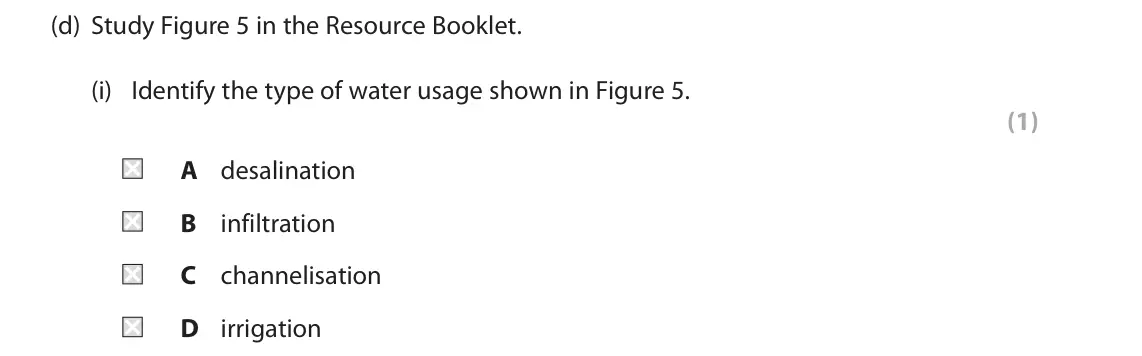
Q5(d)(ii)
The whole paper ↗(Total for Question 5 is 2 marks)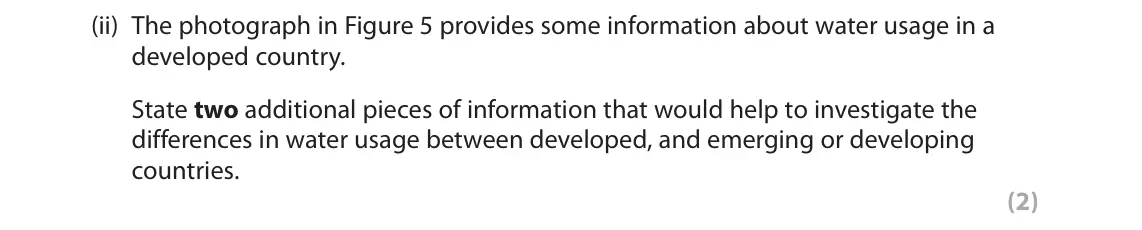
Q5(d)(iii)
The whole paper ↗(Total for Question 5 is 4 marks)
Q5(f)
The whole paper ↗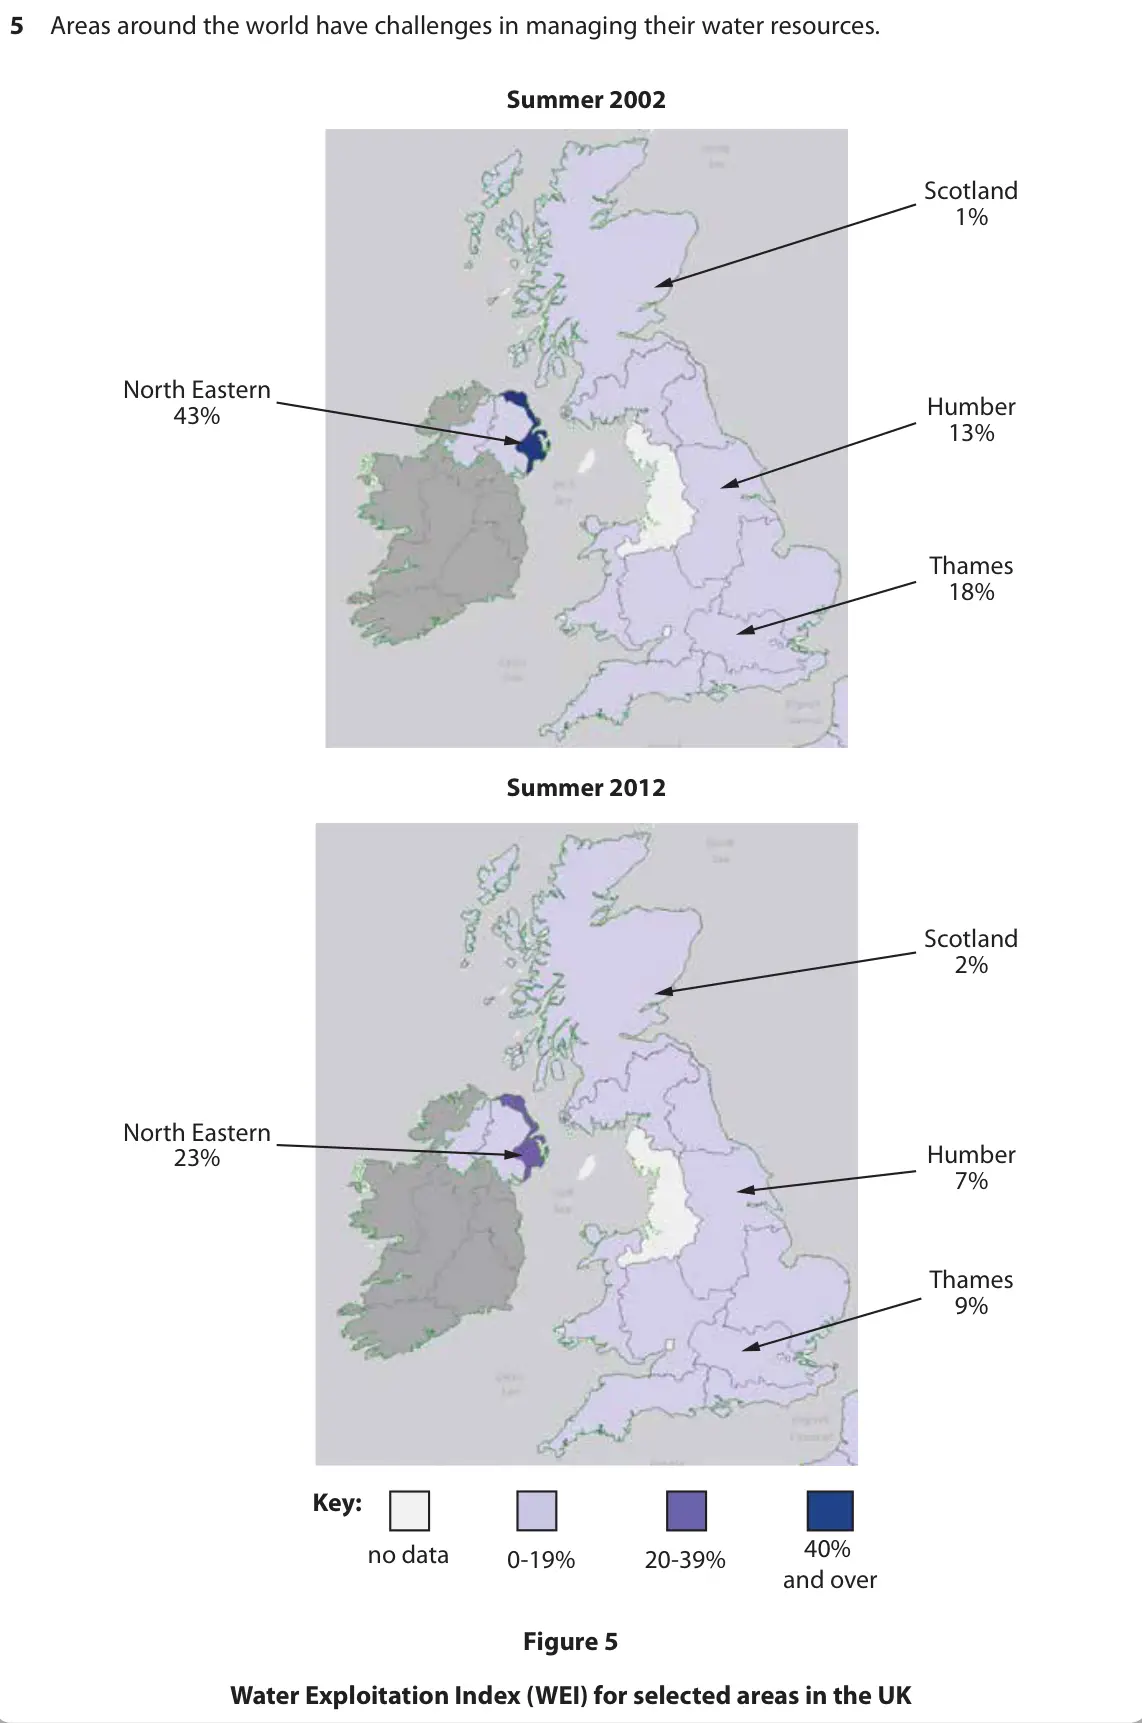 (Total for Question 5 is 8 marks)

All 13 questions on There are differences between the water consumption patterns of developing countries and developed countries, as a list
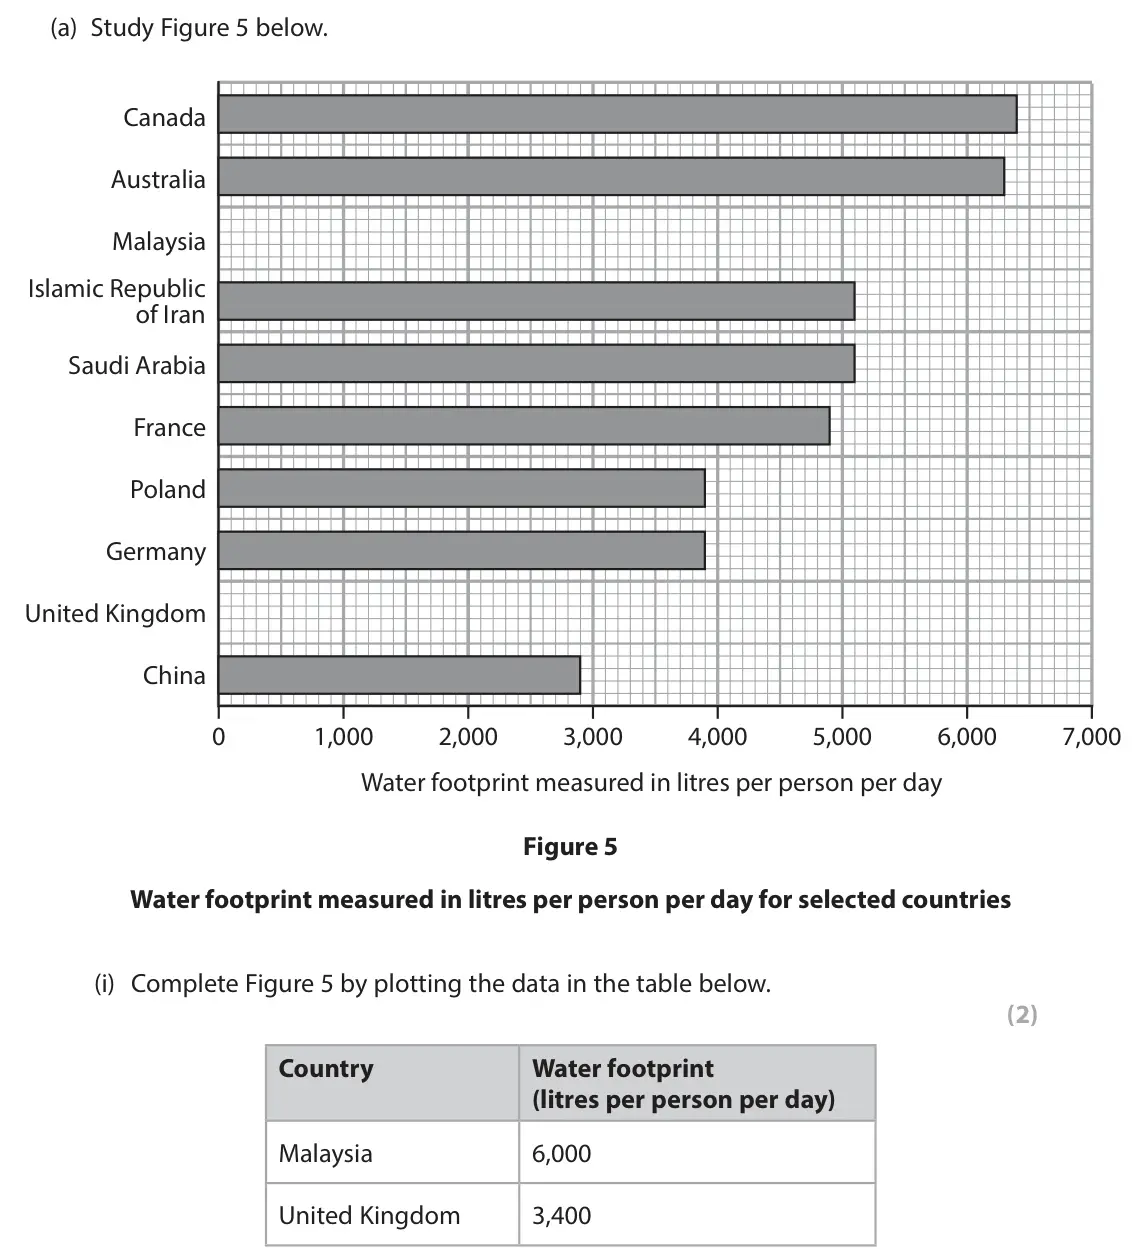
- June 2024, Paper 2, Q5(a)(i) (2 marks): Complete Figure 5 by plotting the data in the table below. (2) Country Water footprint (litres per person per day) Malaysia 6,000 United Kingdom 3,400 5 The wat
- June 2024, Paper 2, Q5(a)(ii) (1 mark): Identify the country with a water footprint of 4,900 litres per person per day. (1) A Australia B France C Poland D Saudi Arabia 5 The water footprint measures
- June 2024, Paper 2, Q5(a)(iii) (1 mark): Calculate the range in the water footprint shown on Figure 5. (1) 5 The water footprint measures the amount of water used to produce the goods and services we u
- June 2024, Paper 2, Q5(a)(iv) (2 marks): Suggest one reason for the differences in water footprint shown on Figure 5. (2) 5 The water footprint measures the amount of water used to produce the goods an
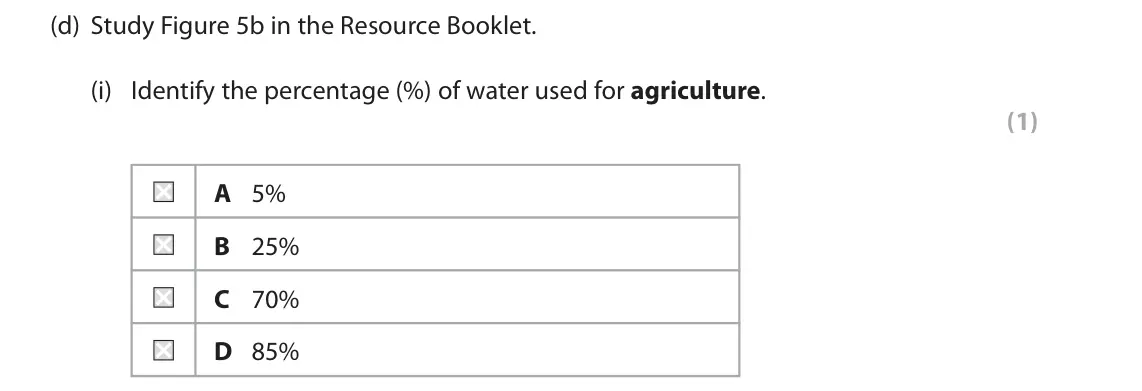
- November 2021, Paper 2, Q5(d)(i) (1 mark): Identify the percentage (%) of water used for agriculture. (1) A 5% B 25% C 70% D 85% 5 There are many different ways of developing water resources. Figure 5a D
- November 2021, Paper 2, Q5(d)(ii) (2 marks): A total volume of 1067 million cubic metres (m3) of water was used in the Netherlands in 2015. Calculate the volume of water used by industry in 2015. You must
- November 2021, Paper 2, Q5(d)(iii) (2 marks): Suggest one reason why water consumption for domestic purposes has the largest percentage (%) in Figure 5b. (2) 5 There are many different ways of developing wa
- November 2020, Paper 2, Q5(c) (1 mark): State one reason why some countries use a high proportion of their water resources for agriculture. (1) 5 The supply and consumption of water resources need to
- June 2019, Paper 2, Q5(c) (3 marks): Explain one reason why there is a difference in domestic water usage between different countries. (3) 5 The development, production and consumption of different
- June 2019, Paper 2, Q5(d)(i) (1 mark): Identify the type of water usage shown in Figure 5. (1) A desalination B infiltration C channelisation D irrigation 5 The development, production and consumptio
- June 2019, Paper 2, Q5(d)(ii) (2 marks): The photograph in Figure 5 provides some information about water usage in a developed country. State two additional pieces of information that would help to inv
- June 2019, Paper 2, Q5(d)(iii) (4 marks): Suggest one reason why this type of water usage is common in the area shown in Figure 5. (4) 5 The development, production and consumption of different water re
- June 2018, Paper 2, Q5(f) (8 marks): Assess the reasons why there are differences in water consumption between a developed country and either an emerging or a developing country. (8) 5 Areas around
Questions, mark schemes and examiner’s reports are © Pearson Edexcel, from their published past papers. Plumi isn’t affiliated with any exam board. Want whole papers? Edexcel GCSE Geography A past papers.
The Plumi iPad app also offers exam-style questions with AI feedback on your handwritten working.