Skip to content
Android waitlistTry on iPad
Get started

The supply of fresh water supply varies globally: Edexcel GCSE Geography A questions

Edexcel GCSE Geography A past-paper questions on 6.8 The supply of fresh water supply varies globally, 2018–2025, with mark schemes and examiner’s reports where available.

Paper
All papers
Exam
All years
Calculations

Loading the full question list…

886 questions

  1. Q5(a)(i)

    June 2025 · Paper 2

    The whole paper ↗
    Setup for original question 5(a)(i)

    Loading the question setup…

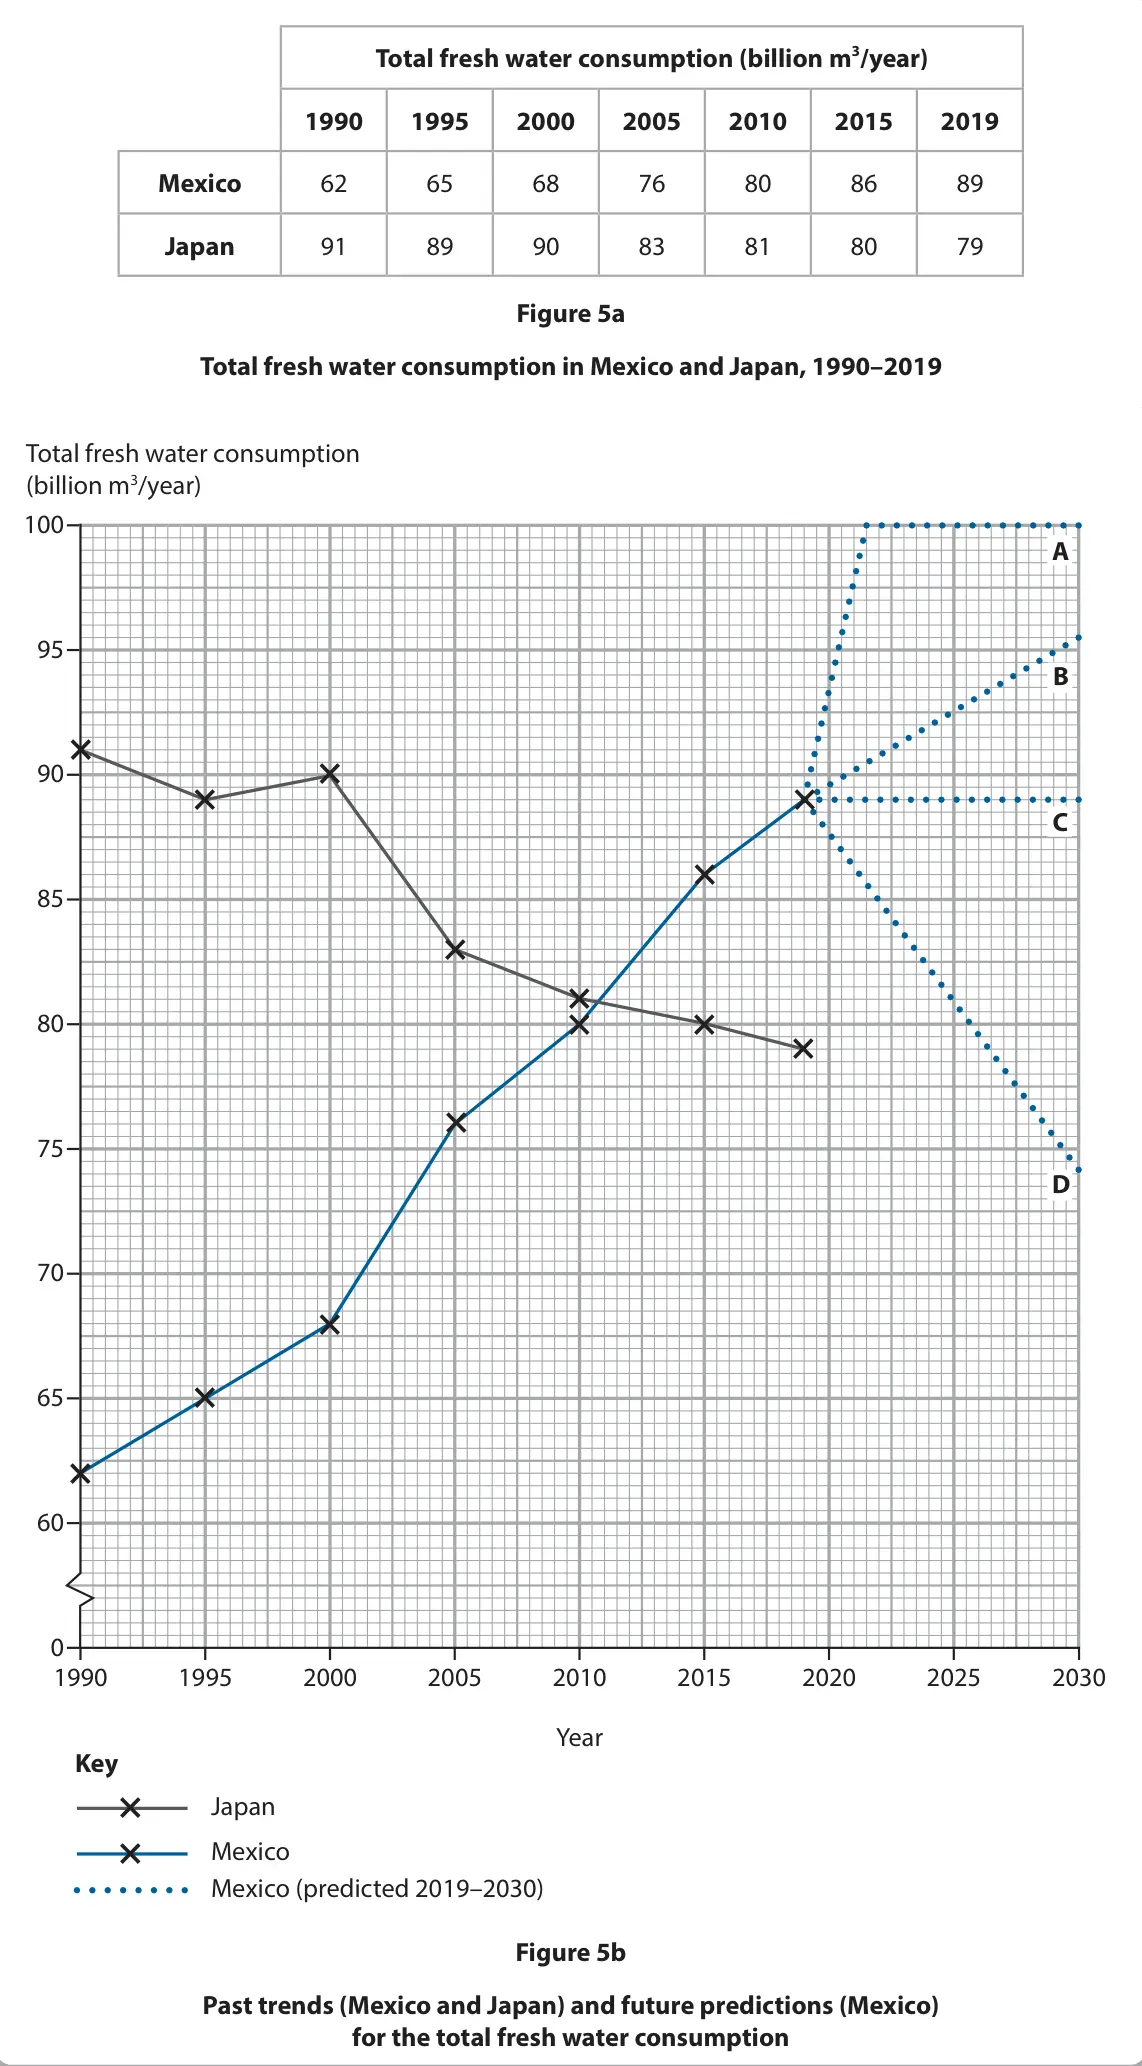
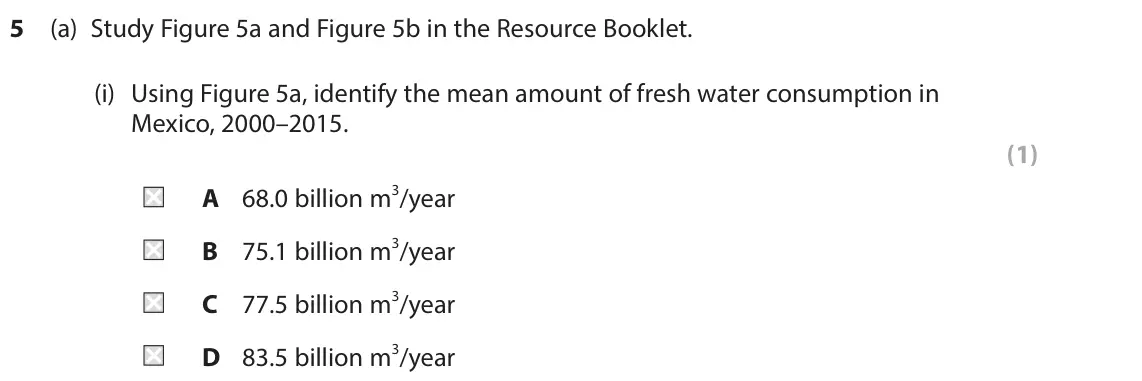
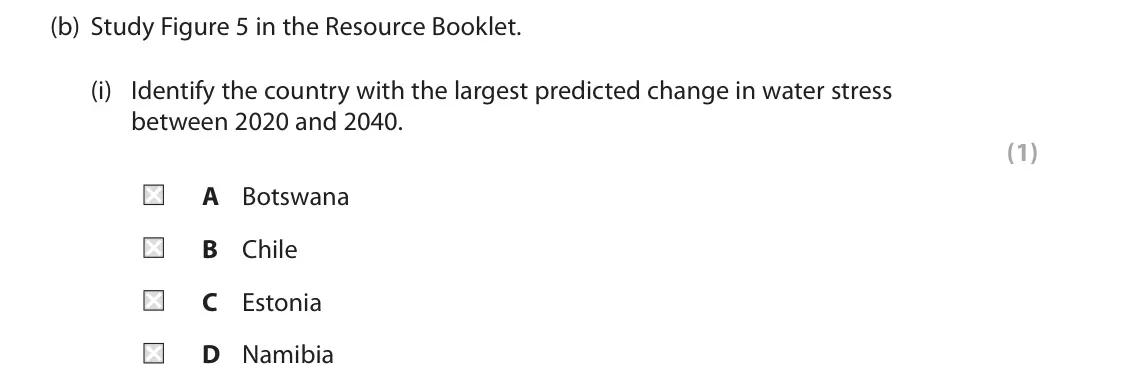
    Original question 5(a)(i): Using Figure 5a, identify the mean amount of fresh water consumption in Mexico, 2000–2015. (1) A 68.0 billion m3/year B 75.1 billion m3/year C 77.5 billion m3/y

    Loading the question…

    (Total for Question 5 is 1 mark)
  2. Q5(a)(ii)

    June 2025 · Paper 2

    The whole paper ↗
    Setup for original question 5(a)(ii)

    Loading the question setup…

    Original question 5(a)(ii): Suggest one reason for the trend, from 1990 to 2019, in Mexico’s total fresh water consumption. You must use evidence from Figure 5a in your answer. (3) Total f

    Loading the question…

    (Total for Question 5 is 3 marks)
  3. Q5(a)(iii)

    June 2025 · Paper 2

    The whole paper ↗
    Setup for original question 5(a)(iii)

    Loading the question setup…

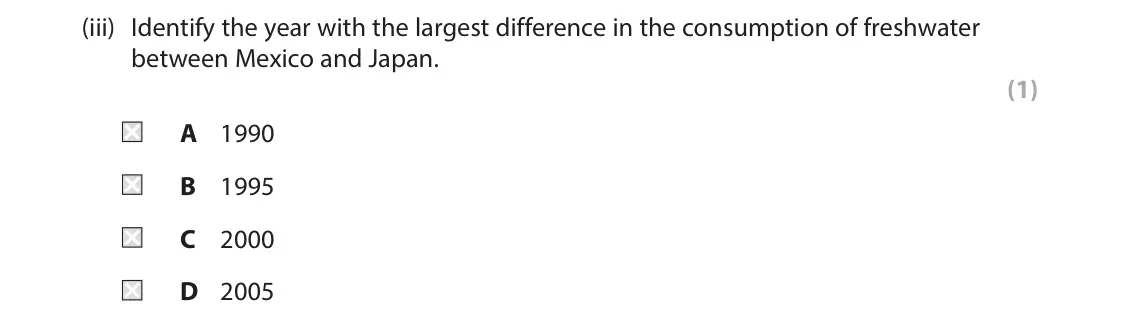
    Original question 5(a)(iii): Identify the year with the largest difference in the consumption of freshwater between Mexico and Japan. (1) A 1990 B 1995 C 2000 D 2005 Total fresh water consu

    Loading the question…

    (Total for Question 5 is 1 mark)
  4. Q5(a)(iv)

    June 2025 · Paper 2

    The whole paper ↗
    Setup for original question 5(a)(iv)

    Loading the question setup…

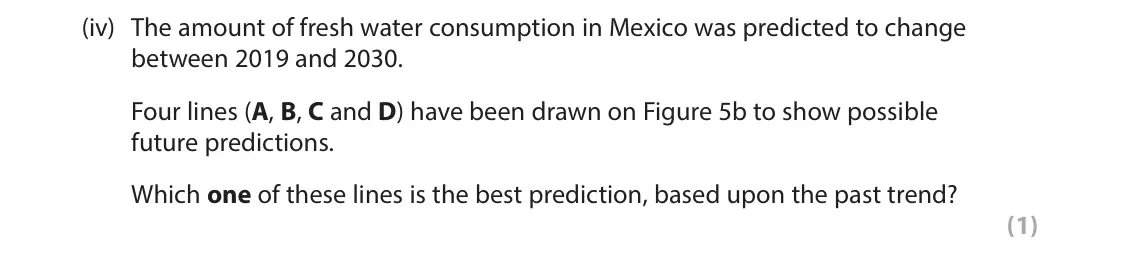
    Original question 5(a)(iv): The amount of fresh water consumption in Mexico was predicted to change between 2019 and 2030. Four lines (A, B, C and D) have been drawn on Figure 5b to show p

    Loading the question…

    (Total for Question 5 is 1 mark)
  5. Q5(a)(v)

    June 2025 · Paper 2

    The whole paper ↗
    Setup for original question 5(a)(v)

    Loading the question setup…

    Original question 5(a)(v): Describe the past trend in the amount of fresh water consumption in Japan shown in Figure 5b. You must use data to support your answer. (3) Total fresh water co

    Loading the question…

    (Total for Question 5 is 3 marks)
  6. Q5(a)

    June 2023 · Paper 2

    The whole paper ↗
    Setup for original question 5(a)

    Loading the question setup…

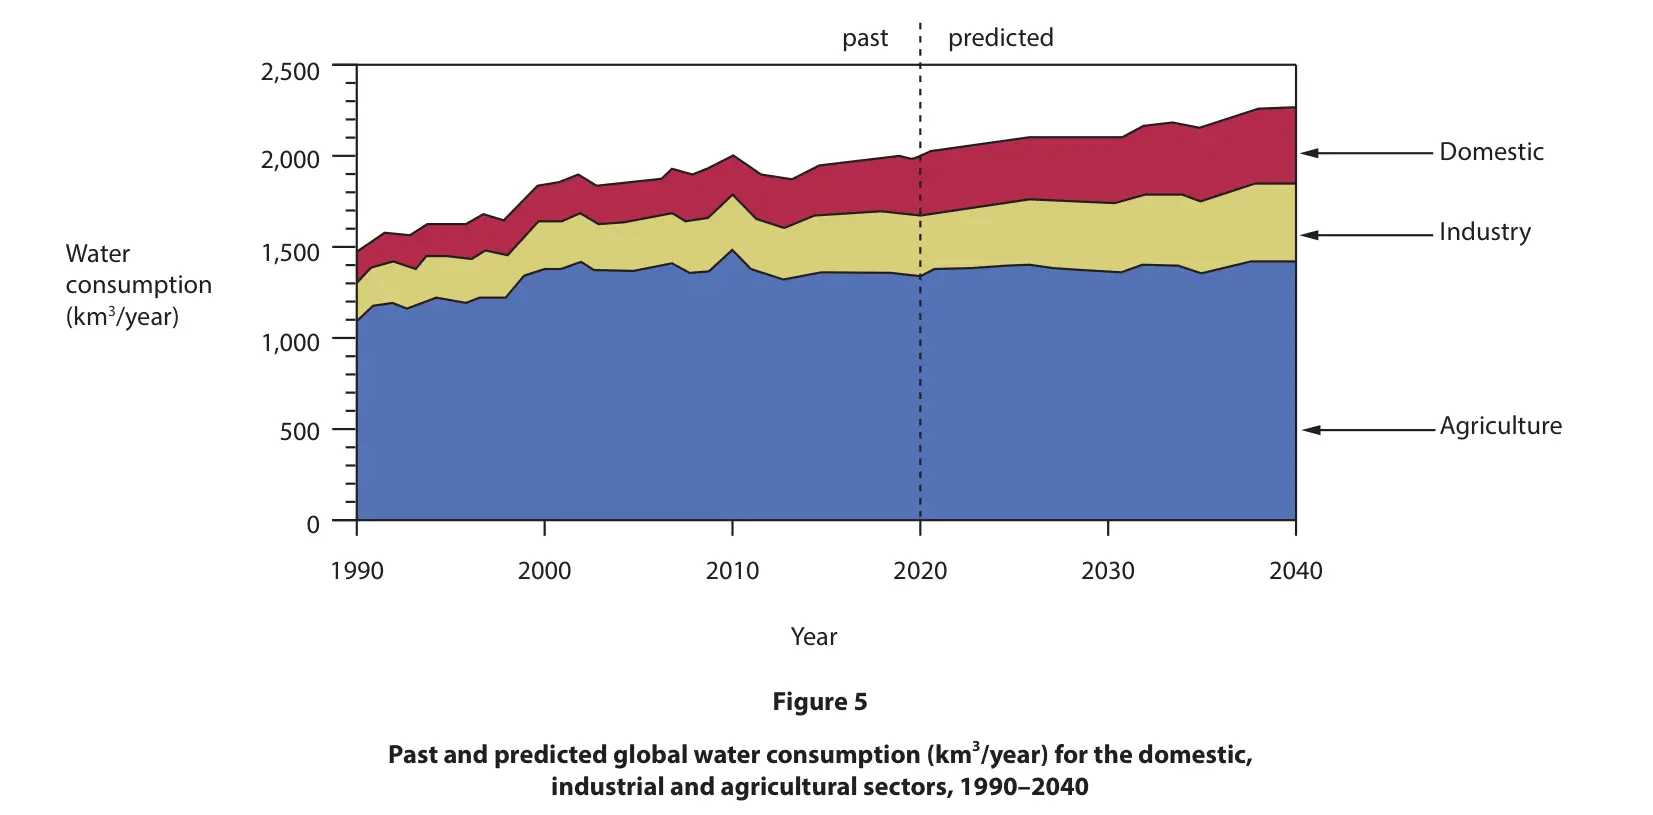
    Original question 5(a): Define the term water surplus. (1) past predicted 2,500 Domestic 2,000 Industry Water 1,500 consumption (km3/year) 1,000 Agriculture 500 0 1990 2000 2010 2020 2

    Loading the question…

    (Total for Question 5 is 1 mark)
  7. Q5(b)(i)

    June 2023 · Paper 2

    The whole paper ↗
    Setup for original question 5(b)(i)

    Loading the question setup…

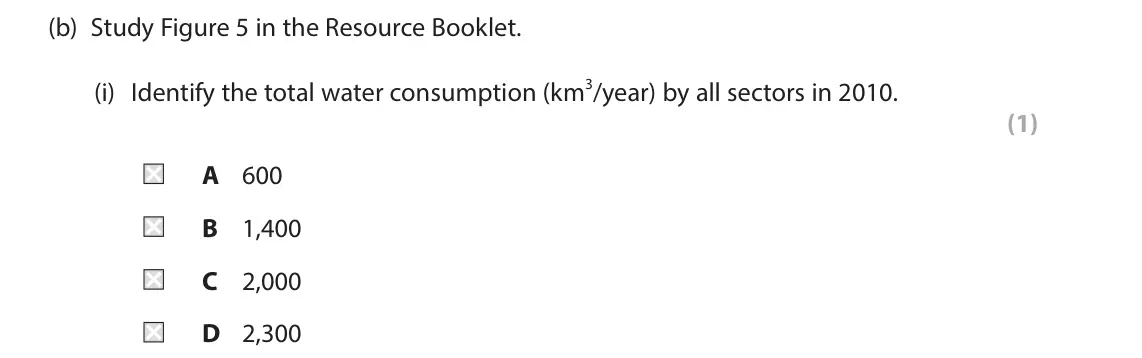
    Original question 5(b)(i): Identify the total water consumption (km3/year) by all sectors in 2010. (1) A 600 B 1,400 C 2,000 D 2,300 past predicted 2,500 Domestic 2,000 Industry Water 1,5

    Loading the question…

    (Total for Question 5 is 1 mark)
  8. Q5(b)(ii)

    June 2023 · Paper 2

    The whole paper ↗
    Setup for original question 5(b)(ii)

    Loading the question setup…

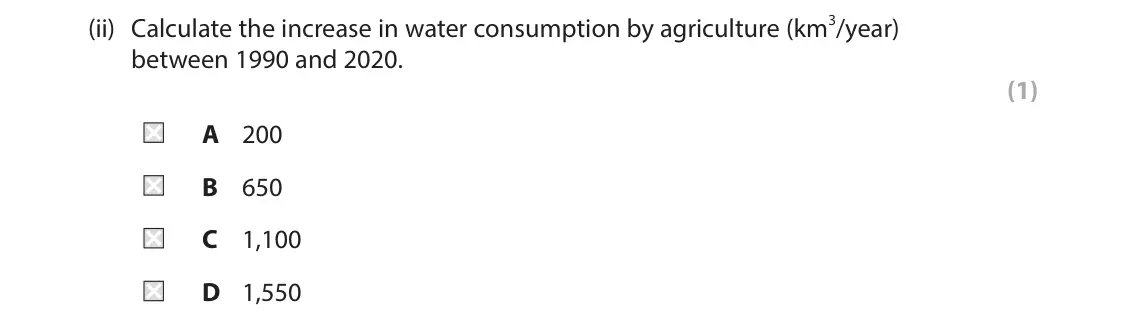
    Original question 5(b)(ii): Calculate the increase in water consumption by agriculture (km3/year) between 1990 and 2020. (1) A 200 B 650 C 1,100 D 1,550 past predicted 2,500 Domestic 2,000

    Loading the question…

    (Total for Question 5 is 1 mark)
  9. Q5(b)(iii)

    June 2023 · Paper 2

    The whole paper ↗
    Setup for original question 5(b)(iii)

    Loading the question setup…

    Original question 5(b)(iii): Name the sector with the smallest predicted change between 2020 and 2040. (1) past predicted 2,500 Domestic 2,000 Industry Water 1,500 consumption (km3/year) 1,

    Loading the question…

    (Total for Question 5 is 1 mark)
  10. Q5(b)(iv)

    June 2023 · Paper 2

    The whole paper ↗
    Setup for original question 5(b)(iv)

    Loading the question setup…

    Original question 5(b)(iv): State one possible reason for the trend in domestic water consumption between 1990 and 2020. (1) past predicted 2,500 Domestic 2,000 Industry Water 1,500 consum

    Loading the question…

    (Total for Question 5 is 1 mark)
  11. Q5(d)

    June 2023 · Paper 2

    The whole paper ↗
    Setup for original question 5(d)

    Loading the question setup…

    Original question 5(d): Explain two reasons why some parts of the world have a limited supply of fresh water. (4) past predicted 2,500 Domestic 2,000 Industry Water 1,500 consumption (

    Loading the question…

    (Total for Question 5 is 4 marks)
  12. Q5(a)

    June 2022 · Paper 2

    The whole paper ↗
    Setup for original question 5(a)

    Loading the question setup…

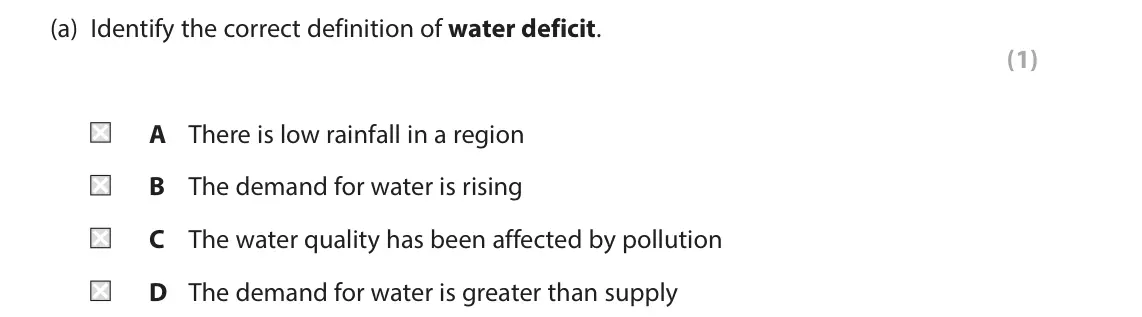
    Original question 5(a): Identify the correct definition of water deficit. (1) A There is low rainfall in a region B The demand for water is rising C The water quality has been affected

    Loading the question…

    (Total for Question 5 is 1 mark)
  13. Q5(c)

    June 2022 · Paper 2

    The whole paper ↗
    Setup for original question 5(c)

    Loading the question setup…

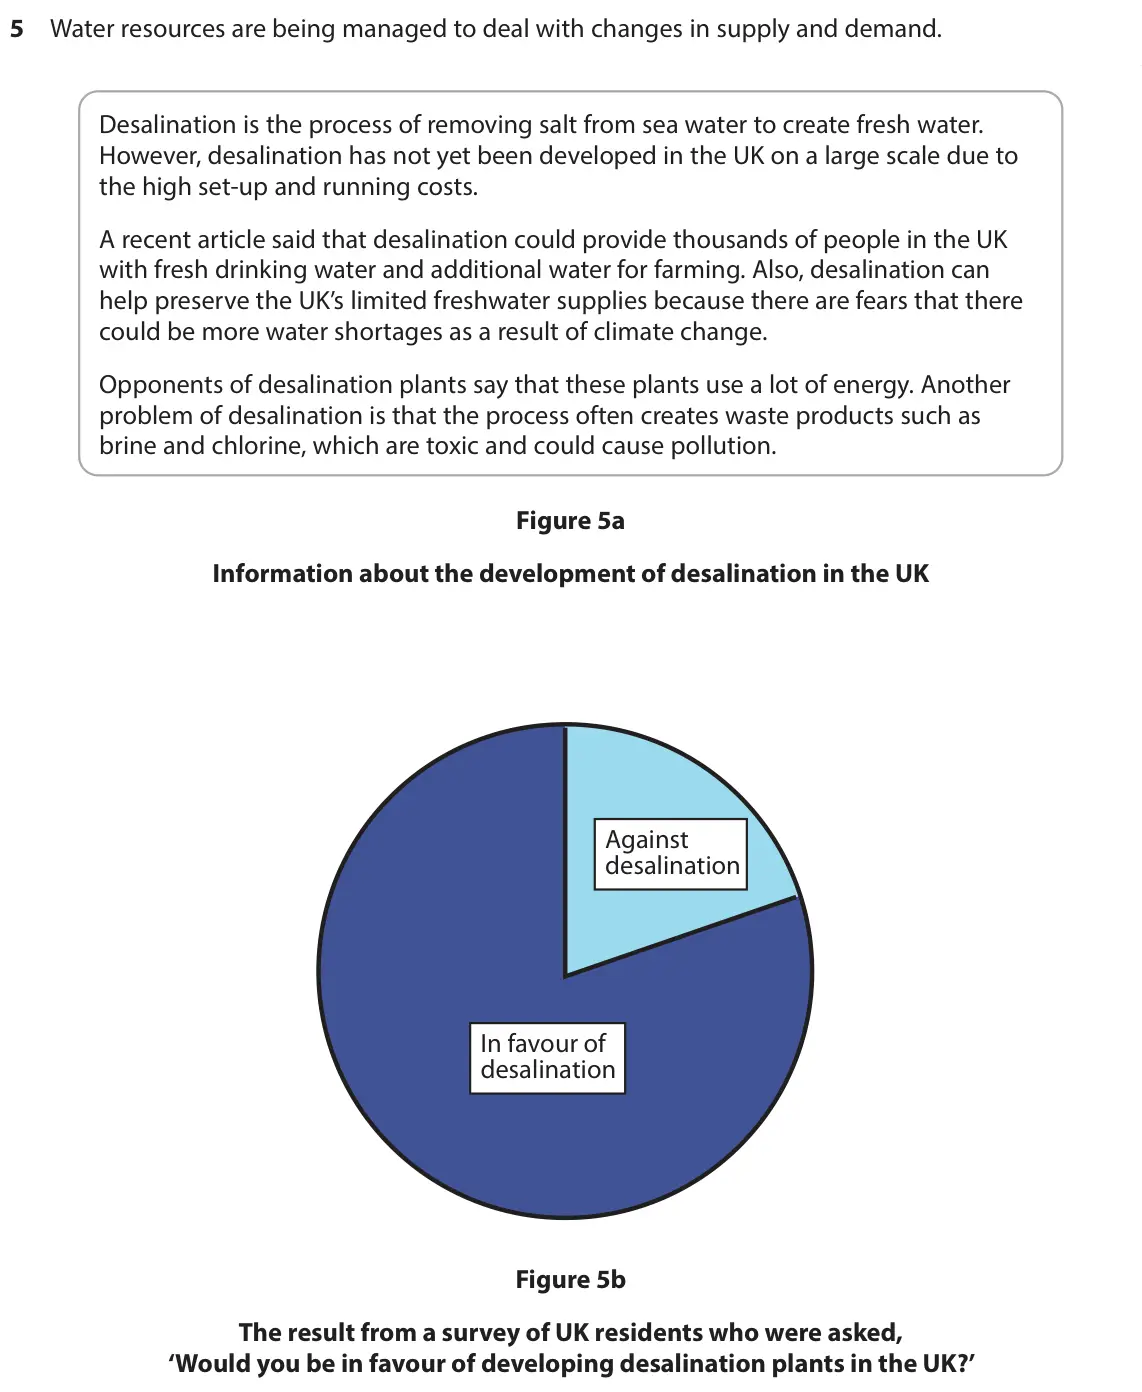
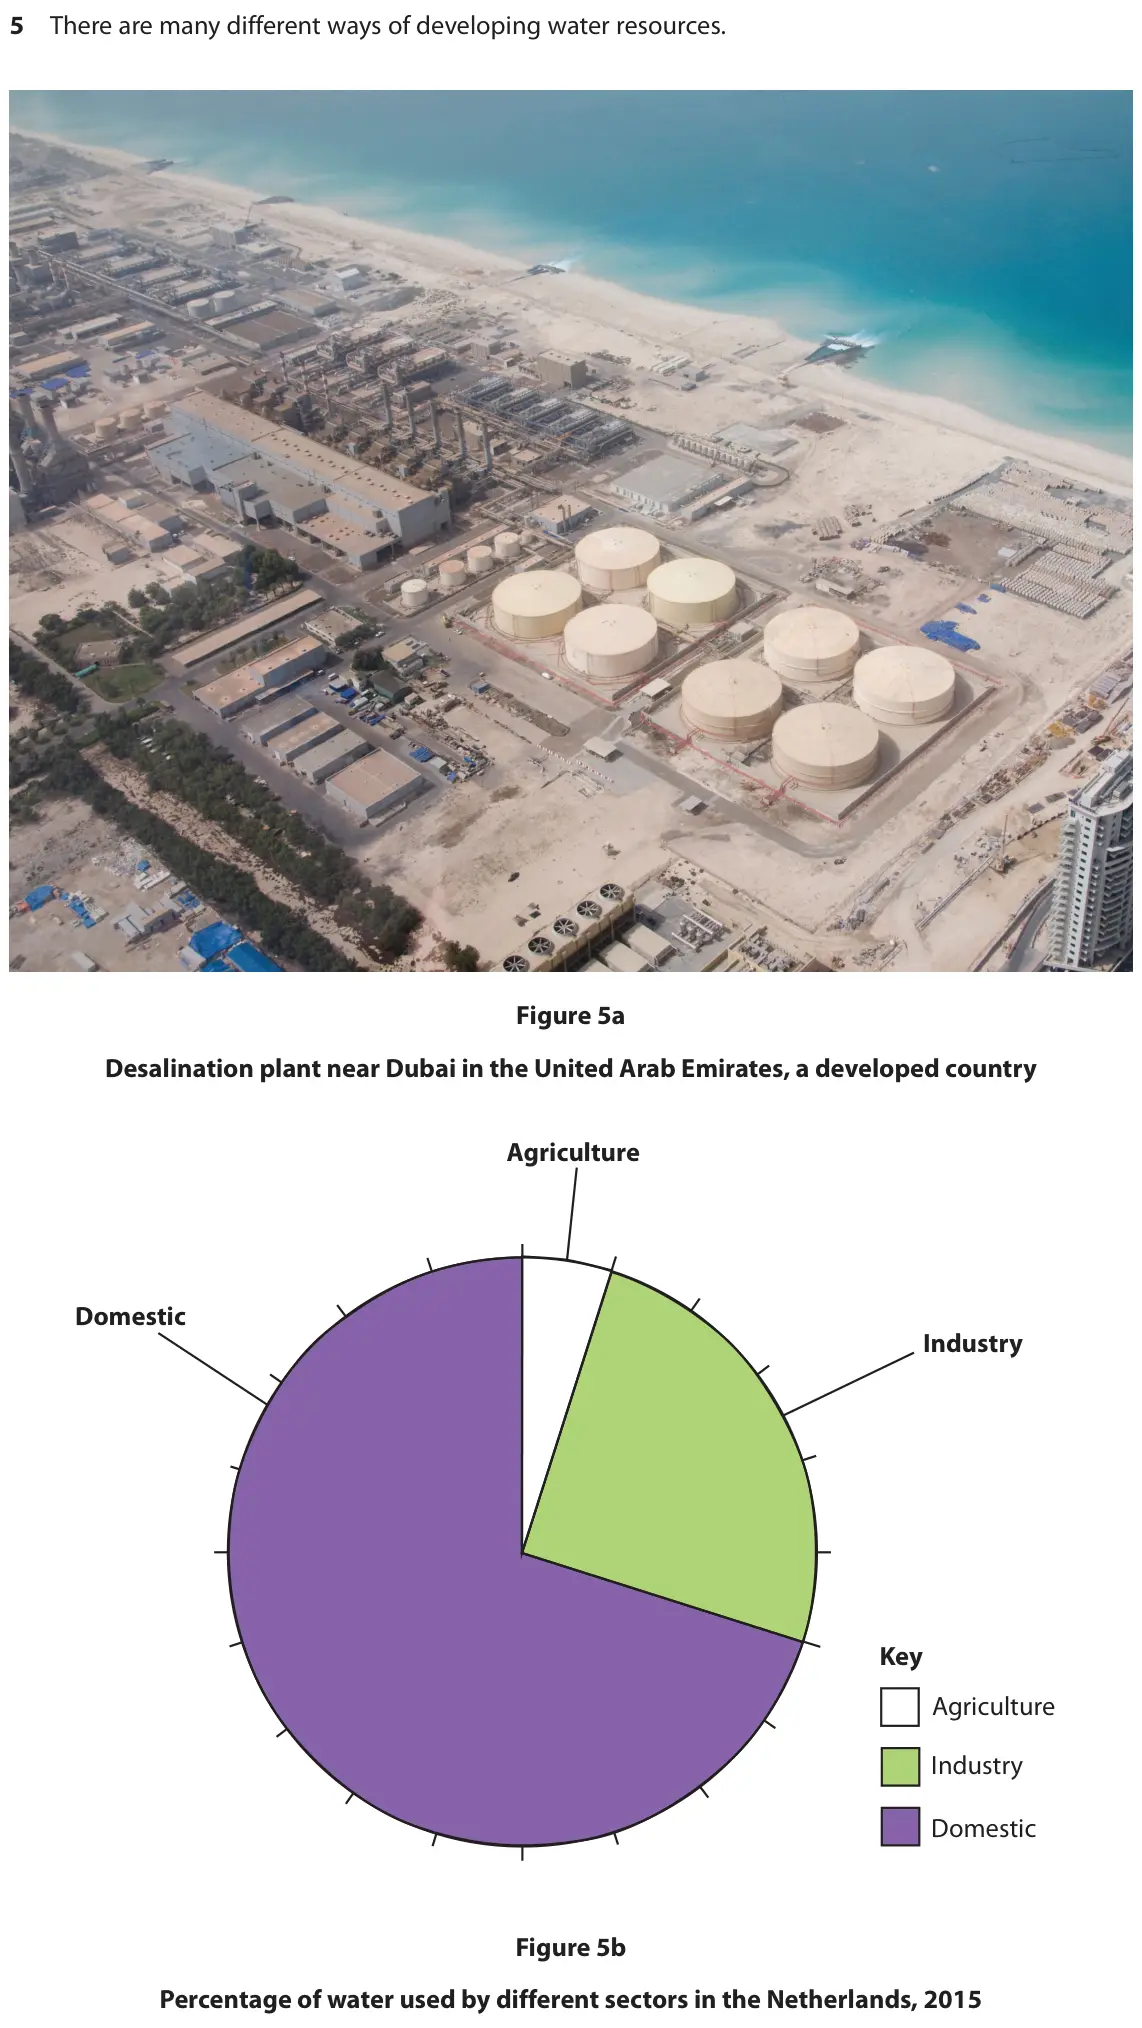
    Original question 5(c): Explain two reasons why the global demand for water has increased. (4) 5 Water resources are being managed to deal with changes in supply and demand. Desalinati

    Loading the question…

    (Total for Question 5 is 4 marks)
  14. Setup for original question 5(e)

    Loading the question setup…

    Original question 5(e): Assess the following statement. (8) Low annual rainfall is the main reason why some countries have water supply problems and are struggling to meet demand. 5 Wa

    Loading the question…

    (Total for Question 5 is 8 marks)
  15. Q5(a)

    November 2021 · Paper 2

    The whole paper ↗
    Setup for original question 5(a)

    Loading the question setup…

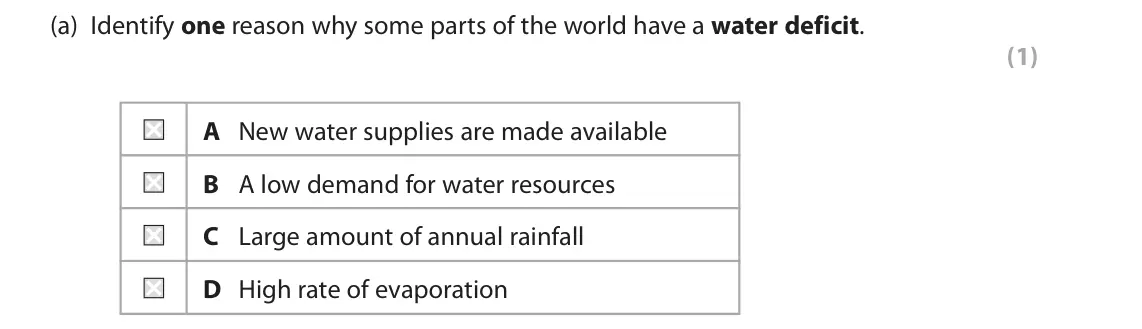
    Original question 5(a): Identify one reason why some parts of the world have a water deficit. (1) A New water supplies are made available B A low demand for water resources C Large amo

    Loading the question…

    (Total for Question 5 is 1 mark)
  16. Q5(e)

    November 2021 · Paper 2

    The whole paper ↗
    Setup for original question 5(e)

    Loading the question setup…

    Original question 5(e): Assess the reasons why the global demand and supply for water resources has changed over the past 50 years. (8) 5 There are many different ways of developing wa

    Loading the question…

    (Total for Question 5 is 8 marks)
  17. Q5(b)(i)

    November 2020 · Paper 2

    The whole paper ↗
    Setup for original question 5(b)(i)

    Loading the question setup…

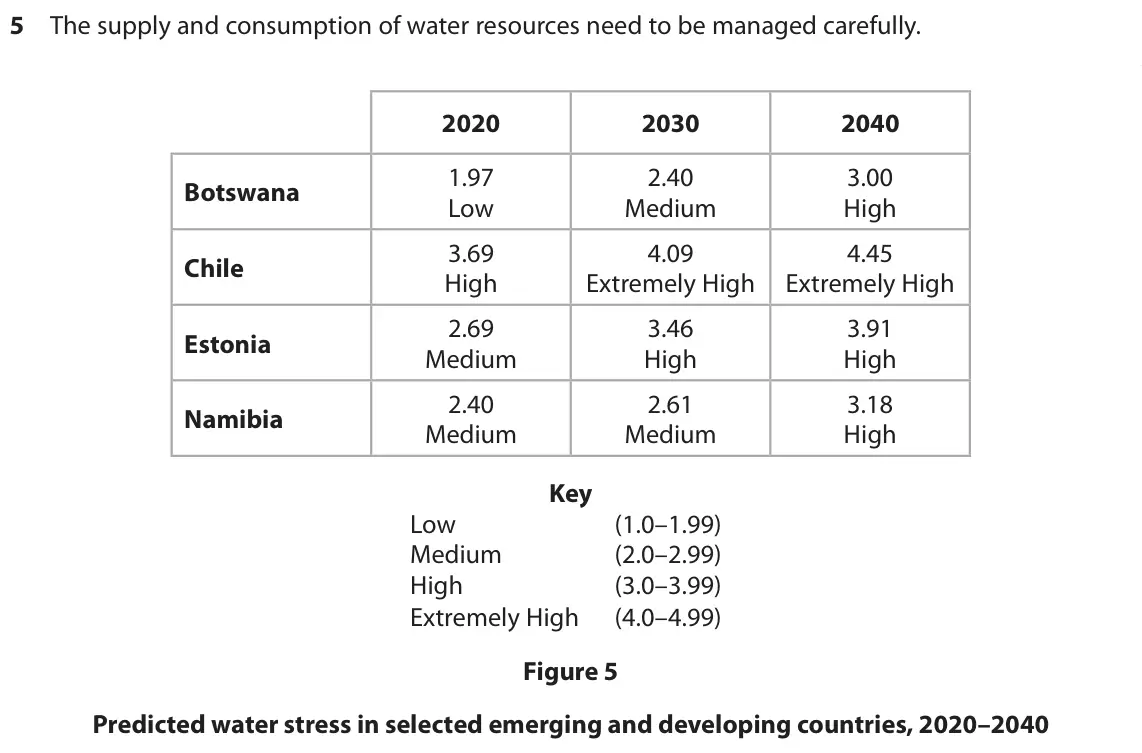
    Original question 5(b)(i): Identify the country with the largest predicted change in water stress between 2020 and 2040. (1) A Botswana B Chile C Estonia D Namibia 5 The supply and consum

    Loading the question…

    (Total for Question 5 is 1 mark)
  18. Q5(b)(ii)

    November 2020 · Paper 2

    The whole paper ↗
    Setup for original question 5(b)(ii)

    Loading the question setup…

    Original question 5(b)(ii): Compare the trends for Botswana and Chile shown in Figure 5. Use data in your answer. (3) 5 The supply and consumption of water resources need to be managed car

    Loading the question…

    (Total for Question 5 is 3 marks)
  19. Q5(b)(iii)

    November 2020 · Paper 2

    The whole paper ↗
    Setup for original question 5(b)(iii)

    Loading the question setup…

    Original question 5(b)(iii): Suggest one reason for the predicted trends in water stress shown in Figure 5. (2) 5 The supply and consumption of water resources need to be managed carefully.

    Loading the question…

    (Total for Question 5 is 2 marks)
  20. Q5(a)

    June 2019 · Paper 2

    The whole paper ↗
    Setup for original question 5(a)

    Loading the question setup…

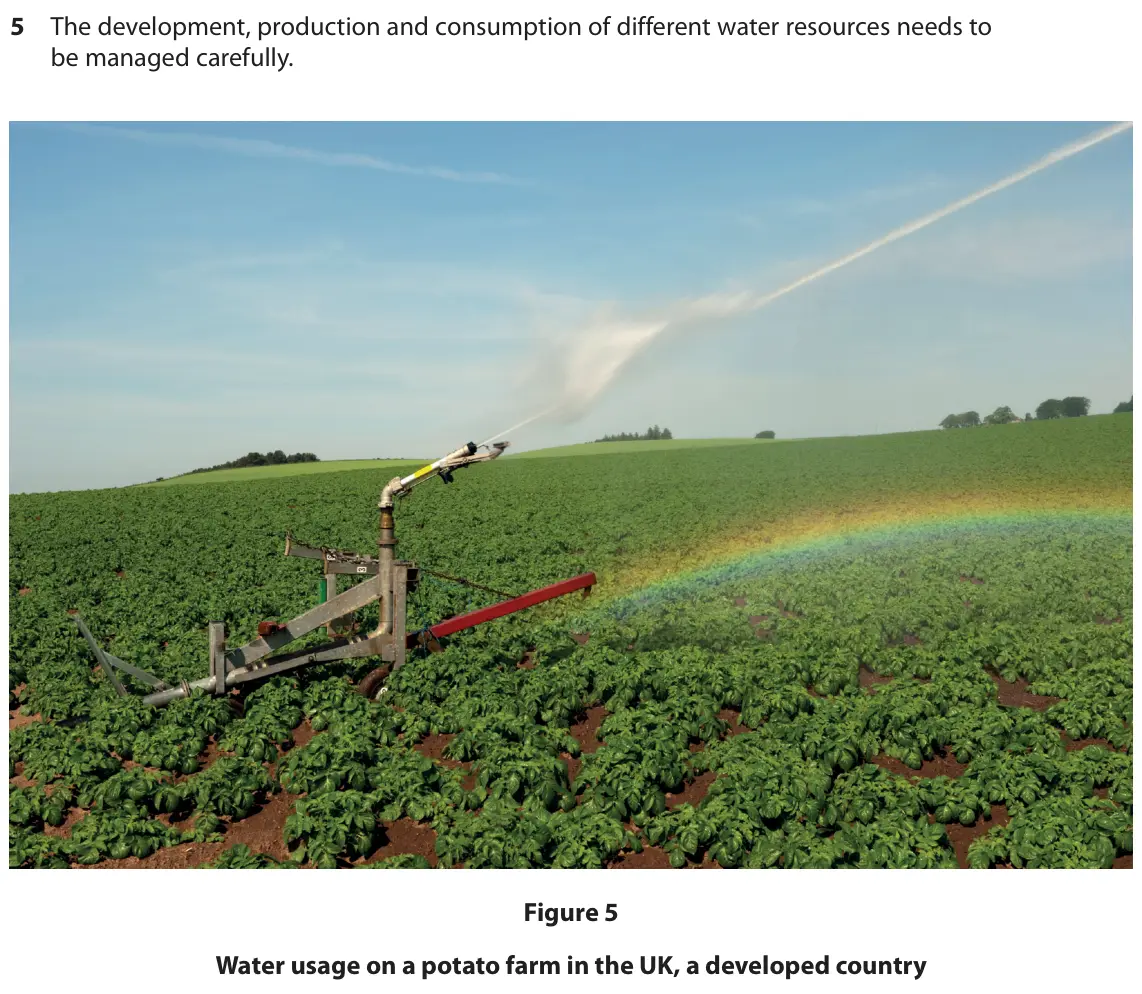
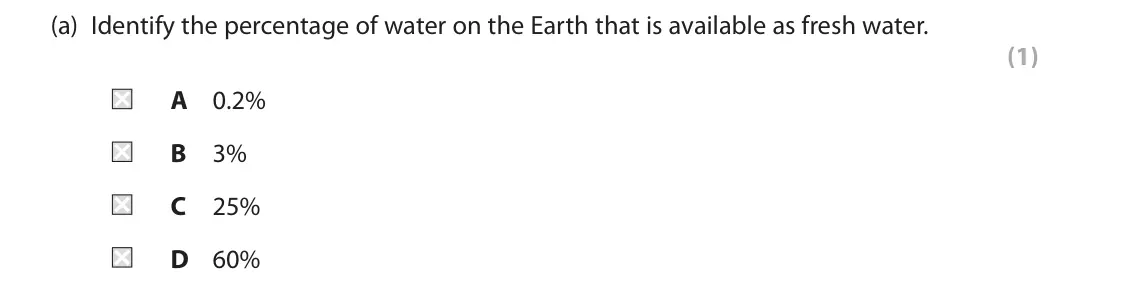
    Original question 5(a): Identify the percentage of water on the Earth that is available as fresh water. (1) A 0.2% B 3% C 25% D 60% 5 The development, production and consumption of dif

    Loading the question…

    (Total for Question 5 is 1 mark)
All 22 questions on The supply of fresh water supply varies globally, as a list
  1. June 2025, Paper 2, Q5(a)(i) (1 mark): Using Figure 5a, identify the mean amount of fresh water consumption in Mexico, 2000–2015. (1) A 68.0 billion m3/year B 75.1 billion m3/year C 77.5 billion m3/y
  2. June 2025, Paper 2, Q5(a)(ii) (3 marks): Suggest one reason for the trend, from 1990 to 2019, in Mexico’s total fresh water consumption. You must use evidence from Figure 5a in your answer. (3) Total f
  3. June 2025, Paper 2, Q5(a)(iii) (1 mark): Identify the year with the largest difference in the consumption of freshwater between Mexico and Japan. (1) A 1990 B 1995 C 2000 D 2005 Total fresh water consu
  4. June 2025, Paper 2, Q5(a)(iv) (1 mark): The amount of fresh water consumption in Mexico was predicted to change between 2019 and 2030. Four lines (A, B, C and D) have been drawn on Figure 5b to show p
  5. June 2025, Paper 2, Q5(a)(v) (3 marks): Describe the past trend in the amount of fresh water consumption in Japan shown in Figure 5b. You must use data to support your answer. (3) Total fresh water co
  6. June 2023, Paper 2, Q5(a) (1 mark): Define the term water surplus. (1) past predicted 2,500 Domestic 2,000 Industry Water 1,500 consumption (km3/year) 1,000 Agriculture 500 0 1990 2000 2010 2020 2
  7. June 2023, Paper 2, Q5(b)(i) (1 mark): Identify the total water consumption (km3/year) by all sectors in 2010. (1) A 600 B 1,400 C 2,000 D 2,300 past predicted 2,500 Domestic 2,000 Industry Water 1,5
  8. June 2023, Paper 2, Q5(b)(ii) (1 mark): Calculate the increase in water consumption by agriculture (km3/year) between 1990 and 2020. (1) A 200 B 650 C 1,100 D 1,550 past predicted 2,500 Domestic 2,000
  9. June 2023, Paper 2, Q5(b)(iii) (1 mark): Name the sector with the smallest predicted change between 2020 and 2040. (1) past predicted 2,500 Domestic 2,000 Industry Water 1,500 consumption (km3/year) 1,
  10. June 2023, Paper 2, Q5(b)(iv) (1 mark): State one possible reason for the trend in domestic water consumption between 1990 and 2020. (1) past predicted 2,500 Domestic 2,000 Industry Water 1,500 consum
  11. June 2023, Paper 2, Q5(d) (4 marks): Explain two reasons why some parts of the world have a limited supply of fresh water. (4) past predicted 2,500 Domestic 2,000 Industry Water 1,500 consumption (
  12. June 2022, Paper 2, Q5(a) (1 mark): Identify the correct definition of water deficit. (1) A There is low rainfall in a region B The demand for water is rising C The water quality has been affected
  13. June 2022, Paper 2, Q5(c) (4 marks): Explain two reasons why the global demand for water has increased. (4) 5 Water resources are being managed to deal with changes in supply and demand. Desalinati
  14. June 2022, Paper 2, Q5(e) (8 marks): Assess the following statement. (8) Low annual rainfall is the main reason why some countries have water supply problems and are struggling to meet demand. 5 Wa
  15. November 2021, Paper 2, Q5(a) (1 mark): Identify one reason why some parts of the world have a water deficit. (1) A New water supplies are made available B A low demand for water resources C Large amo
  16. November 2021, Paper 2, Q5(e) (8 marks): Assess the reasons why the global demand and supply for water resources has changed over the past 50 years. (8) 5 There are many different ways of developing wa
  17. November 2020, Paper 2, Q5(b)(i) (1 mark): Identify the country with the largest predicted change in water stress between 2020 and 2040. (1) A Botswana B Chile C Estonia D Namibia 5 The supply and consum
  18. November 2020, Paper 2, Q5(b)(ii) (3 marks): Compare the trends for Botswana and Chile shown in Figure 5. Use data in your answer. (3) 5 The supply and consumption of water resources need to be managed car
  19. November 2020, Paper 2, Q5(b)(iii) (2 marks): Suggest one reason for the predicted trends in water stress shown in Figure 5. (2) 5 The supply and consumption of water resources need to be managed carefully.
  20. June 2019, Paper 2, Q5(a) (1 mark): Identify the percentage of water on the Earth that is available as fresh water. (1) A 0.2% B 3% C 25% D 60% 5 The development, production and consumption of dif
  21. June 2019, Paper 2, Q5(b) (1 mark): Some countries suffer from a water deficit. Define the term water deficit. (1) 5 The development, production and consumption of different water resources needs
  22. June 2018, Paper 2, Q5(a) (1 mark): Identify the meaning of the term water surplus. (1) A the supply of useable water is greater than its demand B the amount of rainfall is lower than the amount o

Questions, mark schemes and examiner’s reports are © Pearson Edexcel, from their published past papers. Plumi isn’t affiliated with any exam board. Want whole papers? Edexcel GCSE Geography A past papers.

The Plumi iPad app also offers exam-style questions with AI feedback on your handwritten working.