 plumi
The character of the chosen developing country or emerging country city is influenced by its fast rate of growth: Edexcel GCSE Geography A questions
Edexcel GCSE Geography A past-paper questions on 4.7 The character of the chosen developing country or emerging country city is influenced by its fast rate of growth, 2018–2025, with mark schemes and examiner’s reports where available.
Paper
All papers
Exam
All years
Calculations
Loading the full question list…
Q1(c)(i)
The whole paper ↗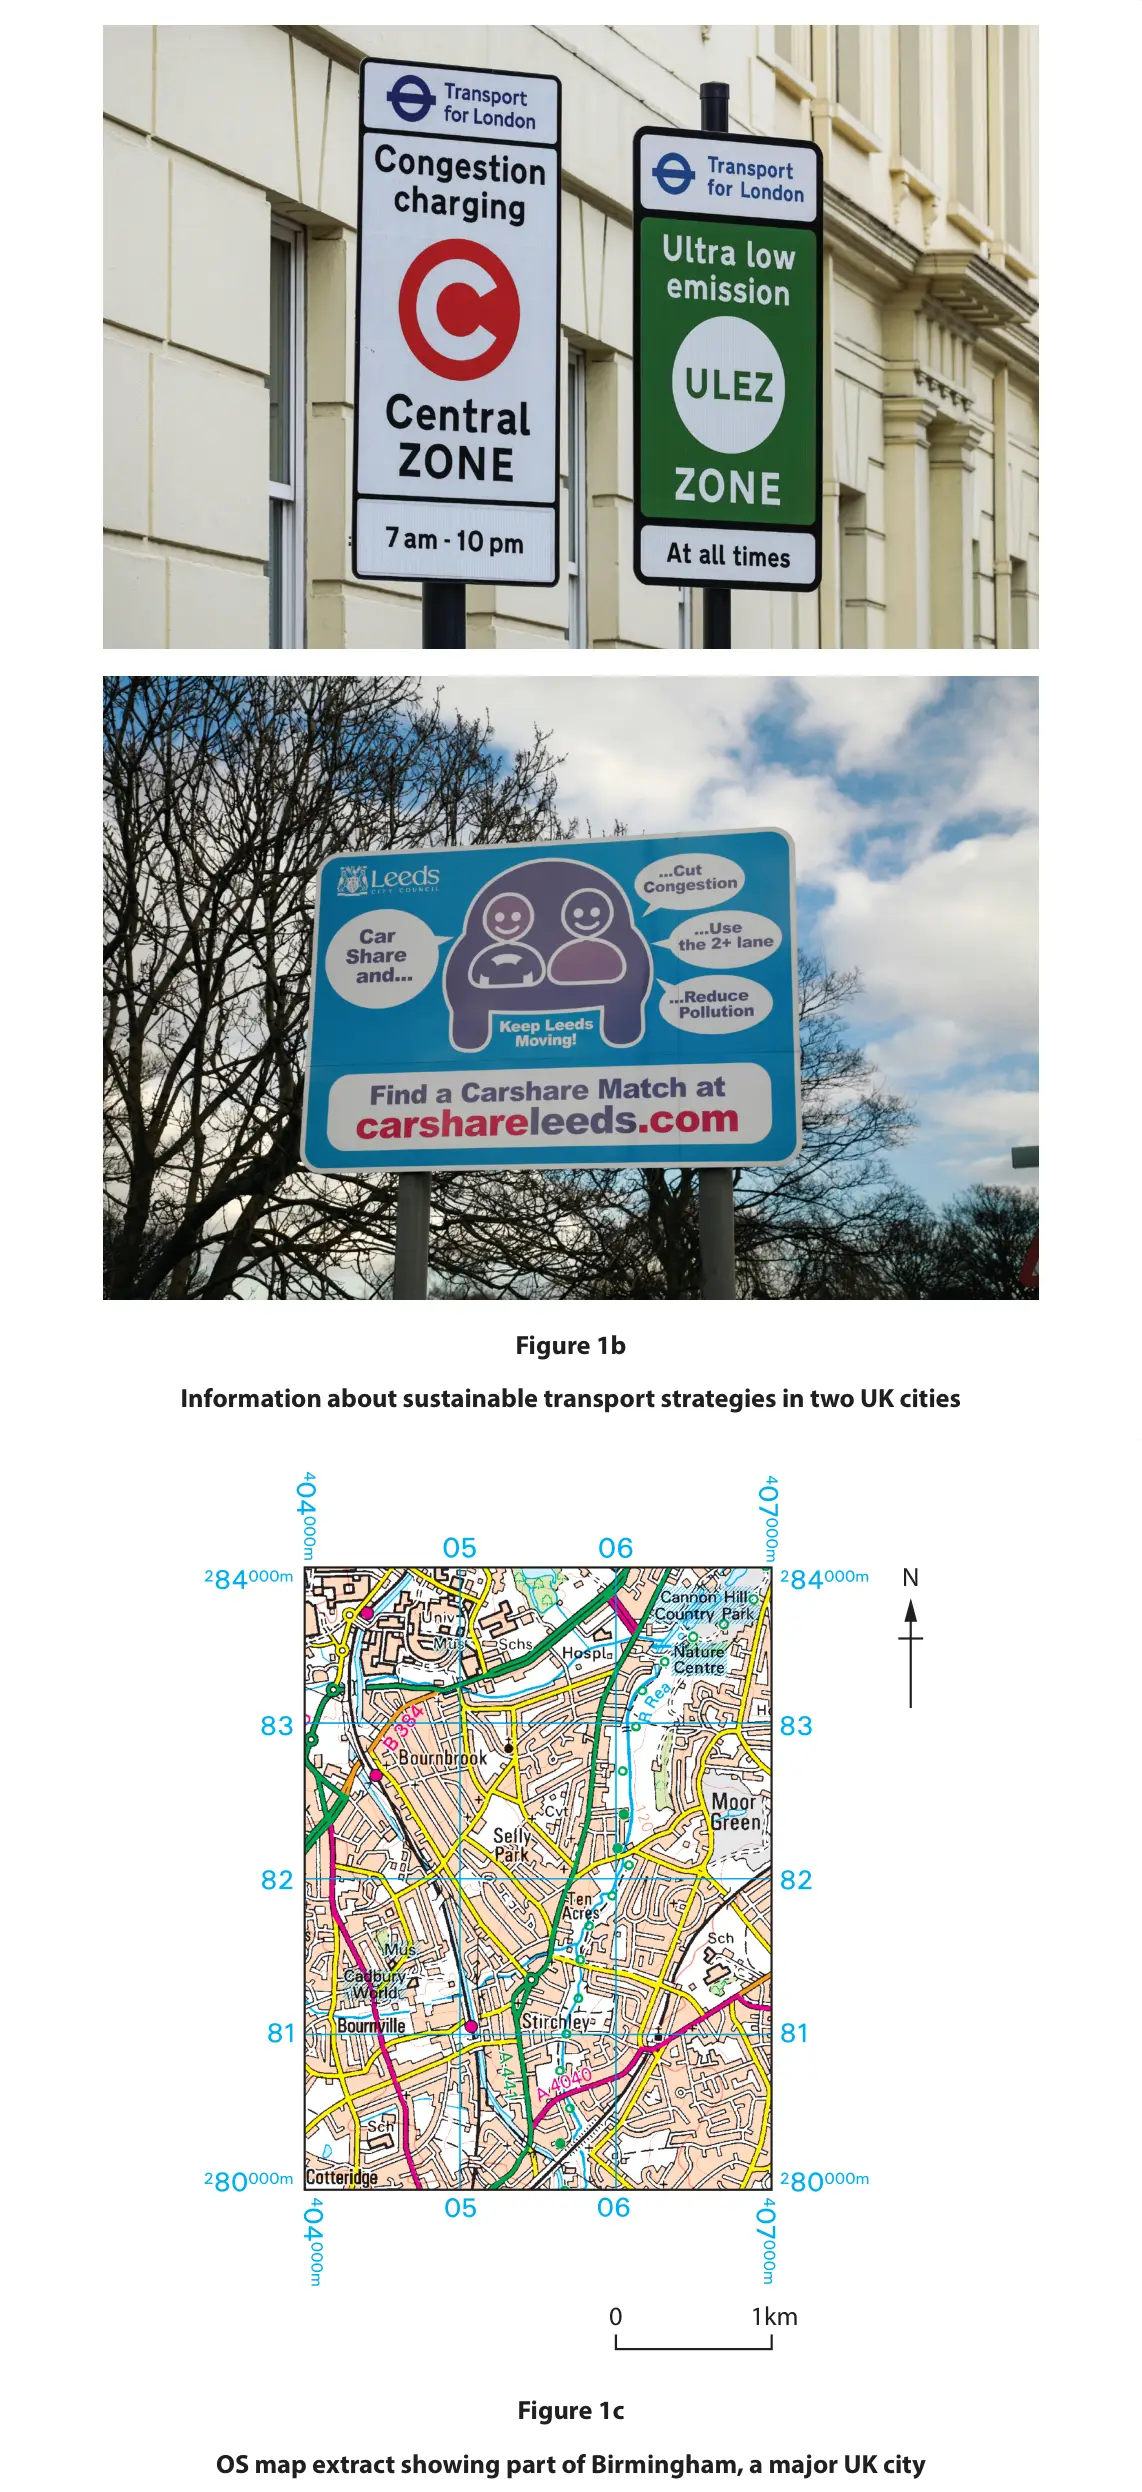 (Total for Question 1 is 2 marks)

Q1(c)(ii)
The whole paper ↗(Total for Question 1 is 4 marks)
Q1(f)(ii)
The whole paper ↗(Total for Question 1 is 8 marks)
Q1(d)(i)
The whole paper ↗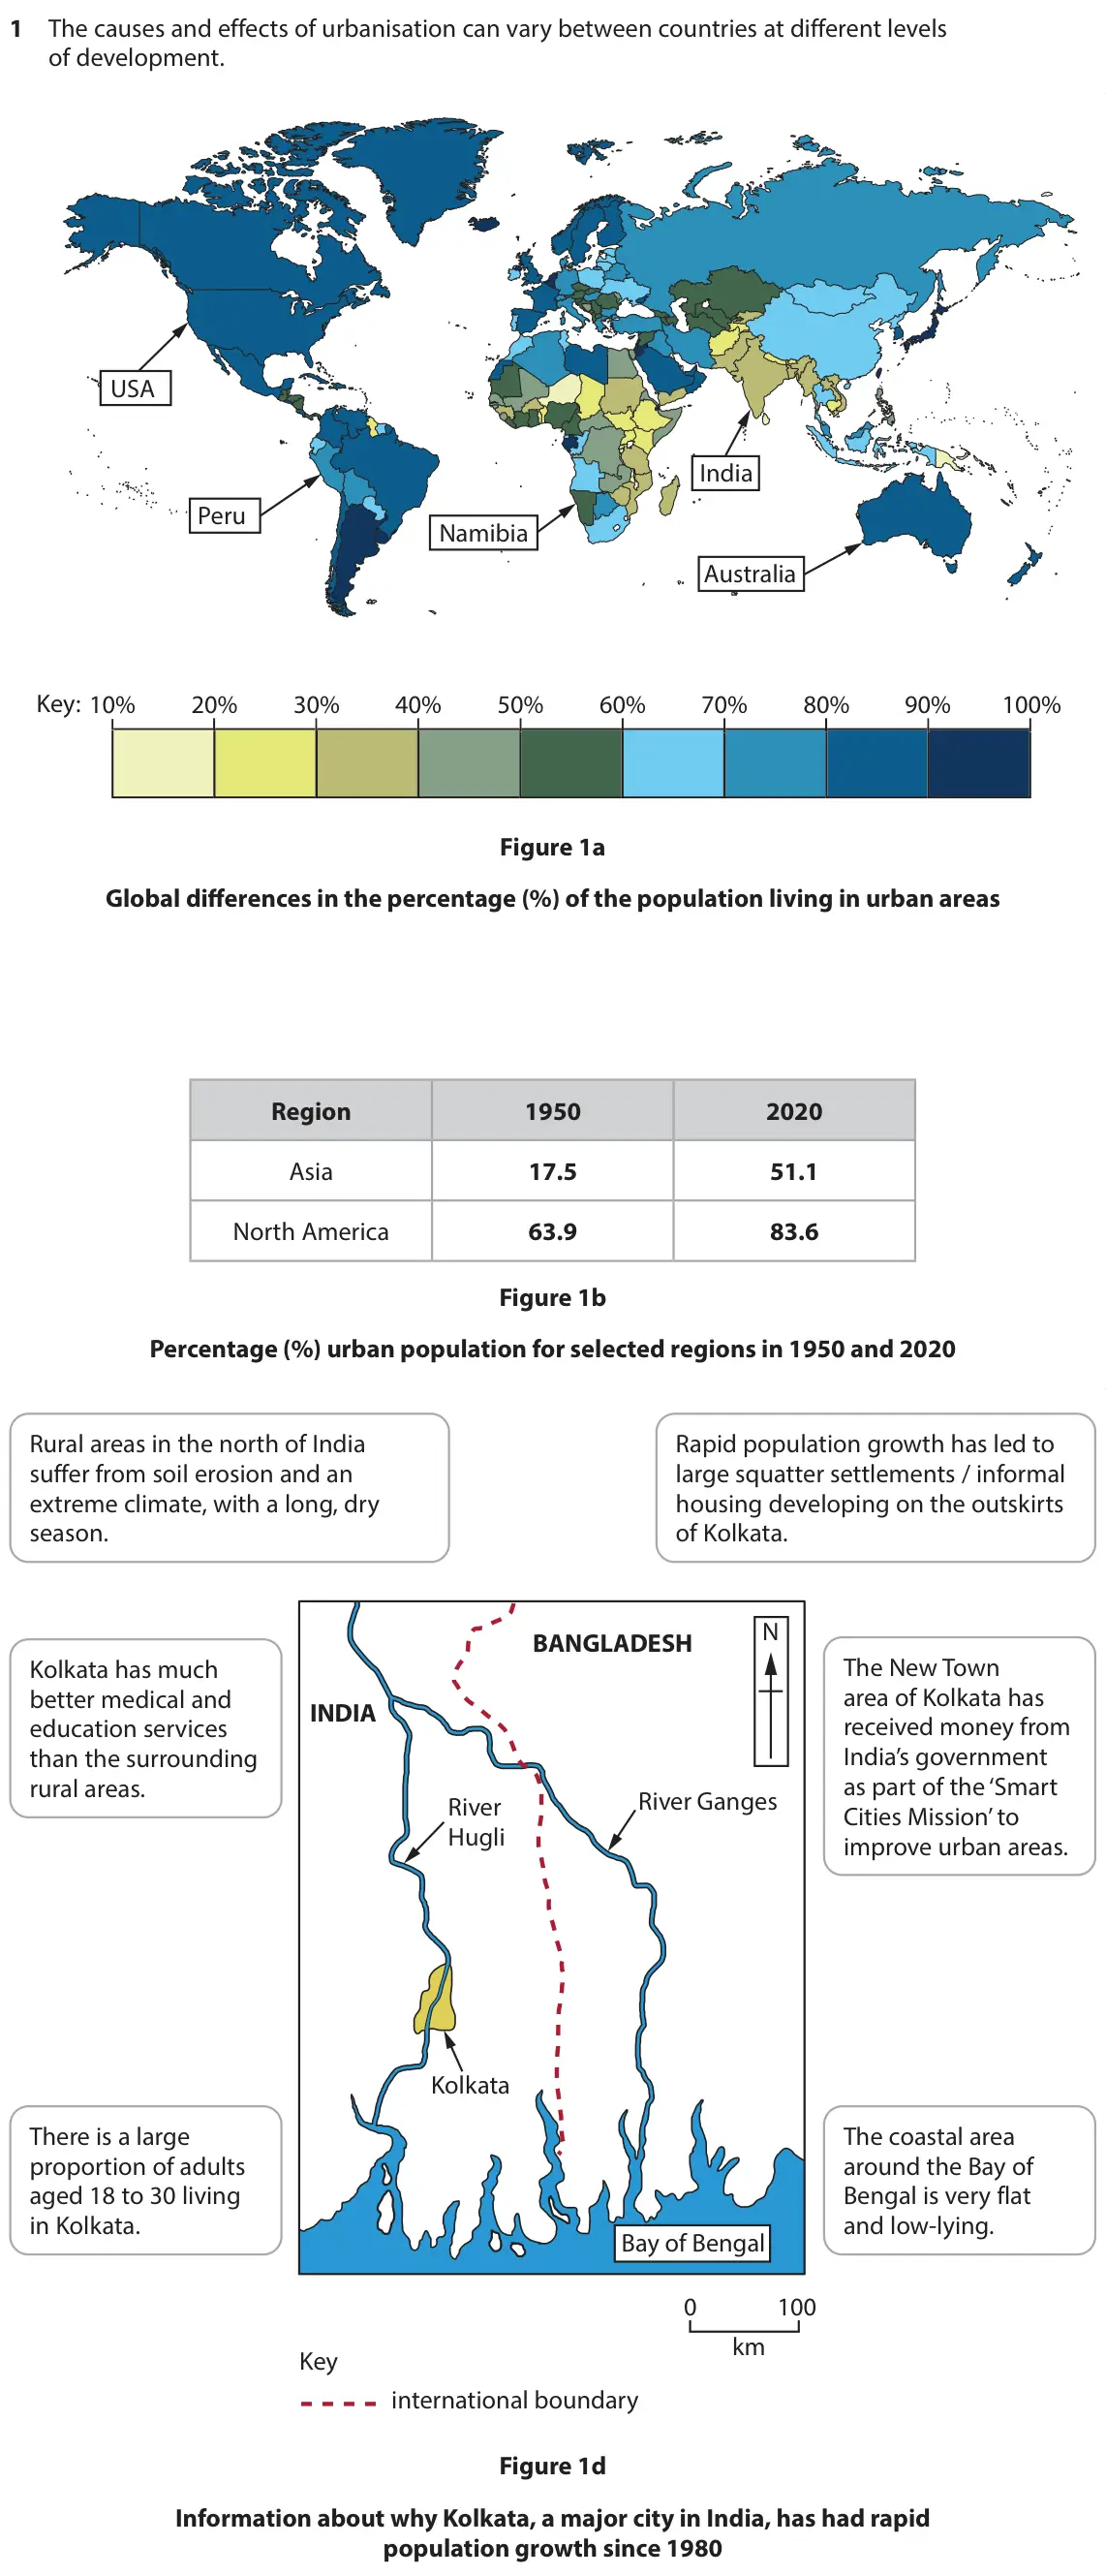 (Total for Question 1 is 2 marks)
Q1(d)(ii)
The whole paper ↗(Total for Question 1 is 1 mark)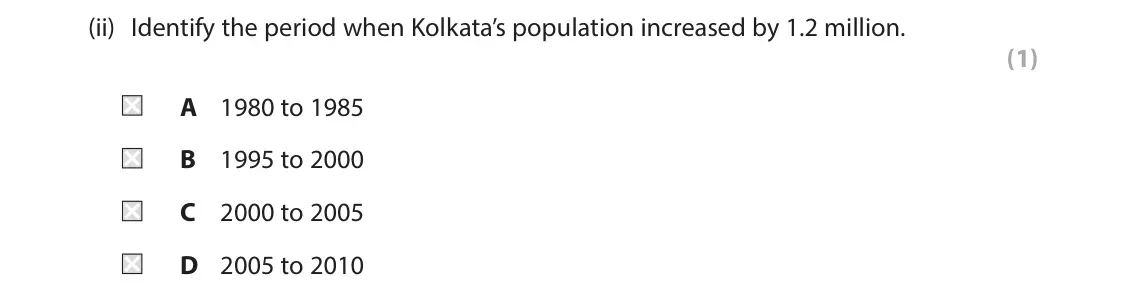
Q1(d)(iii)
The whole paper ↗(Total for Question 1 is 2 marks)
Q1(e)(ii)
The whole paper ↗(Total for Question 1 is 4 marks)
Q1(g)(i)
The whole paper ↗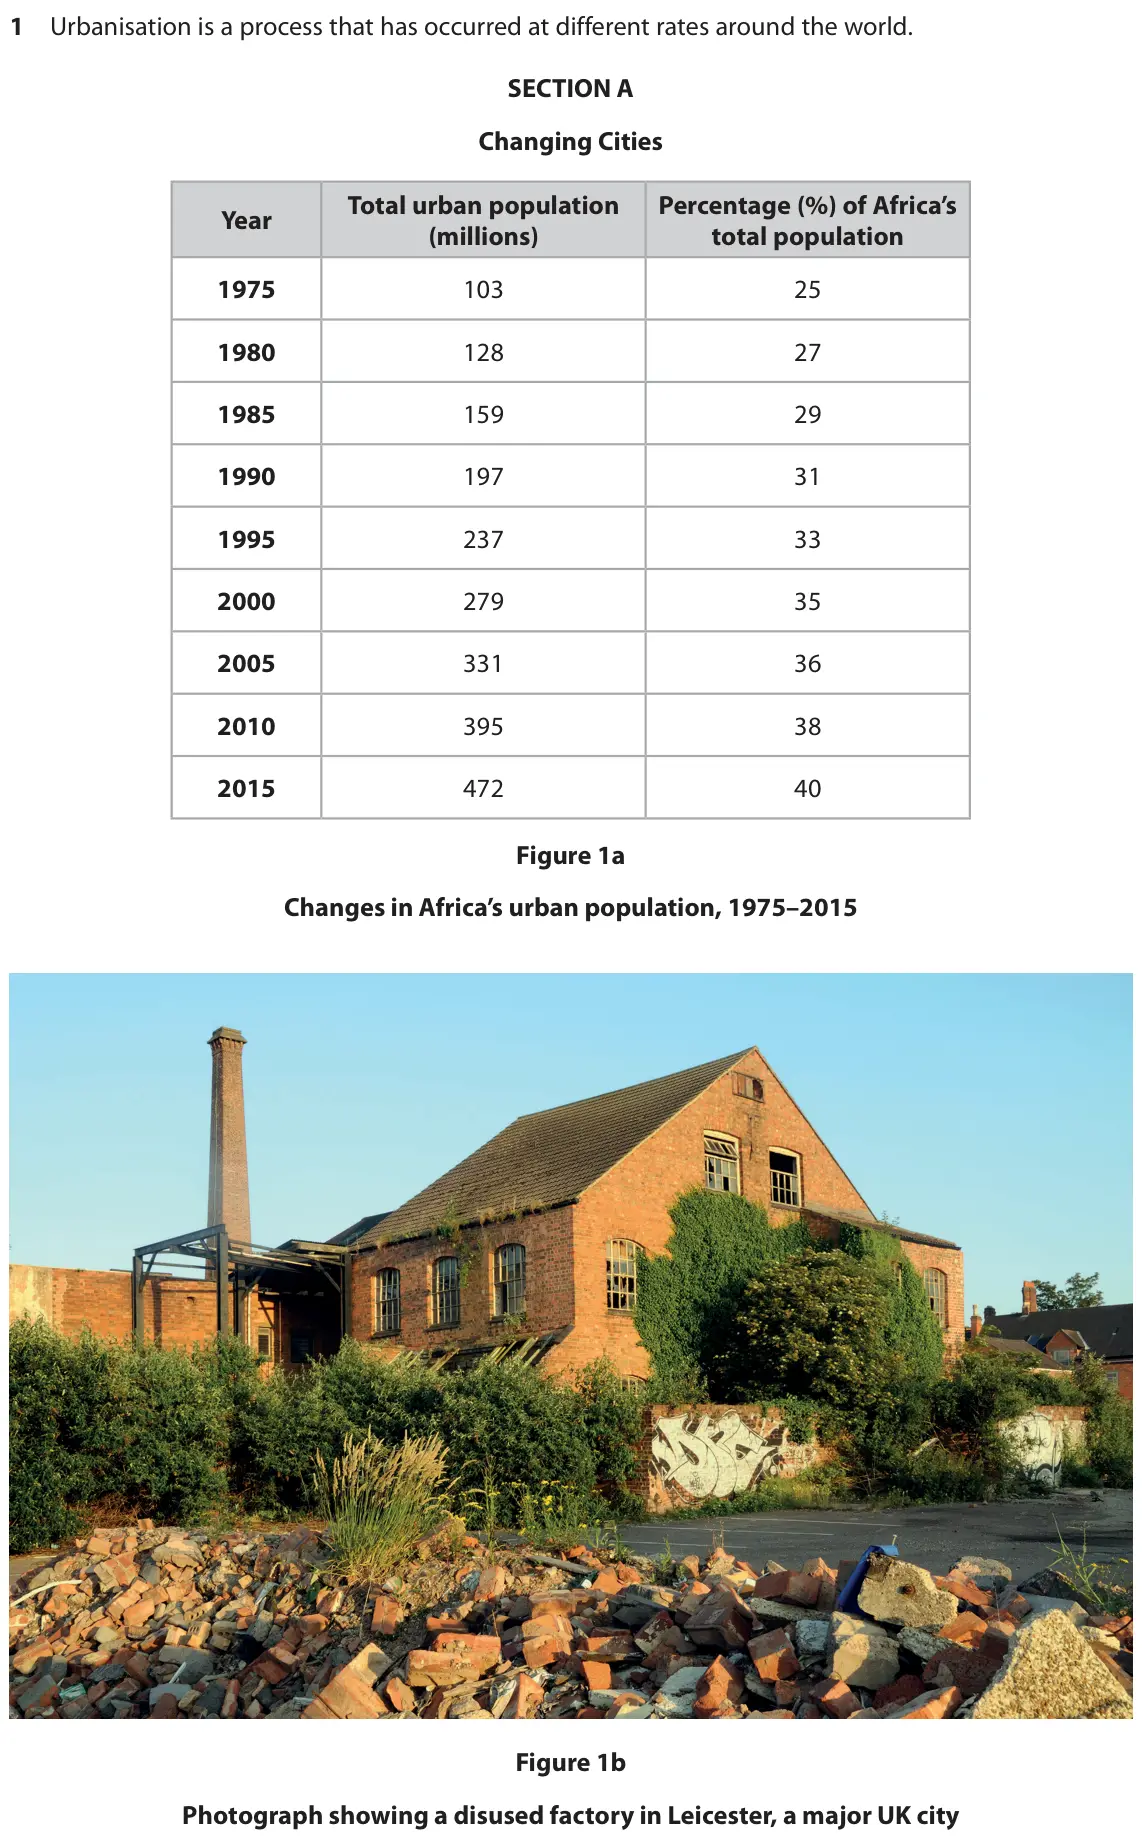 (Total for Question 1 is 2 marks)
Q1(a)(i)
The whole paper ↗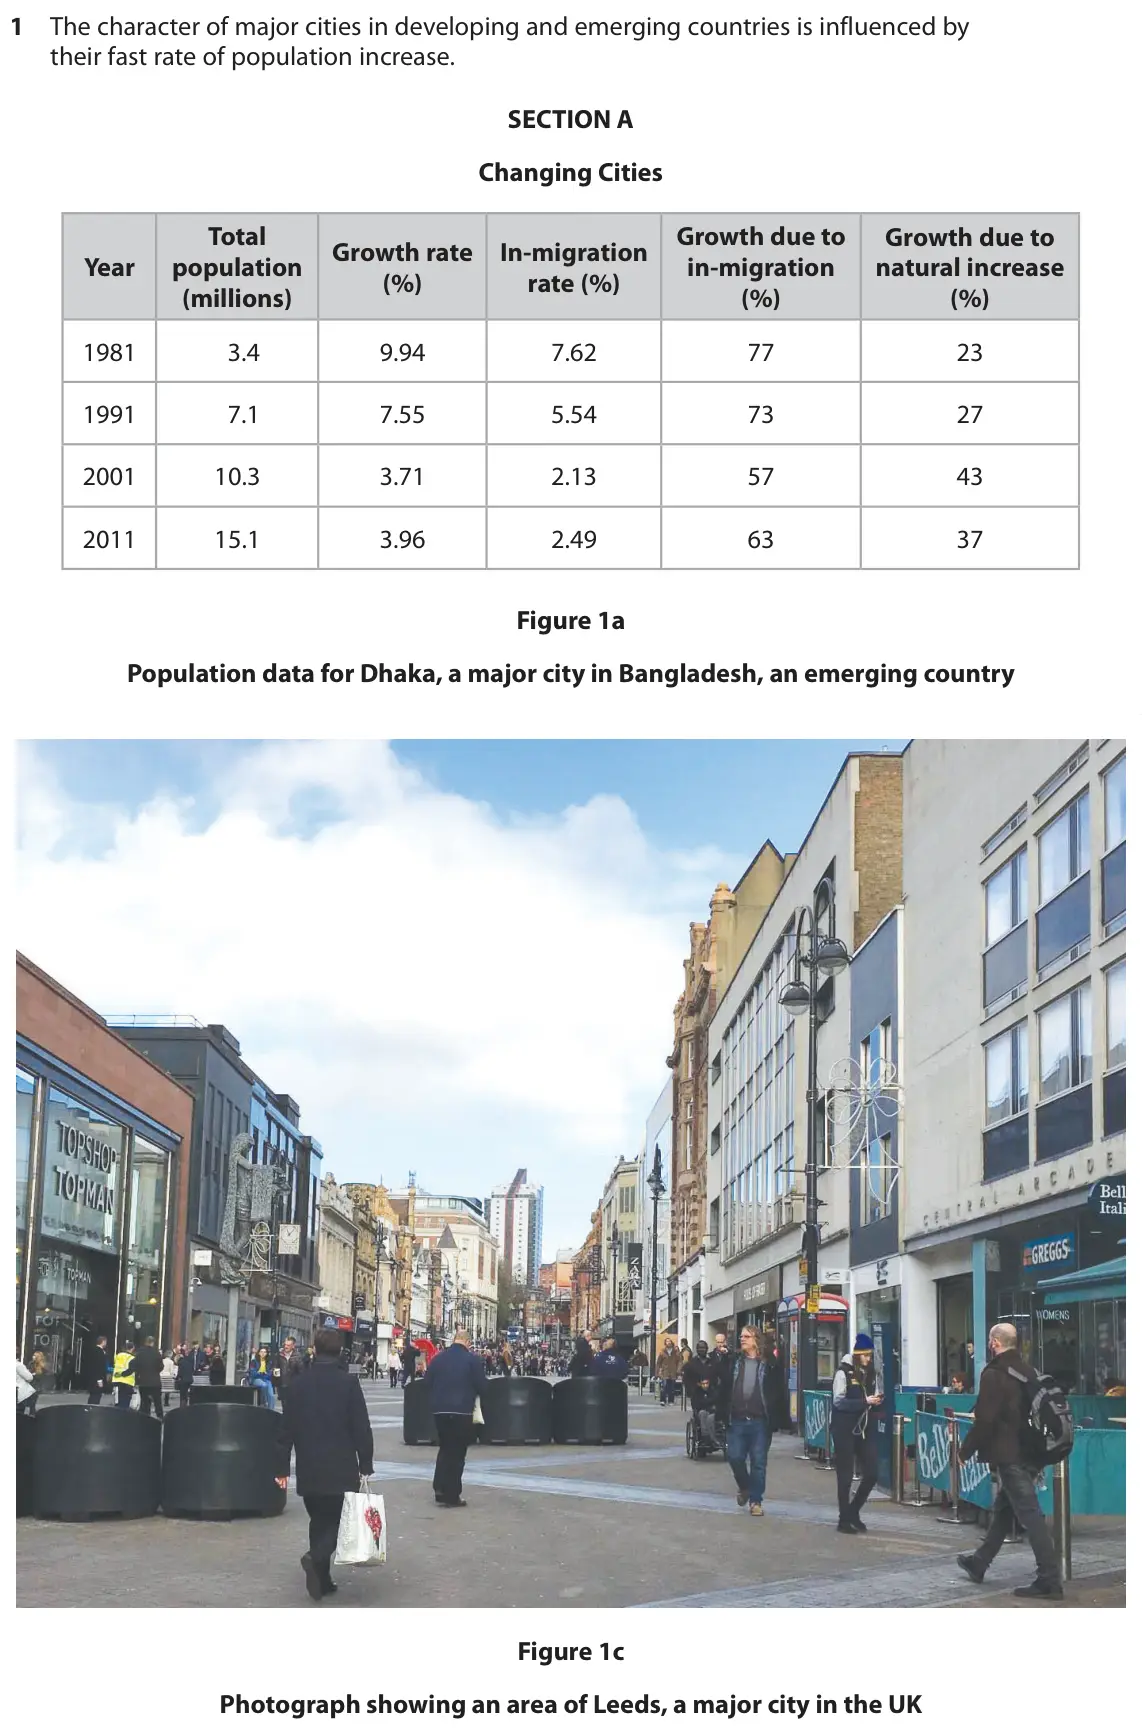 (Total for Question 1 is 1 mark)
Q1(a)(ii)
The whole paper ↗(Total for Question 1 is 2 marks)
Q1(a)(iii)
The whole paper ↗(Total for Question 1 is 2 marks)
Q1(f)(i)
The whole paper ↗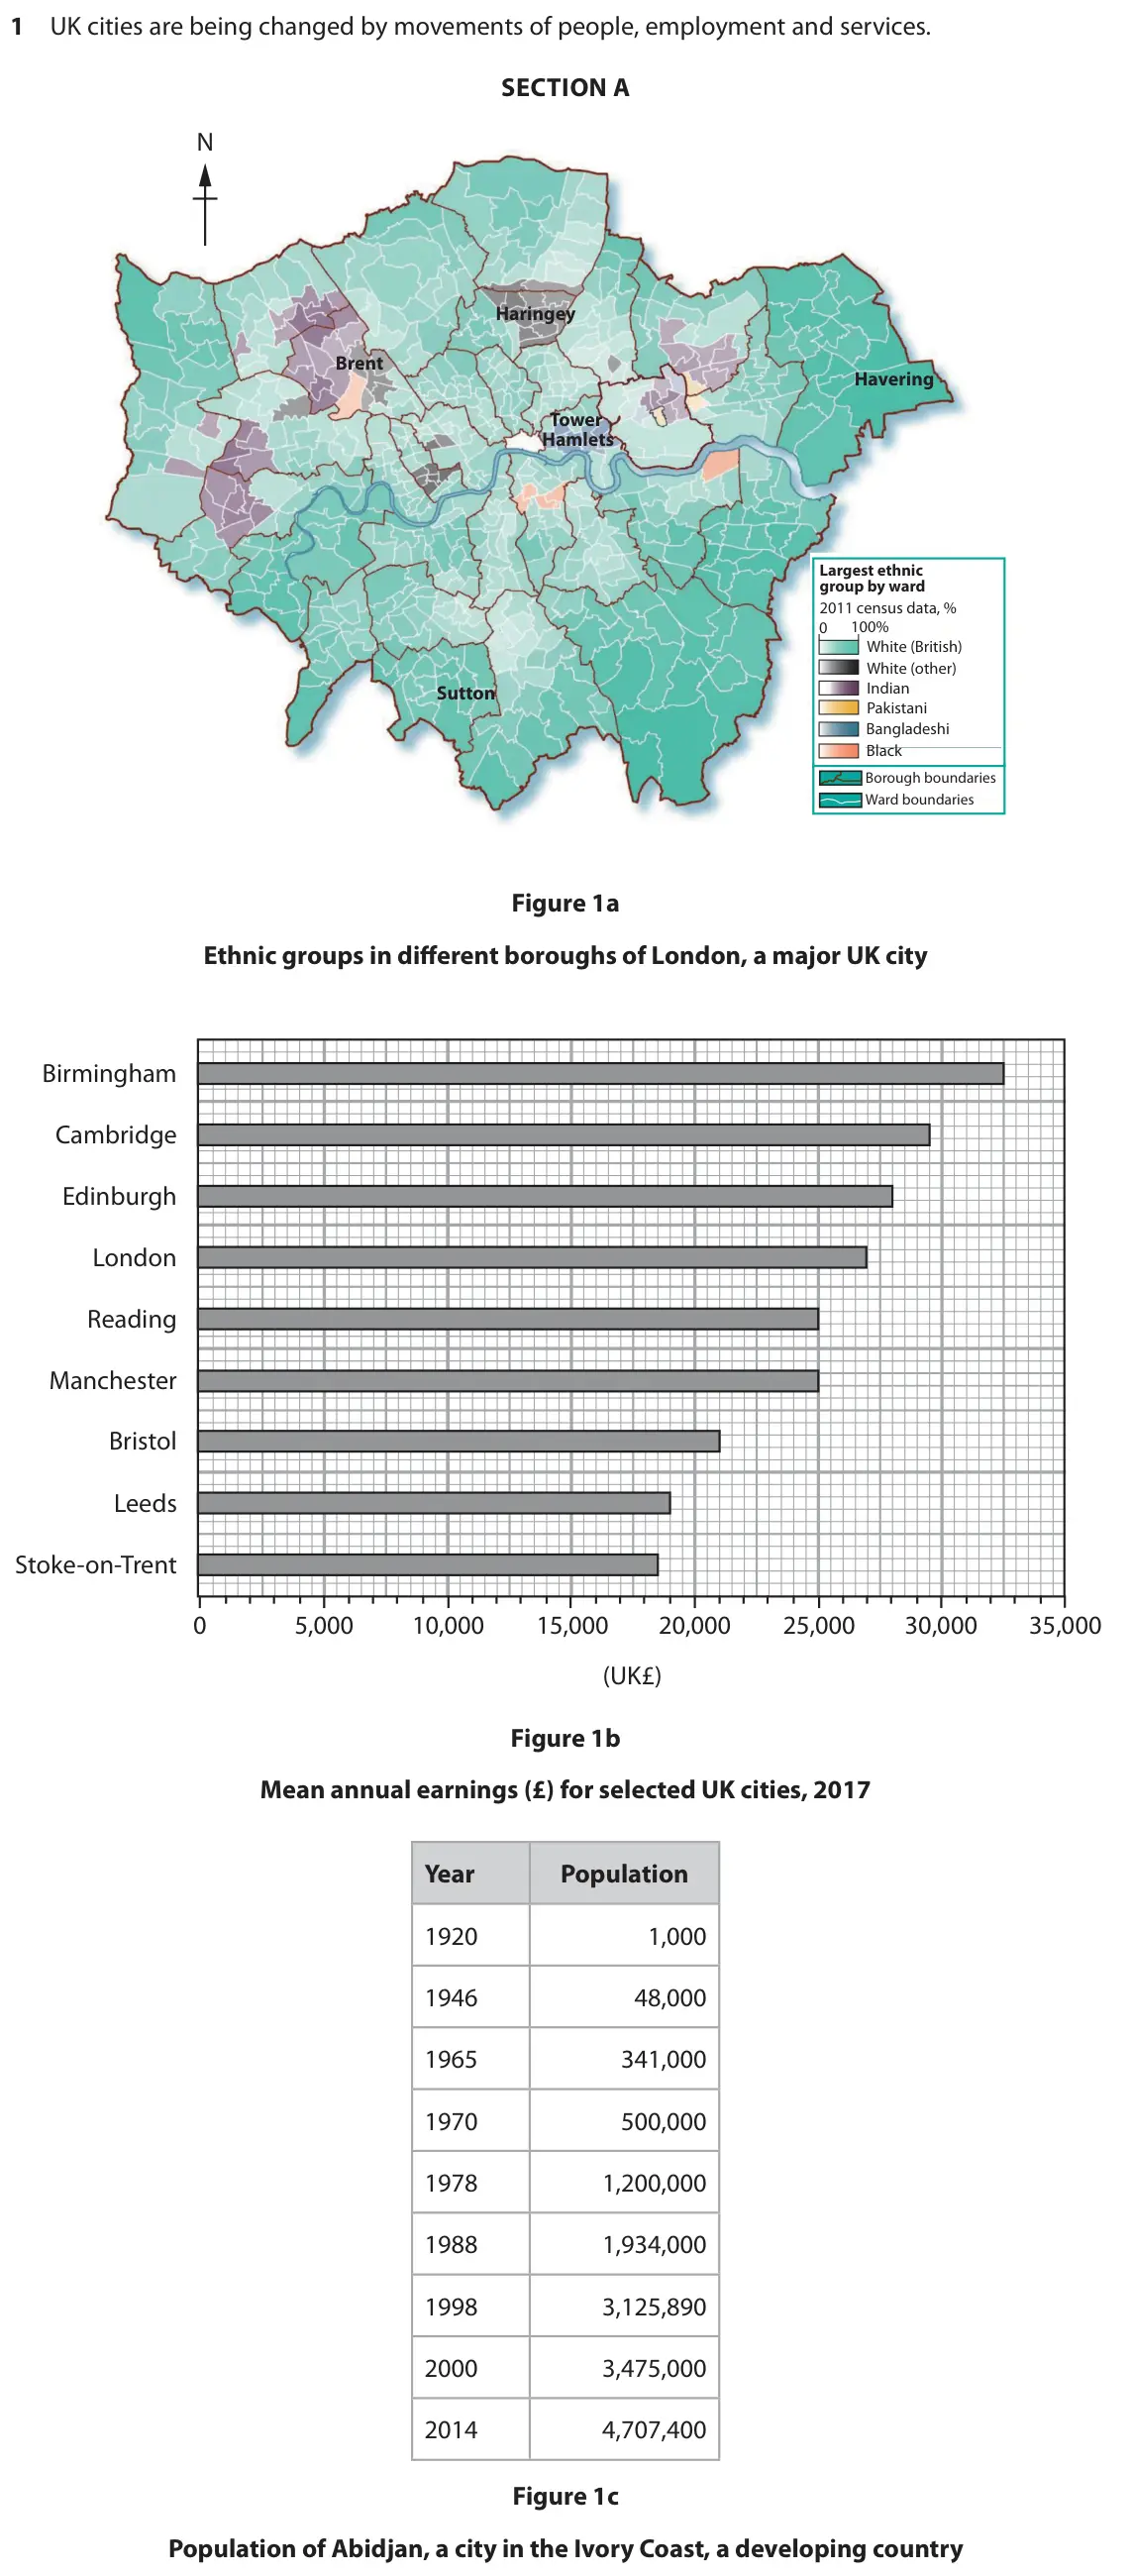 (Total for Question 1 is 1 mark)
- (Total for Question 1 is 2 marks)

How many marks did you get?
Q1(f)(iii)
The whole paper ↗(Total for Question 1 is 4 marks)
Q1(e)(i)
The whole paper ↗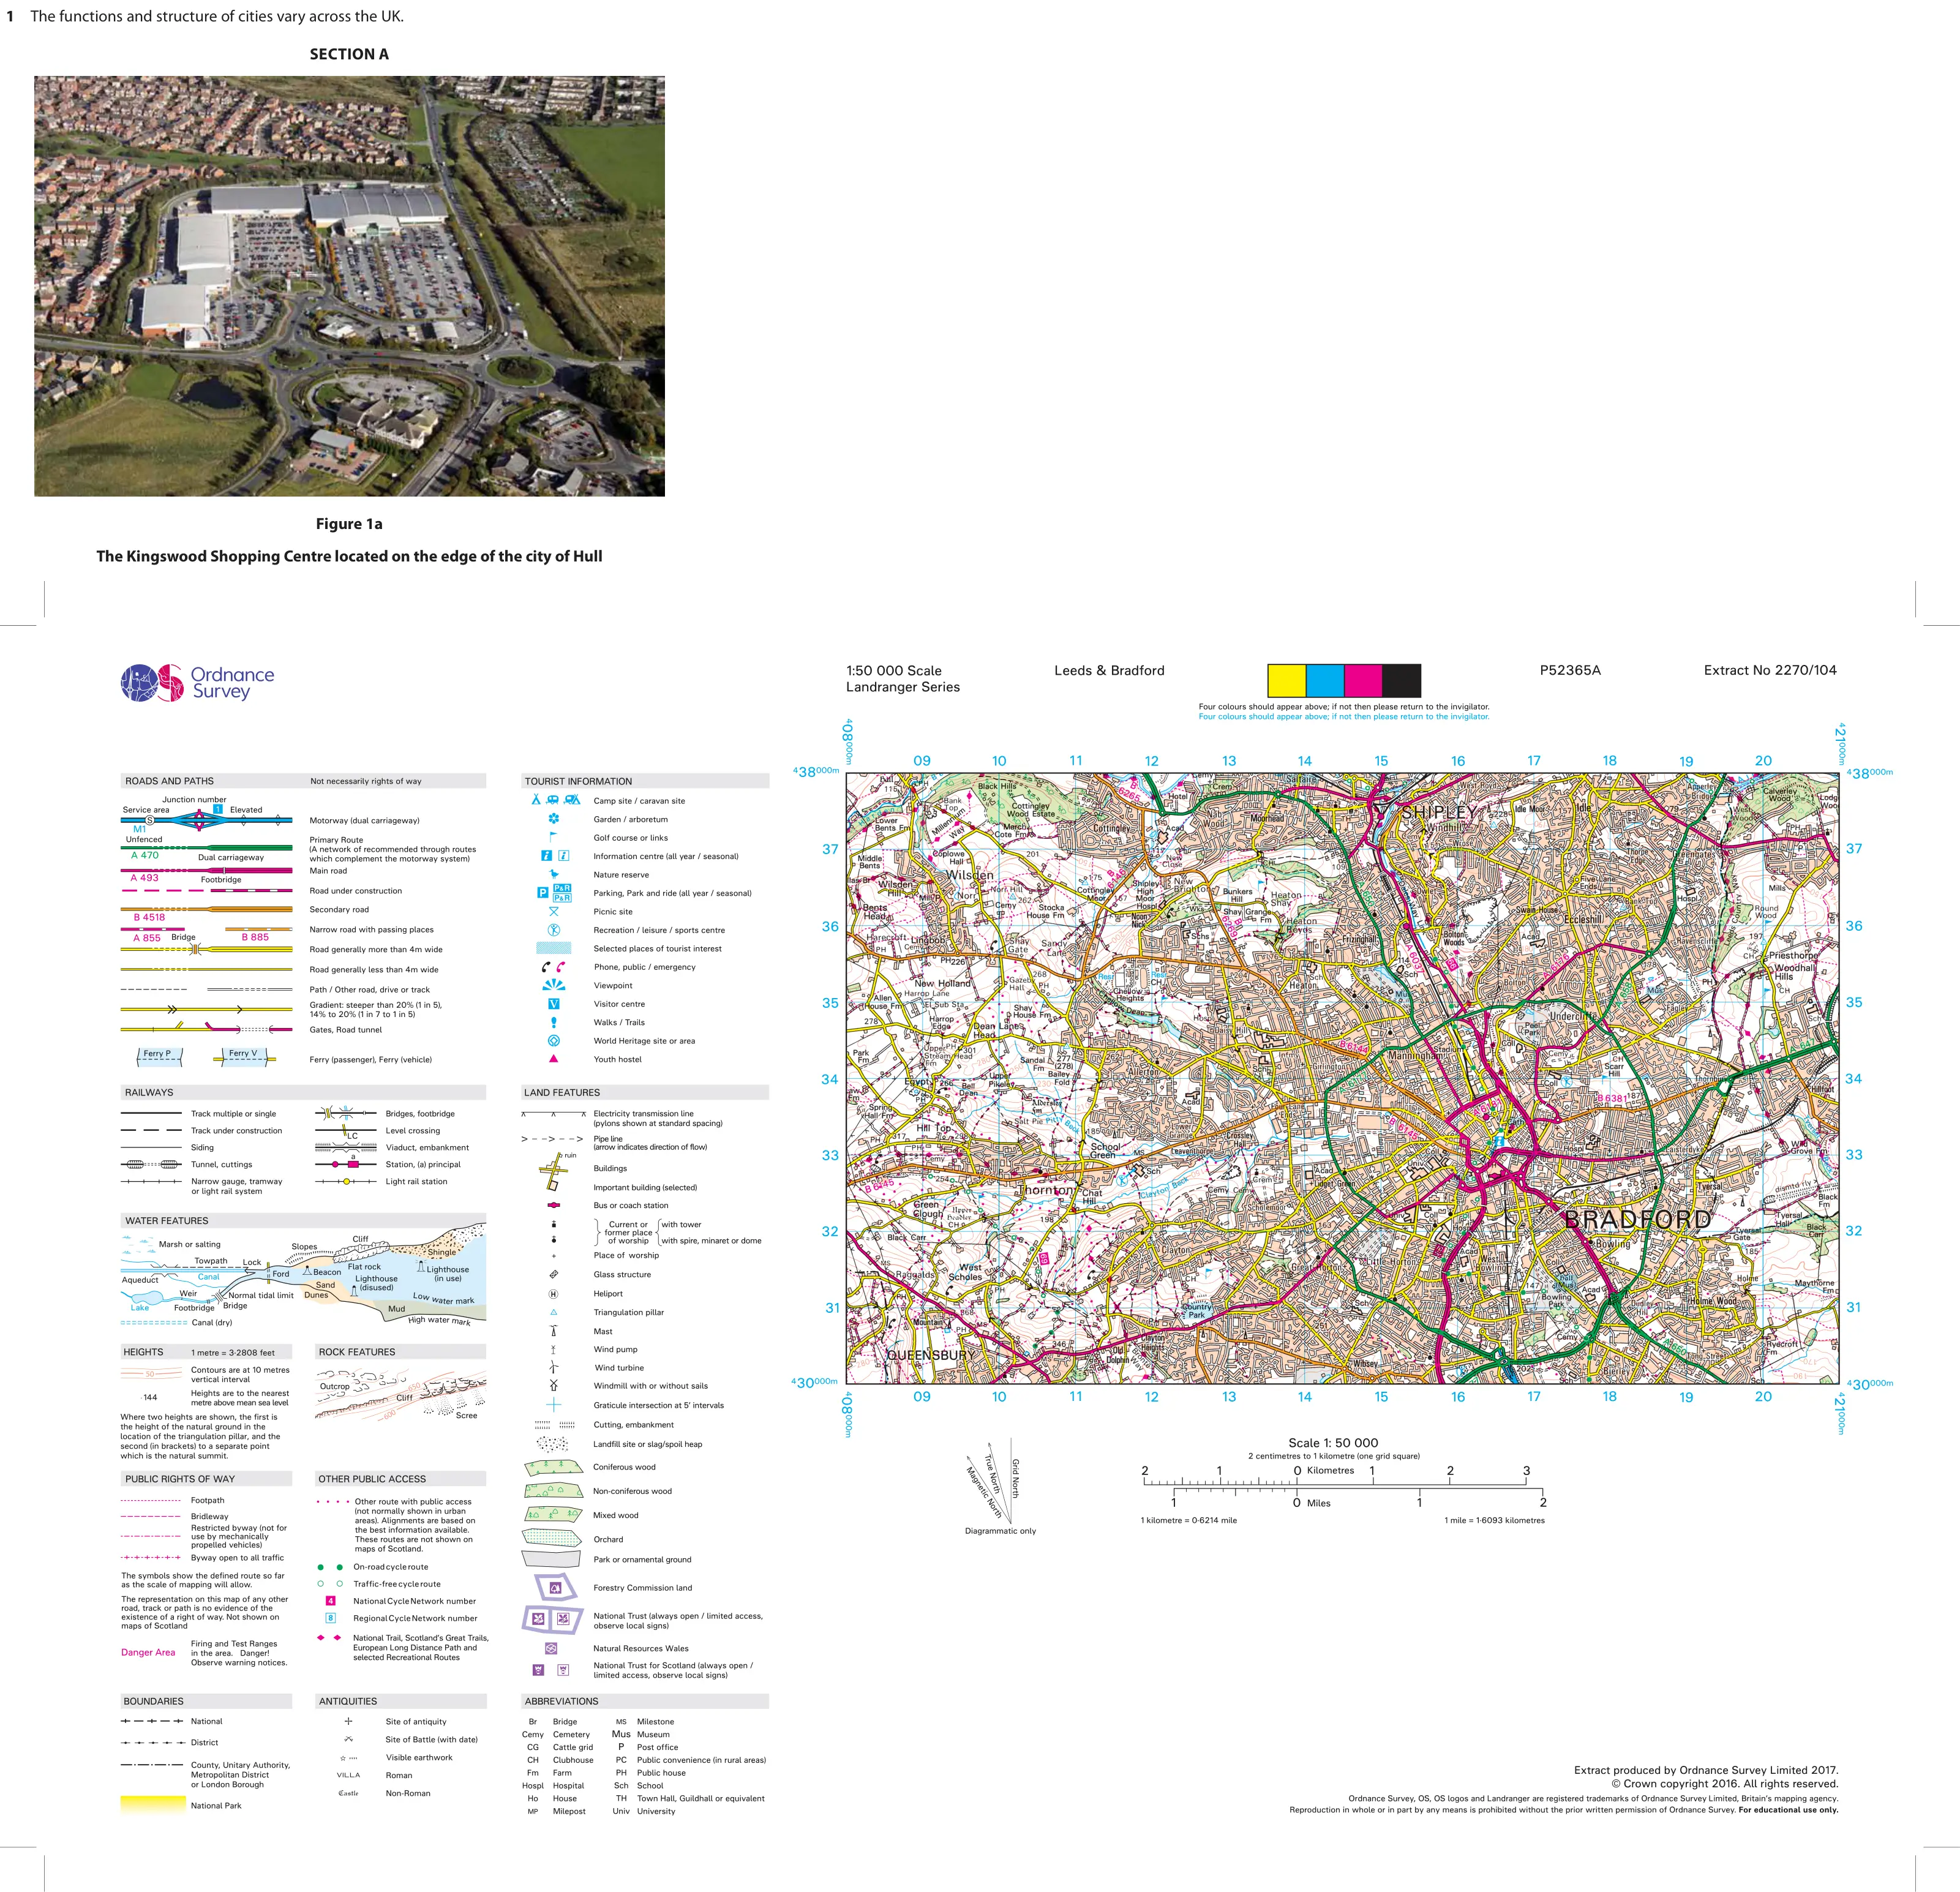 (Total for Question 1 is 2 marks)
Q1(e)(ii)
The whole paper ↗(Total for Question 1 is 1 mark)
Q1(e)(iii)
The whole paper ↗(Total for Question 1 is 1 mark)
All 17 questions on The character of the chosen developing country or emerging country city is influenced by its fast rate of growth, as a list
- June 2025, Paper 2, Q1(c)(i) (2 marks): State two reasons for migration to cities in developing/emerging countries. (2) Figure 1b Information about sustainable transport strategies in two UK cities N
- June 2025, Paper 2, Q1(c)(ii) (4 marks): Explain two reasons why the rate of natural population increase is high in many cities in developing/emerging countries. (4) Figure 1b Information about sustain
- June 2025, Paper 2, Q1(f)(ii) (8 marks): Evaluate the view that the rapid growth of this city has created more problems than benefits. (8) Figure 1b Information about sustainable transport strategies i
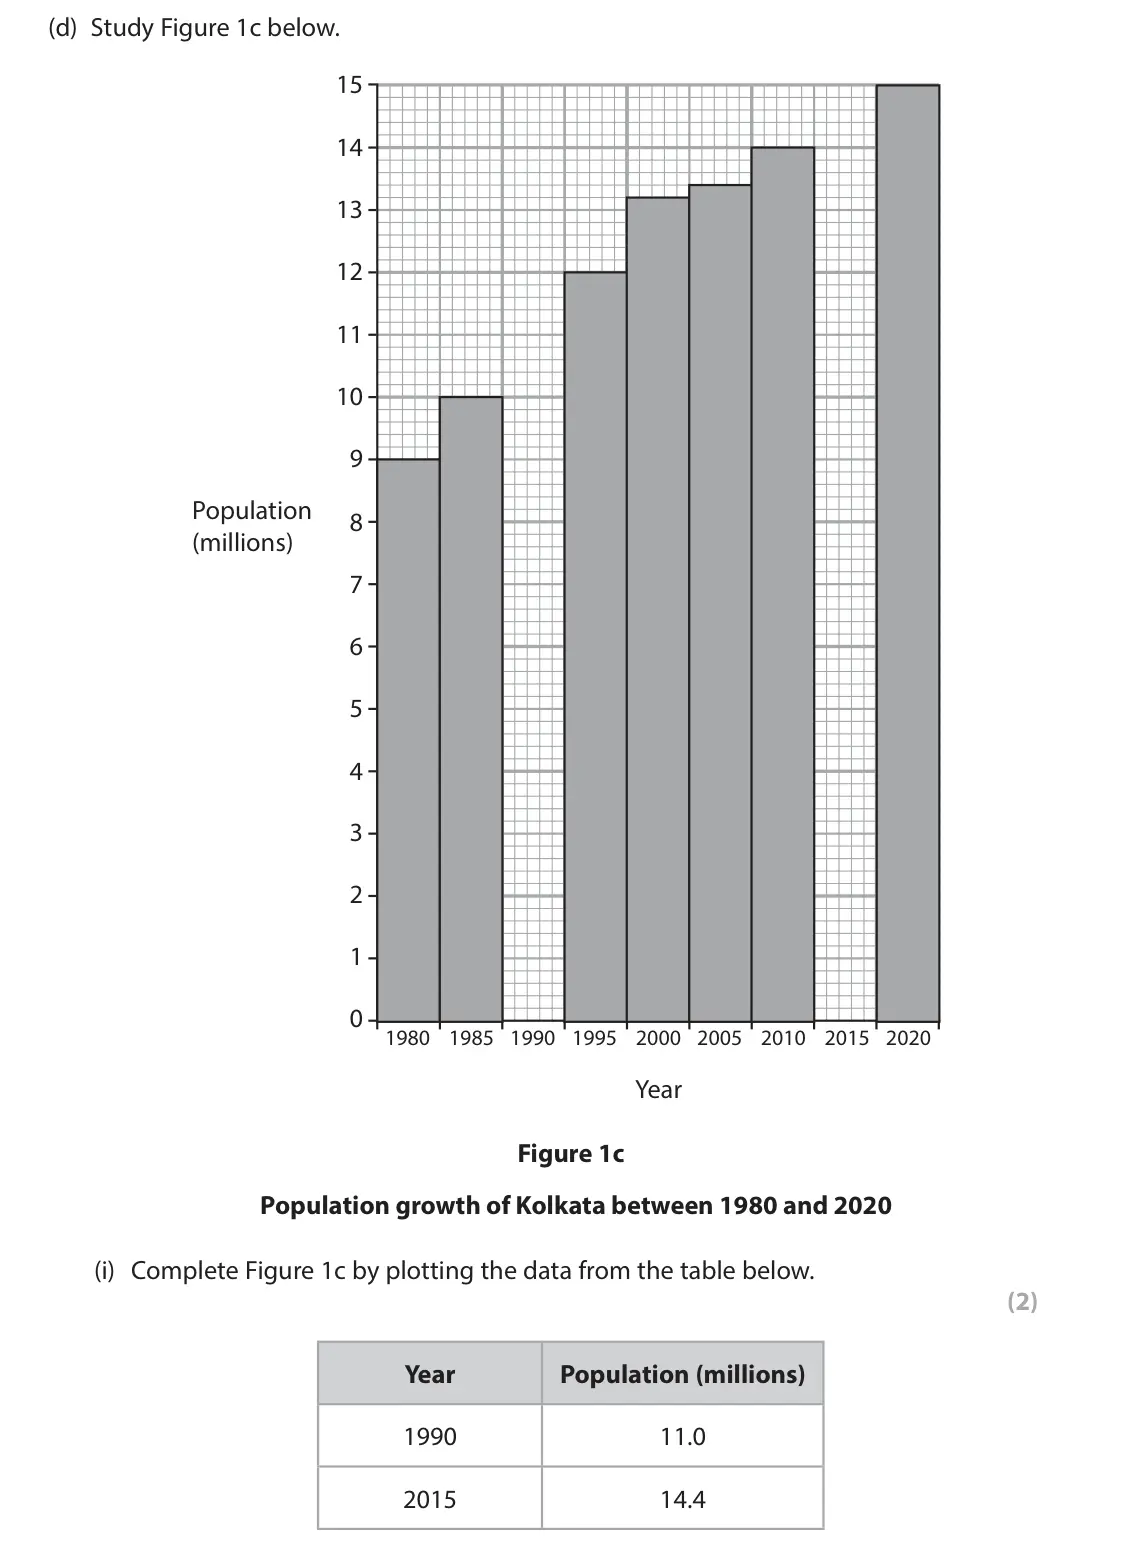
- June 2023, Paper 2, Q1(d)(i) (2 marks): Complete Figure 1c by plotting the data from the table below. (2) Year Population (millions) 1990 11.0 2015 14.4 1 The causes and effects of urbanisation can va
- June 2023, Paper 2, Q1(d)(ii) (1 mark): Identify the period when Kolkata’s population increased by 1.2 million. (1) A 1980 to 1985 B 1995 to 2000 C 2000 to 2005 D 2005 to 2010 1 The causes and effects
- June 2023, Paper 2, Q1(d)(iii) (2 marks): Calculate the percentage increase in the population of Kolkata between 1980 and 2020. Write your answer to one decimal place. You must show your working in the
- June 2023, Paper 2, Q1(e)(ii) (4 marks): Suggest two reasons why Kolkata has had rapid population growth. You must use evidence from Figure 1d in your answer. (4) 1 The causes and effects of urbanisati
- November 2021, Paper 2, Q1(g)(i) (2 marks): Complete Figure 1c by plotting the data below. Year Population (millions) 2005 1.3 2010 1.5 (2) 1 Urbanisation is a process that has occurred at different rates
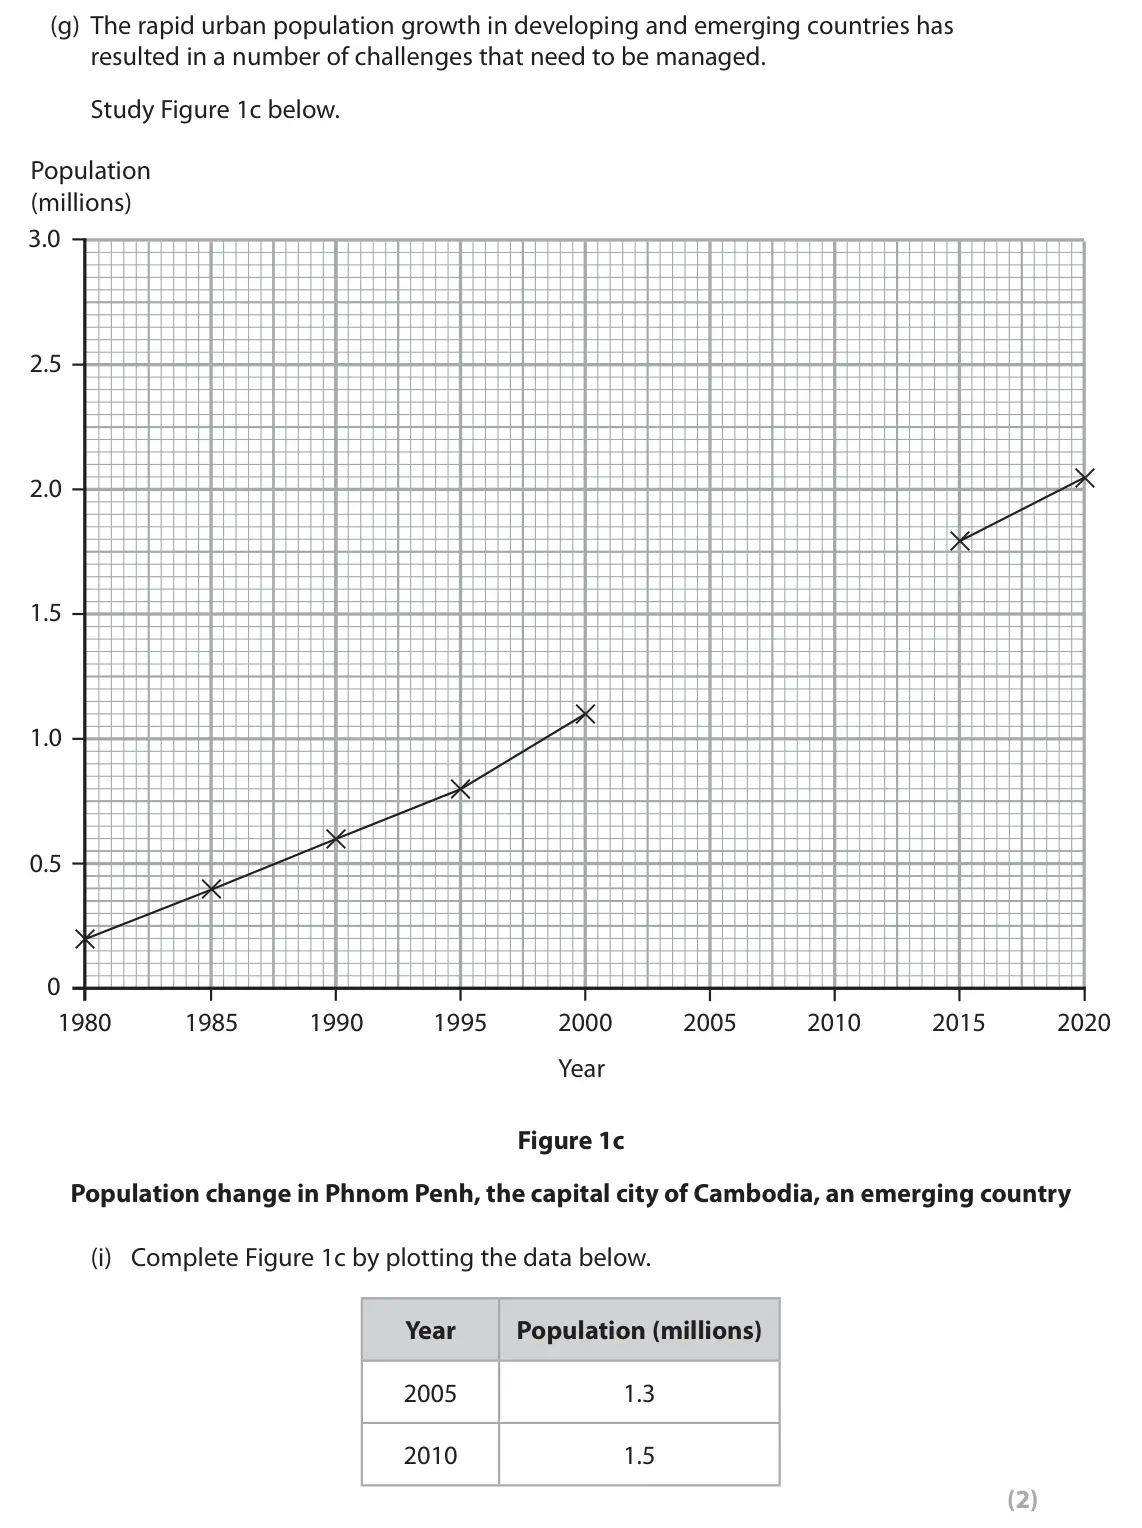
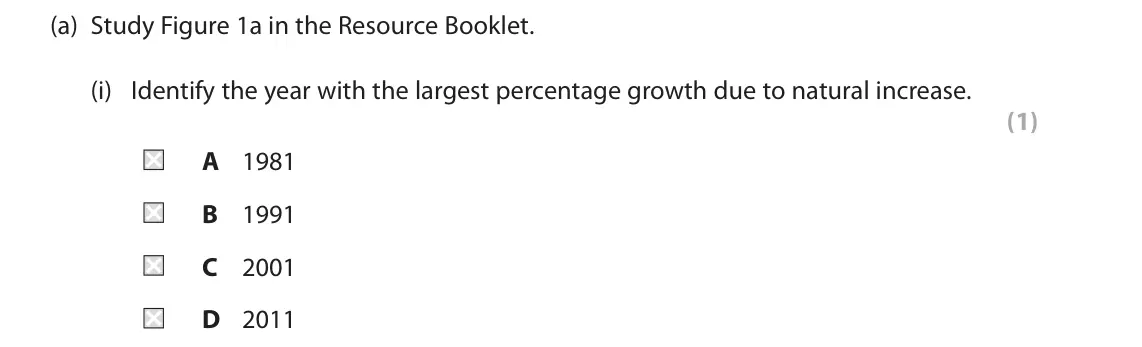
- November 2020, Paper 2, Q1(a)(i) (1 mark): Identify the year with the largest percentage growth due to natural increase. (1) A 1981 B 1991 C 2001 D 2011 1 The character of major cities in developing and
- November 2020, Paper 2, Q1(a)(ii) (2 marks): Describe the overall change in Dhaka’s total population between 1981 and 2011. Use data in your answer. (2) 1 The character of major cities in developing and em
- November 2020, Paper 2, Q1(a)(iii) (2 marks): Calculate the mean in-migration rate for Dhaka between 1981 and 2011. Answer to two decimal places. You must show your workings in the space below. (2) 1 The ch
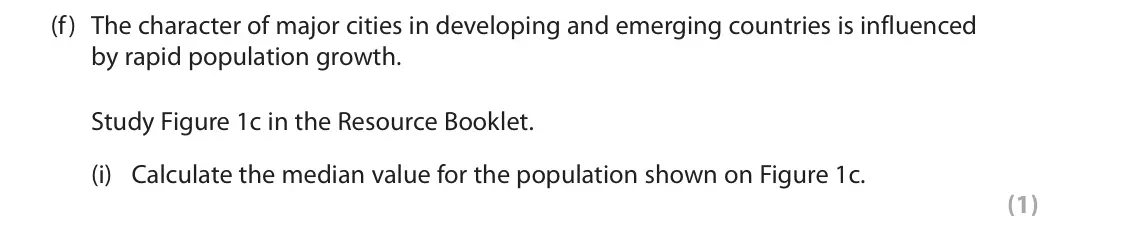
- June 2019, Paper 2, Q1(f)(i) (1 mark): Calculate the median value for the population shown on Figure 1c. (1) 1 UK cities are being changed by movements of people, employment and services. SECTION A N
- June 2019, Paper 2, Q1(f)(ii) (2 marks): Calculate the percentage increase in Abidjan’s population between 1988 and 2000. Answer to one decimal place. You must show your working in the space below. (2)
- June 2019, Paper 2, Q1(f)(iii) (4 marks): Explain two possible reasons for the rapid growth in Abidjan’s population. (4) 1 UK cities are being changed by movements of people, employment and services. SE
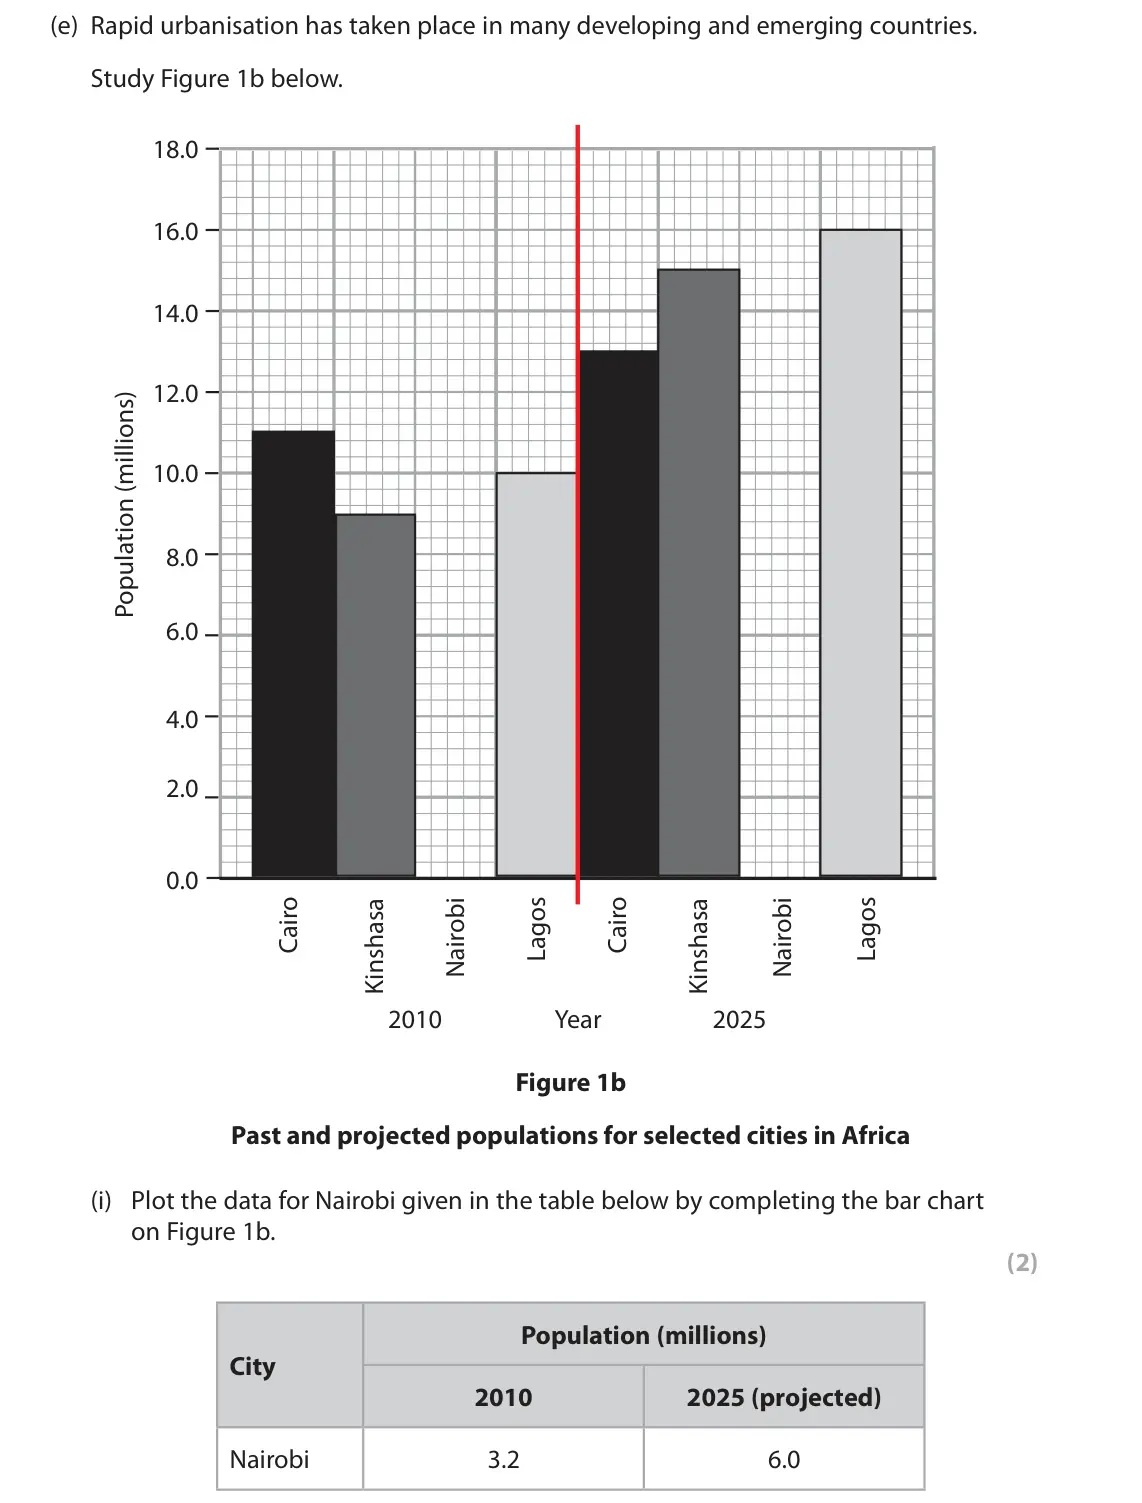
- June 2018, Paper 2, Q1(e)(i) (2 marks): Plot the data for Nairobi given in the table below by completing the bar chart on Figure 1b. (2) Population (millions) City 2010 2025 (projected) Nairobi 3.2 6.
- June 2018, Paper 2, Q1(e)(ii) (1 mark): Calculate the projected increase in Kinshasa’s population between 2010 and 2025. (1) 1 The functions and structure of cities vary across the UK. SECTION A Figur
- June 2018, Paper 2, Q1(e)(iii) (1 mark): State one possible reason for the trend shown on Figure 1b. (1) 1 The functions and structure of cities vary across the UK. SECTION A Figure 1a The Kingswood Sh
Questions, mark schemes and examiner’s reports are © Pearson Edexcel, from their published past papers. Plumi isn’t affiliated with any exam board. Want whole papers? Edexcel GCSE Geography A past papers.
The Plumi iPad app also offers exam-style questions with AI feedback on your handwritten working.