 plumi
Stars, distances and the H-R diagram: Edexcel A‑Level Physics questions
Every Edexcel A-Level Physics exam question on Stars, distances and the H-R diagram (specification points 156–160), 2016–2025, with its mark scheme and examiner’s report.
Find questions1,540
Calculations
Q21(d)
The whole paper ↗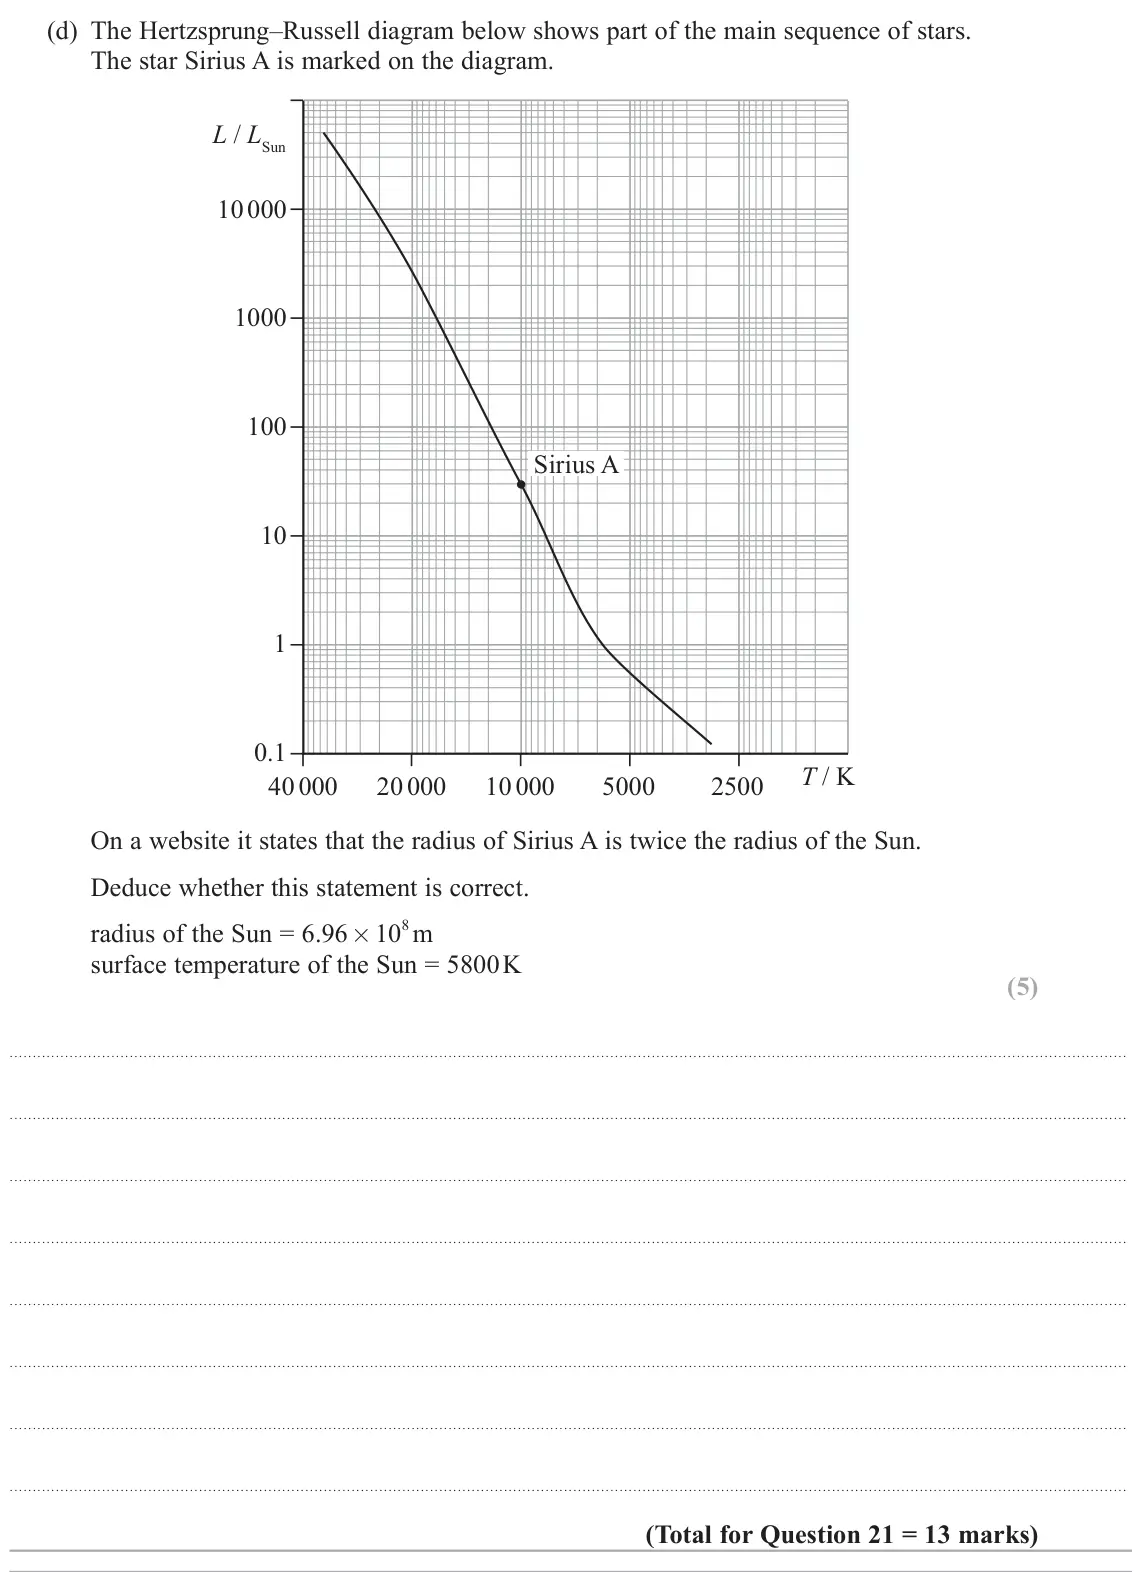
Q17(b)(iii)
The whole paper ↗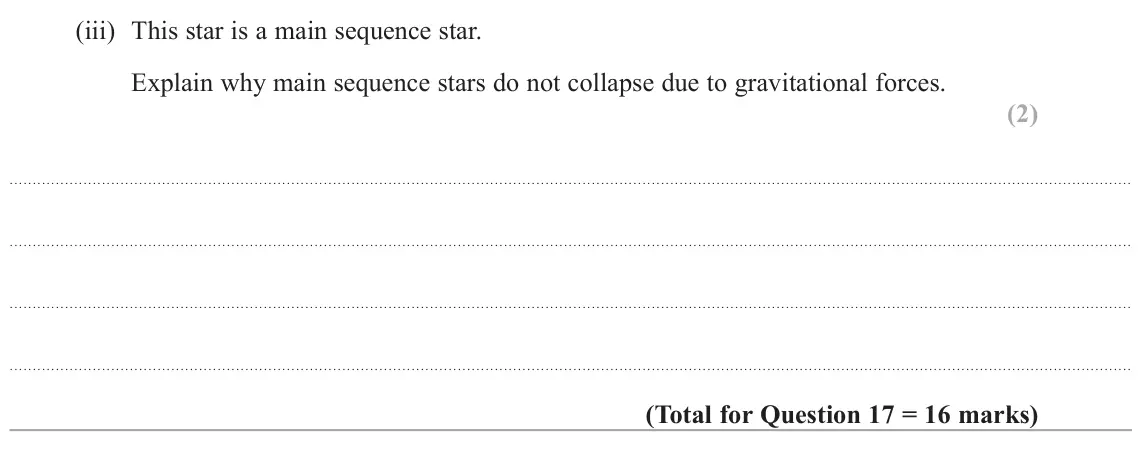
Q15(c)
The whole paper ↗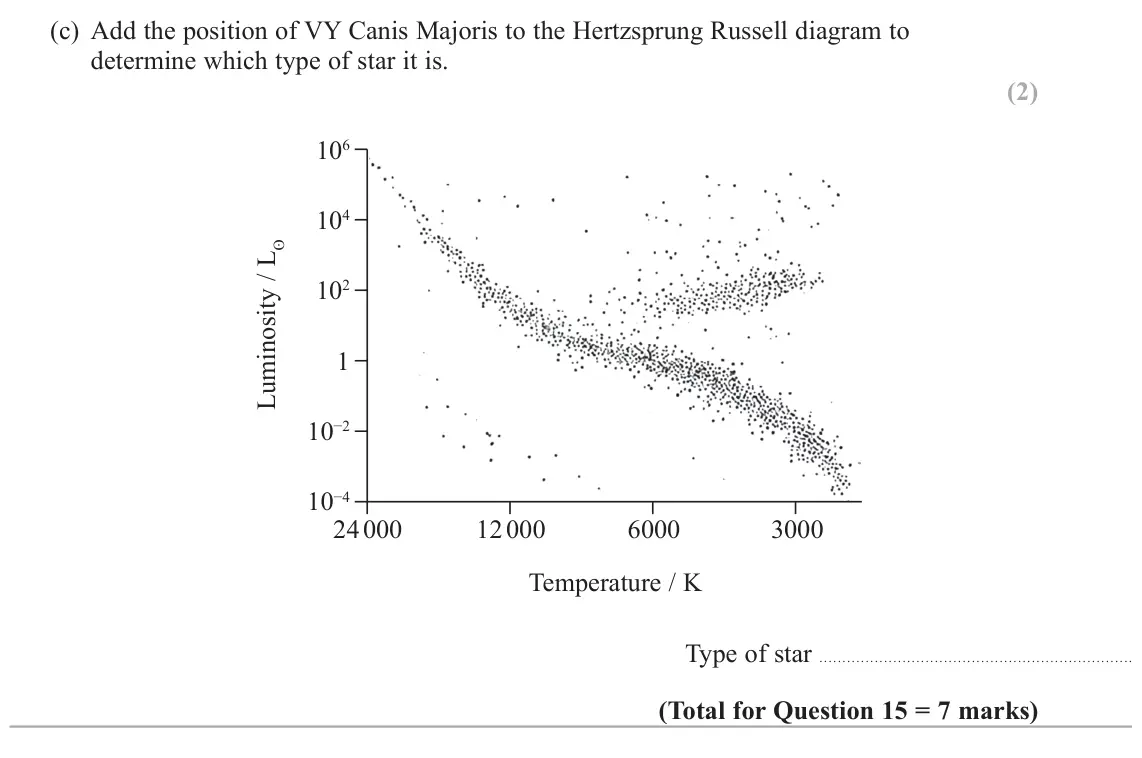
Q17(c)
The whole paper ↗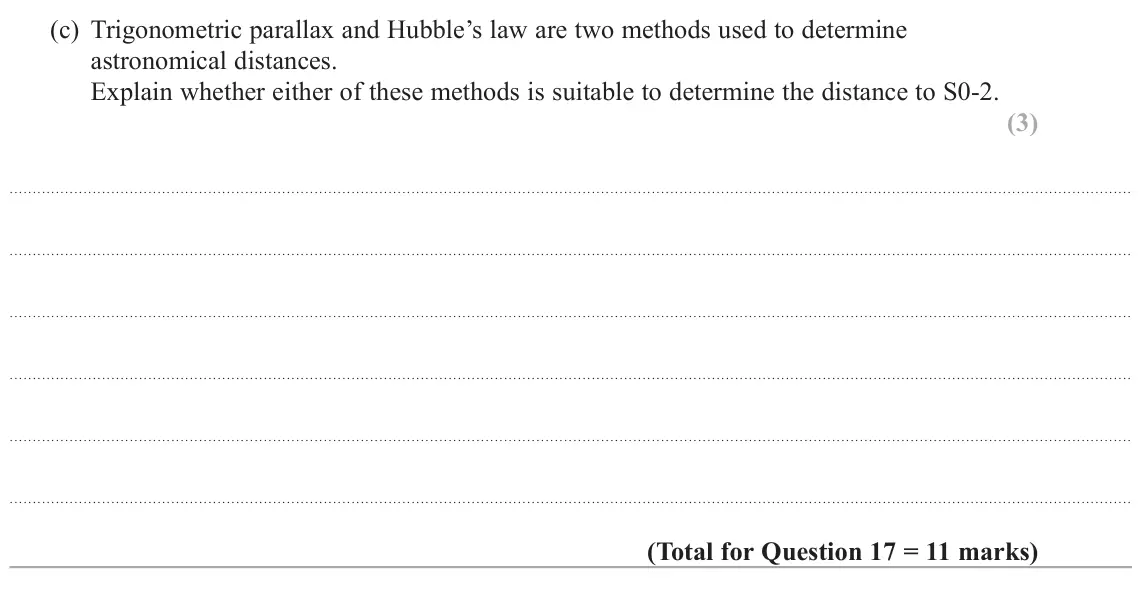
Q9(a)(i)
The whole paper ↗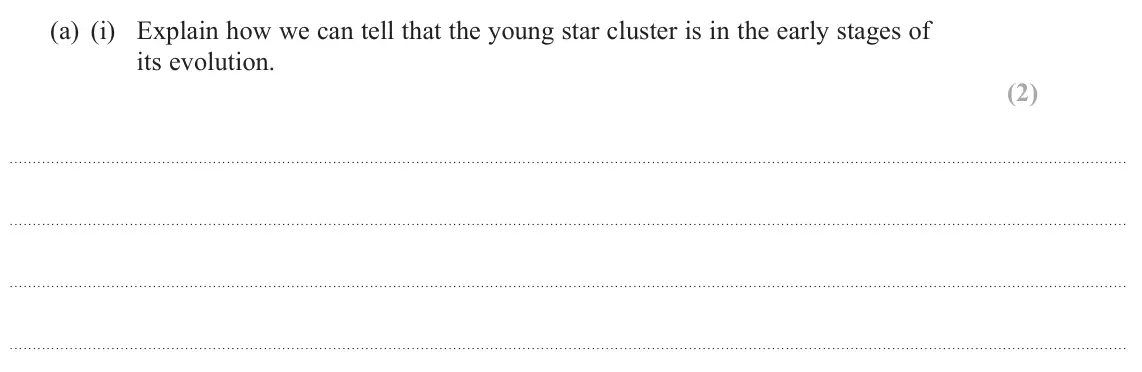
Q9(a)(ii)
The whole paper ↗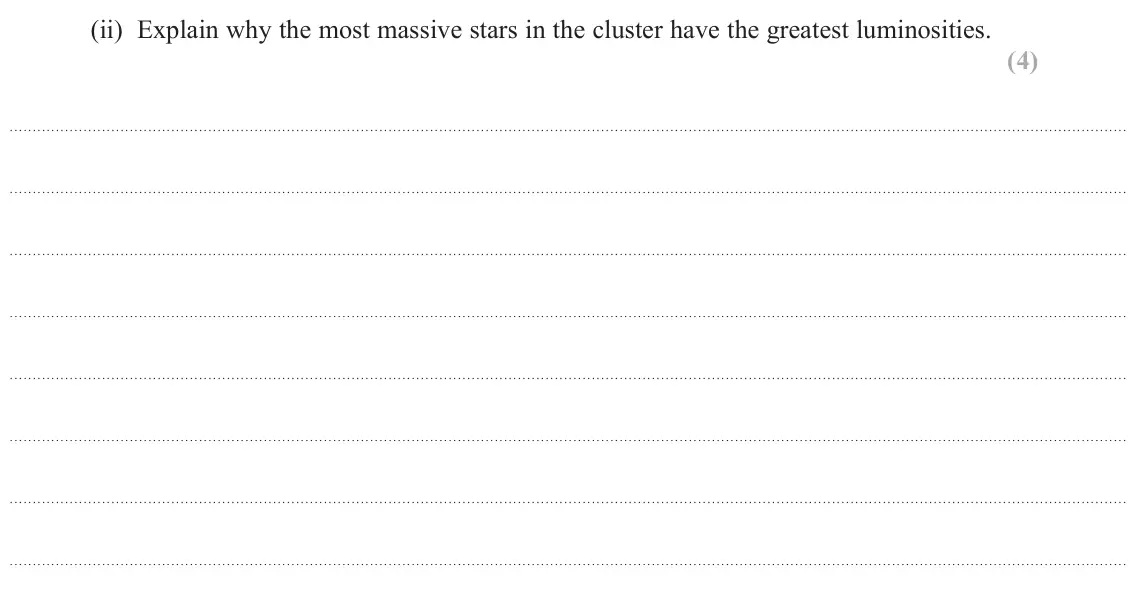
Q9(b)(i)
The whole paper ↗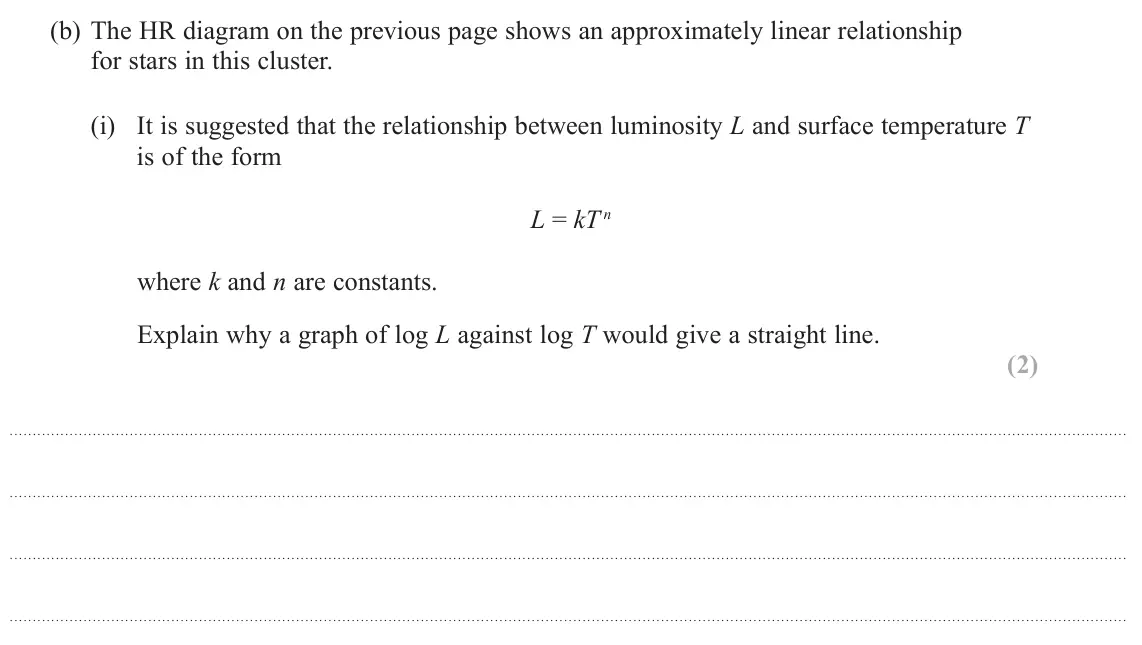
Q9(b)(ii)
The whole paper ↗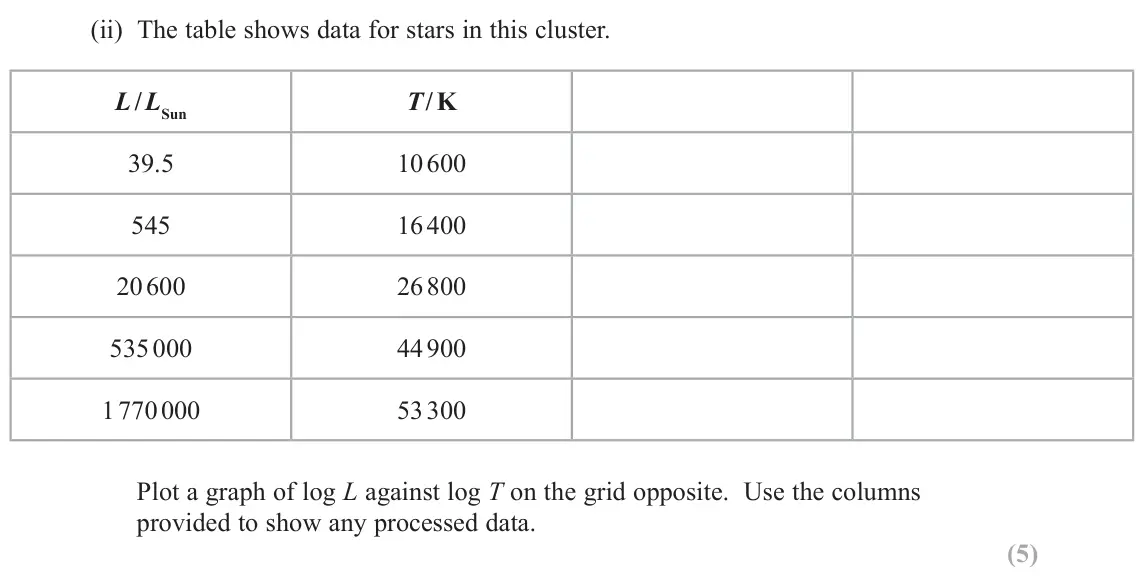
Q9(b)(iii)
The whole paper ↗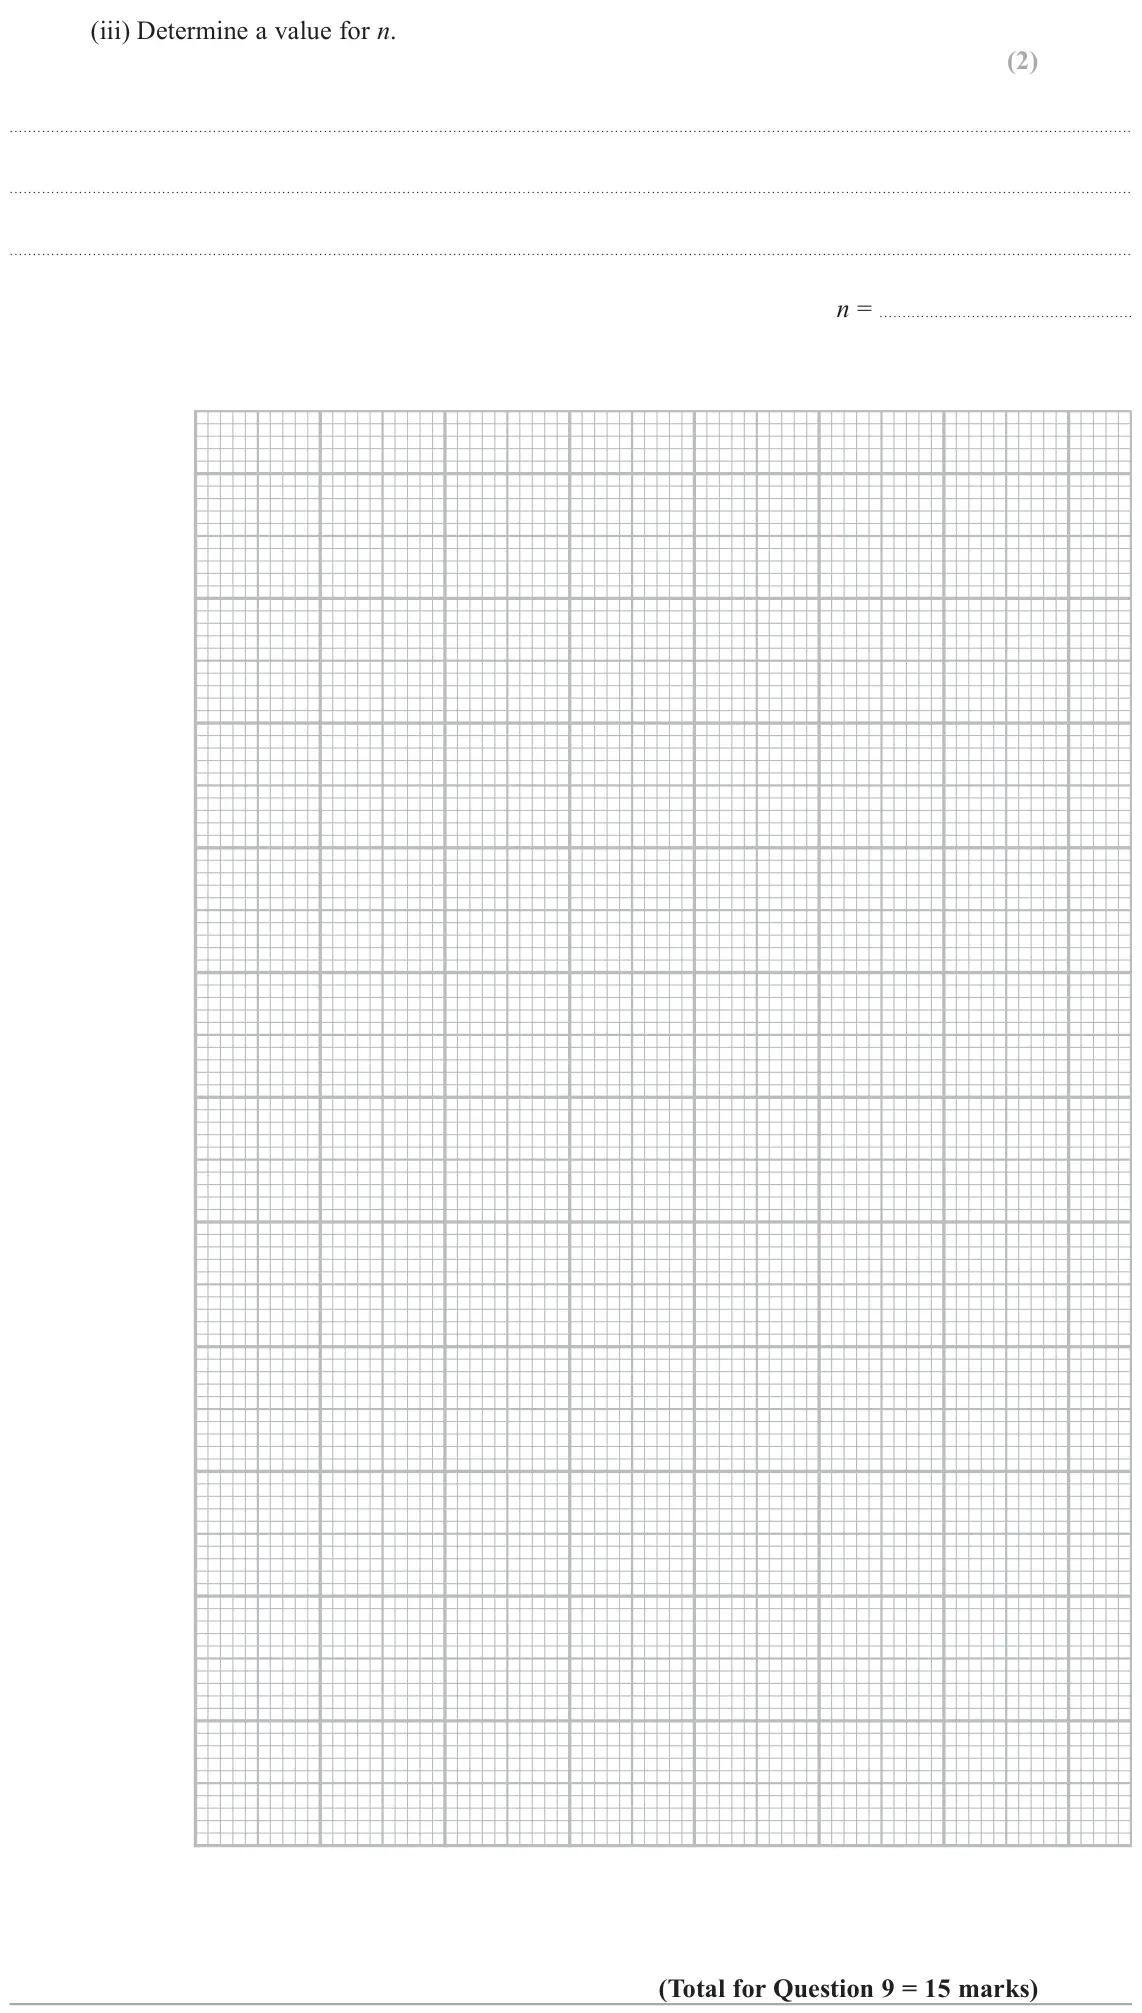
Q11(a)
The whole paper ↗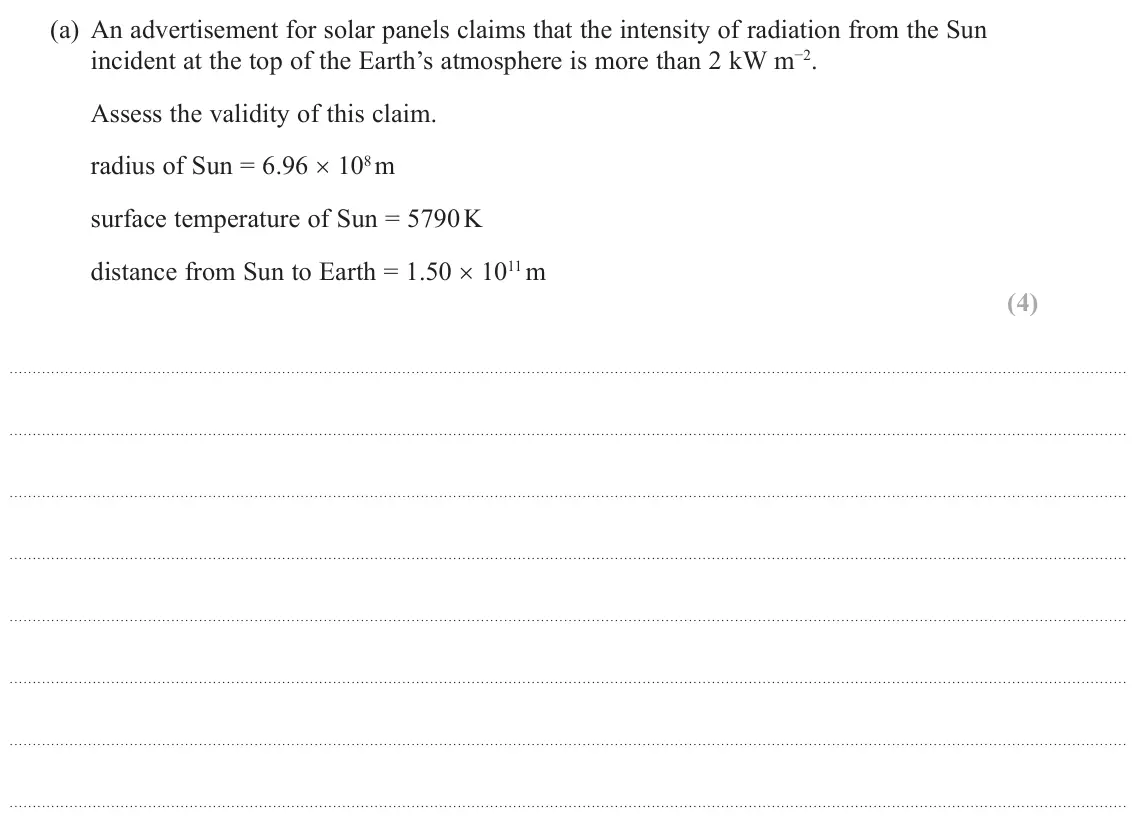
Q6(b)
The whole paper ↗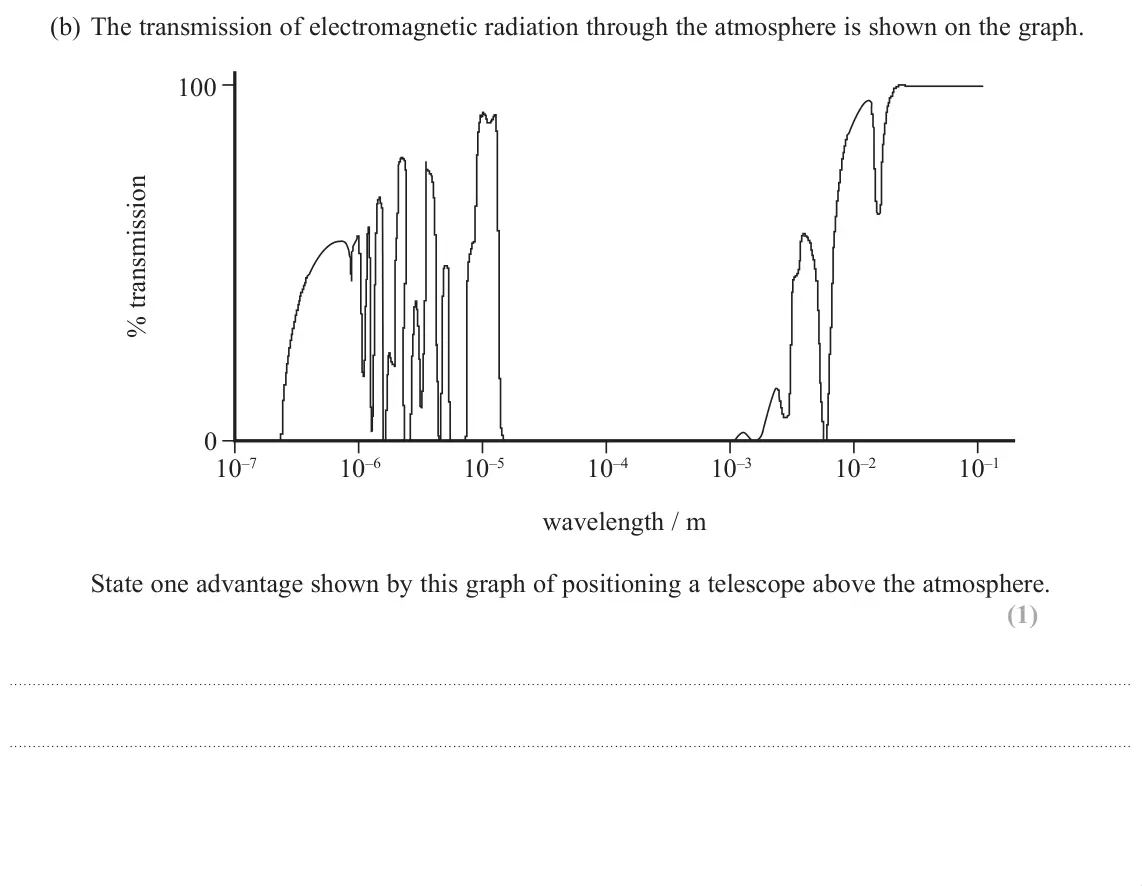
Q19(a)(i)
The whole paper ↗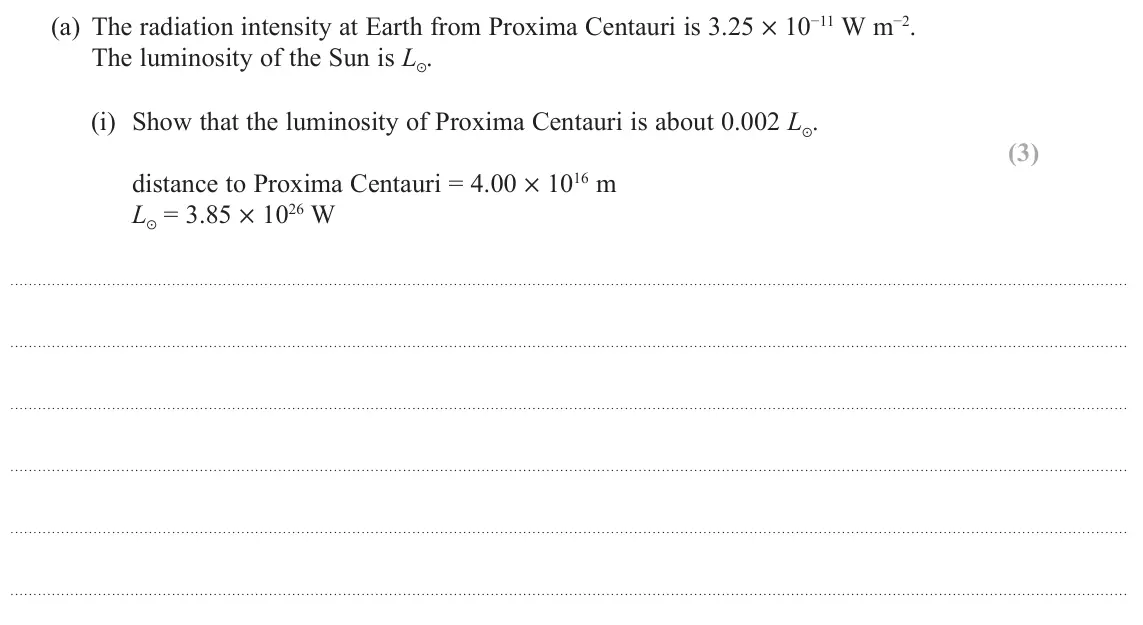
Q19(a)(ii)
The whole paper ↗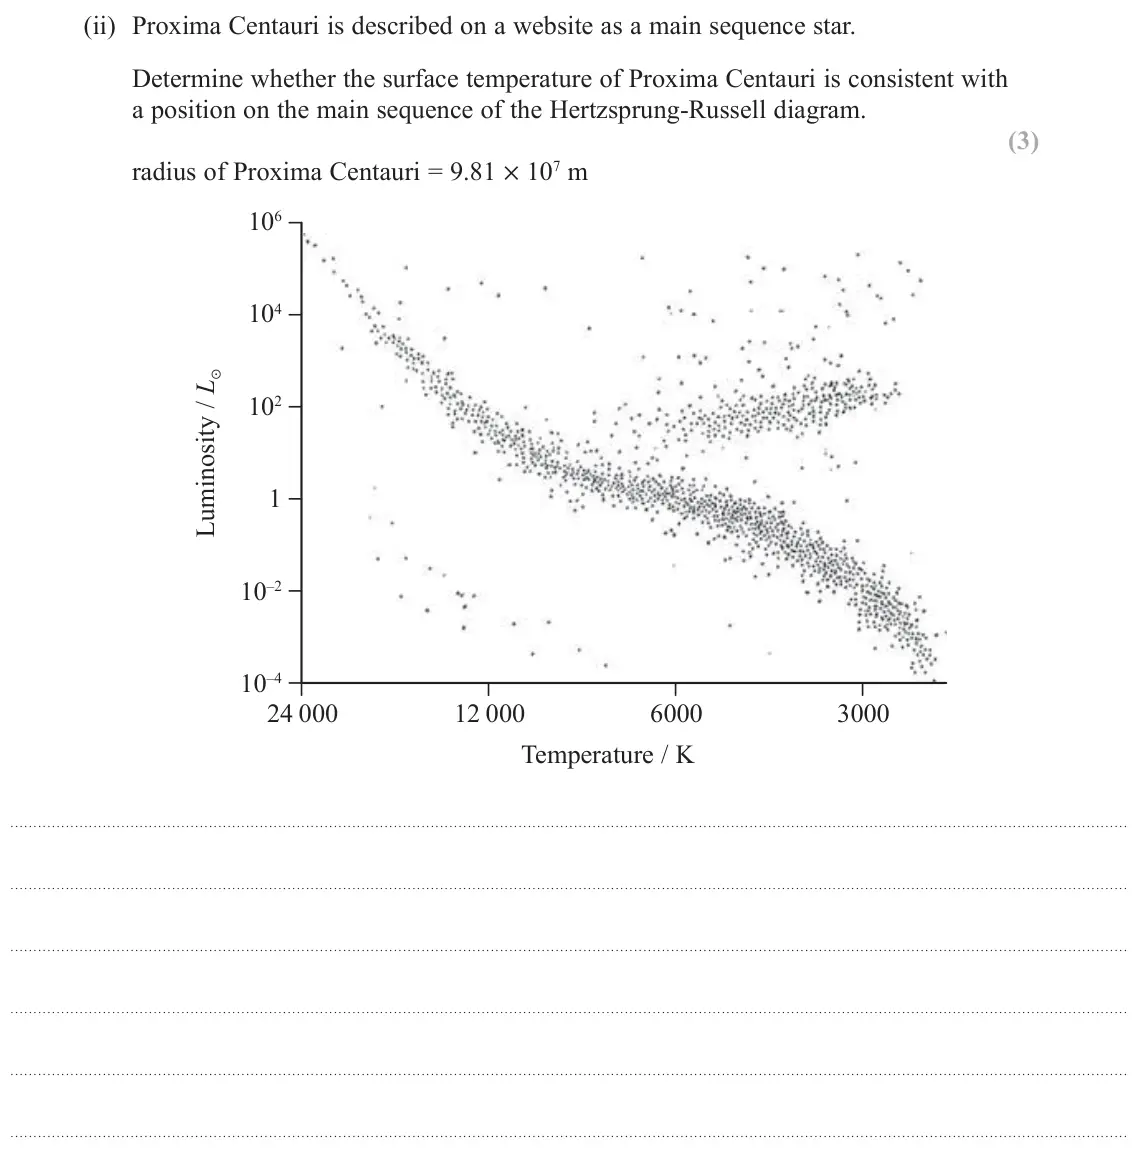
All 27 questions on Stars, distances and the H-R diagram, as a list
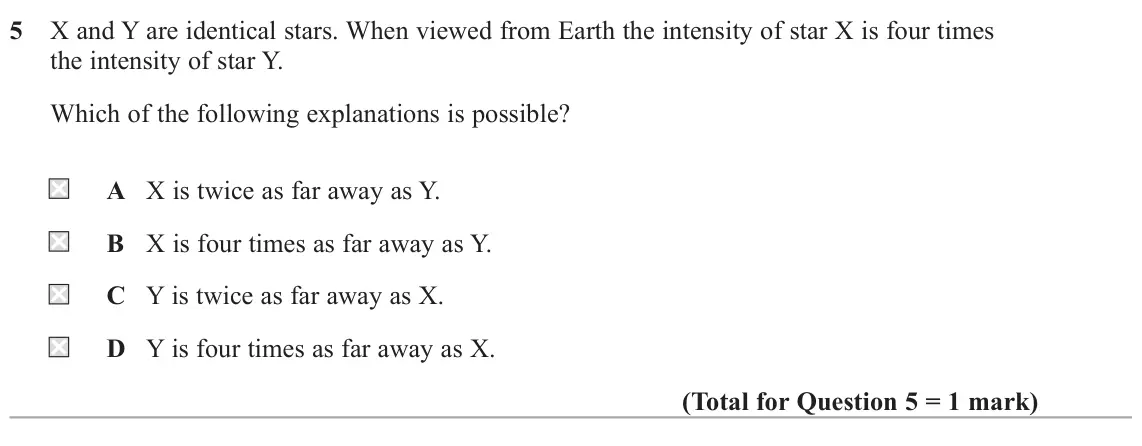
- June 2025, Paper 2, Q5 (1 mark): X and Y are identical stars. When viewed from Earth the intensity of star X is four times the intensity of star Y. Which of the following explanations is possib
- June 2025, Paper 2, Q21(d) (5 marks): The Hertzsprung–Russell diagram below shows part of the main sequence of stars. The star Sirius A is marked on the diagram. L / LSun 10 000 1000 100 Sirius A 10
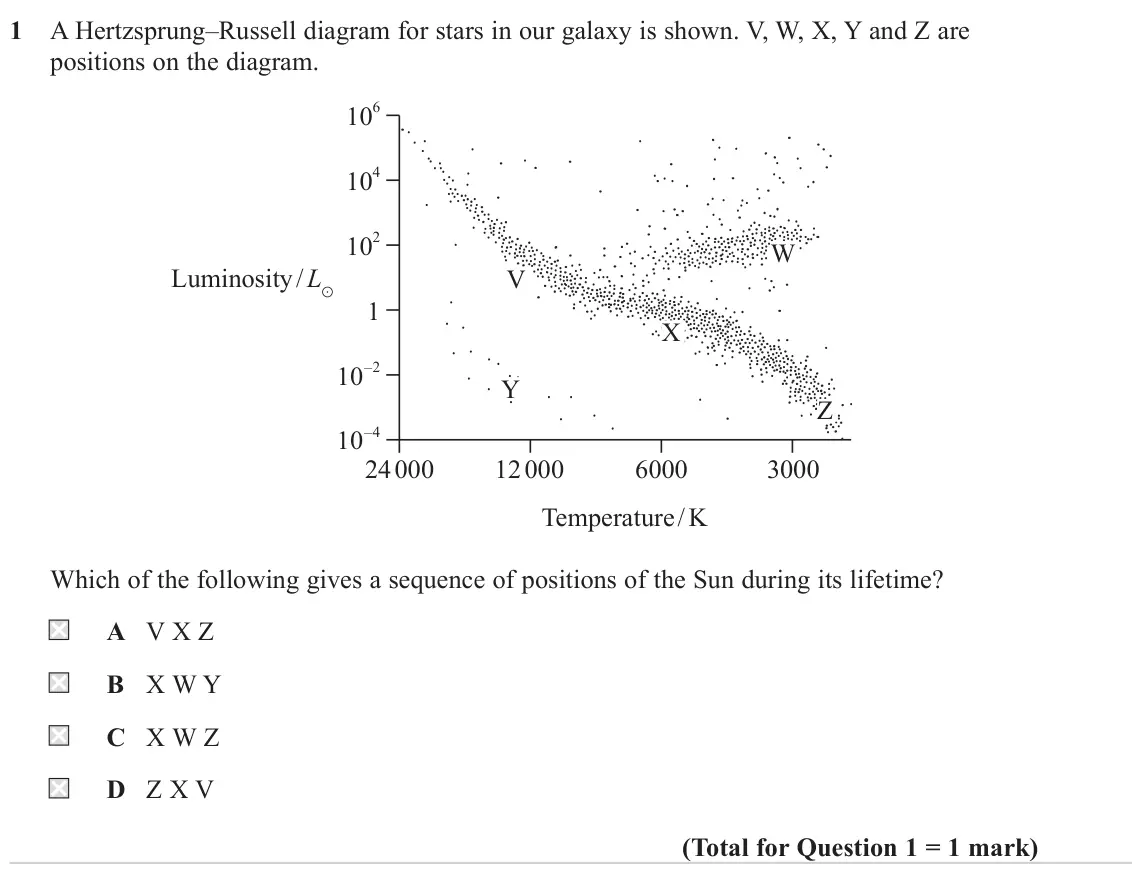
- June 2024, Paper 2, Q1 (1 mark): A Hertzsprung–Russell diagram for stars in our galaxy is shown. V, W, X, Y and Z are positions on the diagram. 6 10 10 4 2 10 W Luminosity / L V 1 X –2 10 Y Z
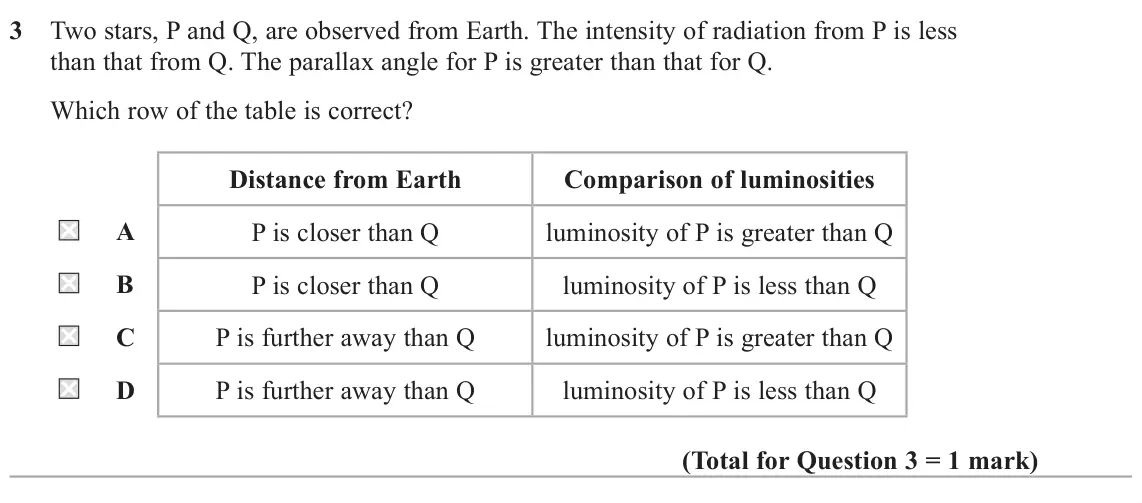
- June 2023, Paper 2, Q3 (1 mark): Two stars, P and Q, are observed from Earth. The intensity of radiation from P is less than that from Q. The parallax angle for P is greater than that for Q. Wh
- June 2023, Paper 2, Q17(b)(iii) (2 marks): This star is a main sequence star. Explain why main sequence stars do not collapse due to gravitational forces. (2)
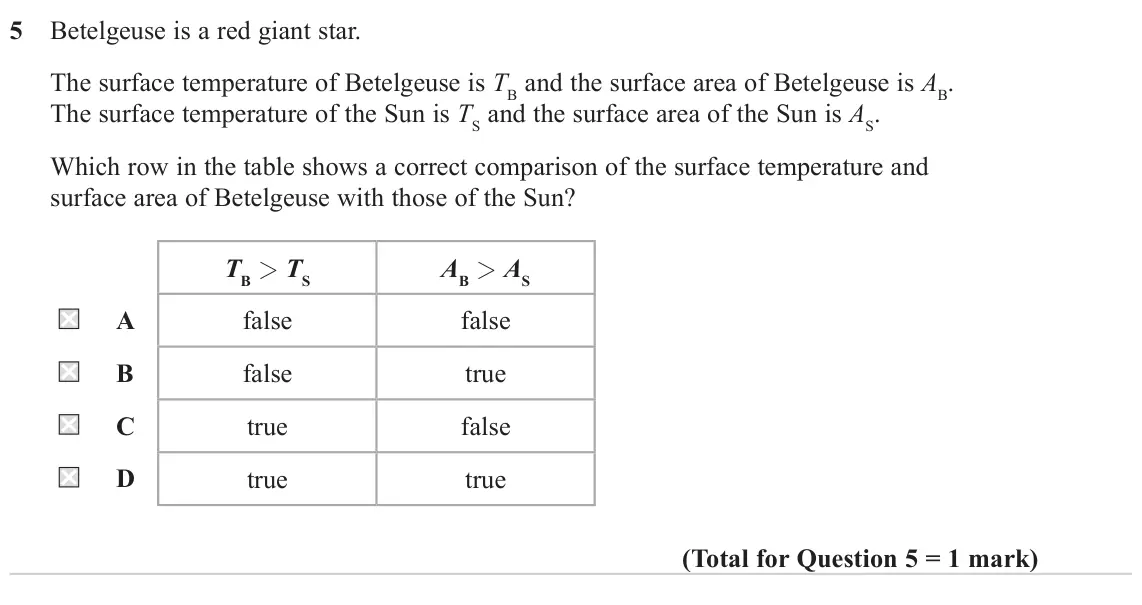
- June 2022, Paper 2, Q5 (1 mark): Betelgeuse is a red giant star. The surface temperature of Betelgeuse is TB and the surface area of Betelgeuse is AB. The surface temperature of the Sun is TS a
- November 2021, Paper 2, Q15(c) (2 marks): Add the position of VY Canis Majoris to the Hertzsprung Russell diagram to determine which type of star it is. (2) 106 104 102 1 10−2 10−4 24 000 12 000 6000 30
- November 2021, Paper 2, Q17(c) (3 marks): Trigonometric parallax and Hubble’s law are two methods used to determine astronomical distances. Explain whether either of these methods is suitable to determi
- November 2021, Paper 3, Q9(a)(i) (2 marks): Explain how we can tell that the young star cluster is in the early stages of its evolution. (2)
- November 2021, Paper 3, Q9(a)(ii) (4 marks): Explain why the most massive stars in the cluster have the greatest luminosities. (4)
- November 2021, Paper 3, Q9(b)(i) (2 marks): It is suggested that the relationship between luminosity L and surface temperature T is of the form L = kT n where k and n are constants. Explain why a graph of
- November 2021, Paper 3, Q9(b)(ii) (5 marks): The table shows data for stars in this cluster. L / LSun T / K 39.5 10 600 545 16 400 20 600 26 800 535 000 44 900 1 770 000 53 300 Plot a graph of log L agains
- November 2021, Paper 3, Q9(b)(iii) (2 marks): Determine a value for n. (2) n =
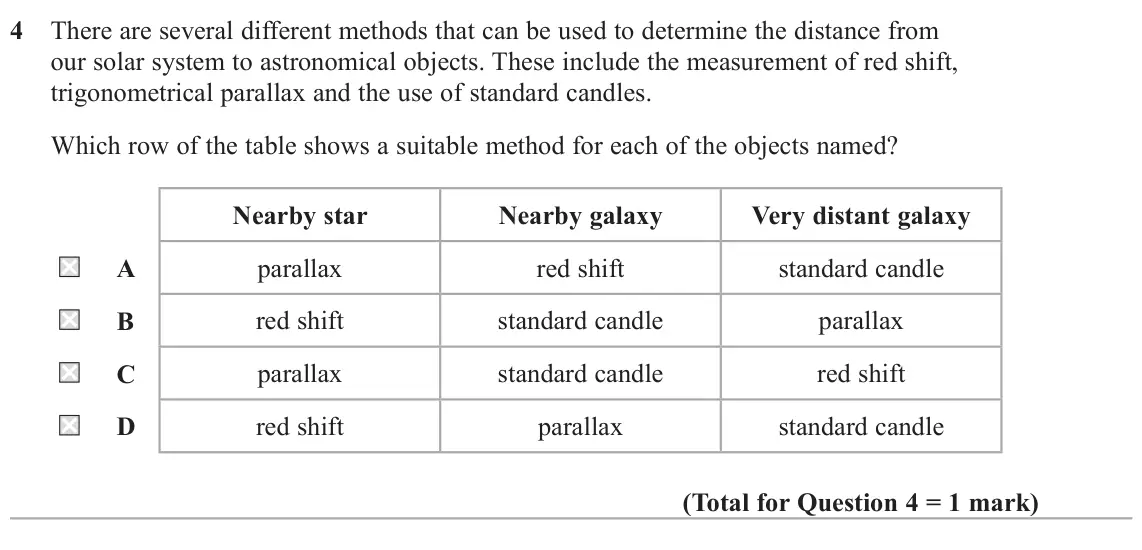
- October 2020, Paper 2, Q4 (1 mark): There are several different methods that can be used to determine the distance from our solar system to astronomical objects. These include the measurement of r
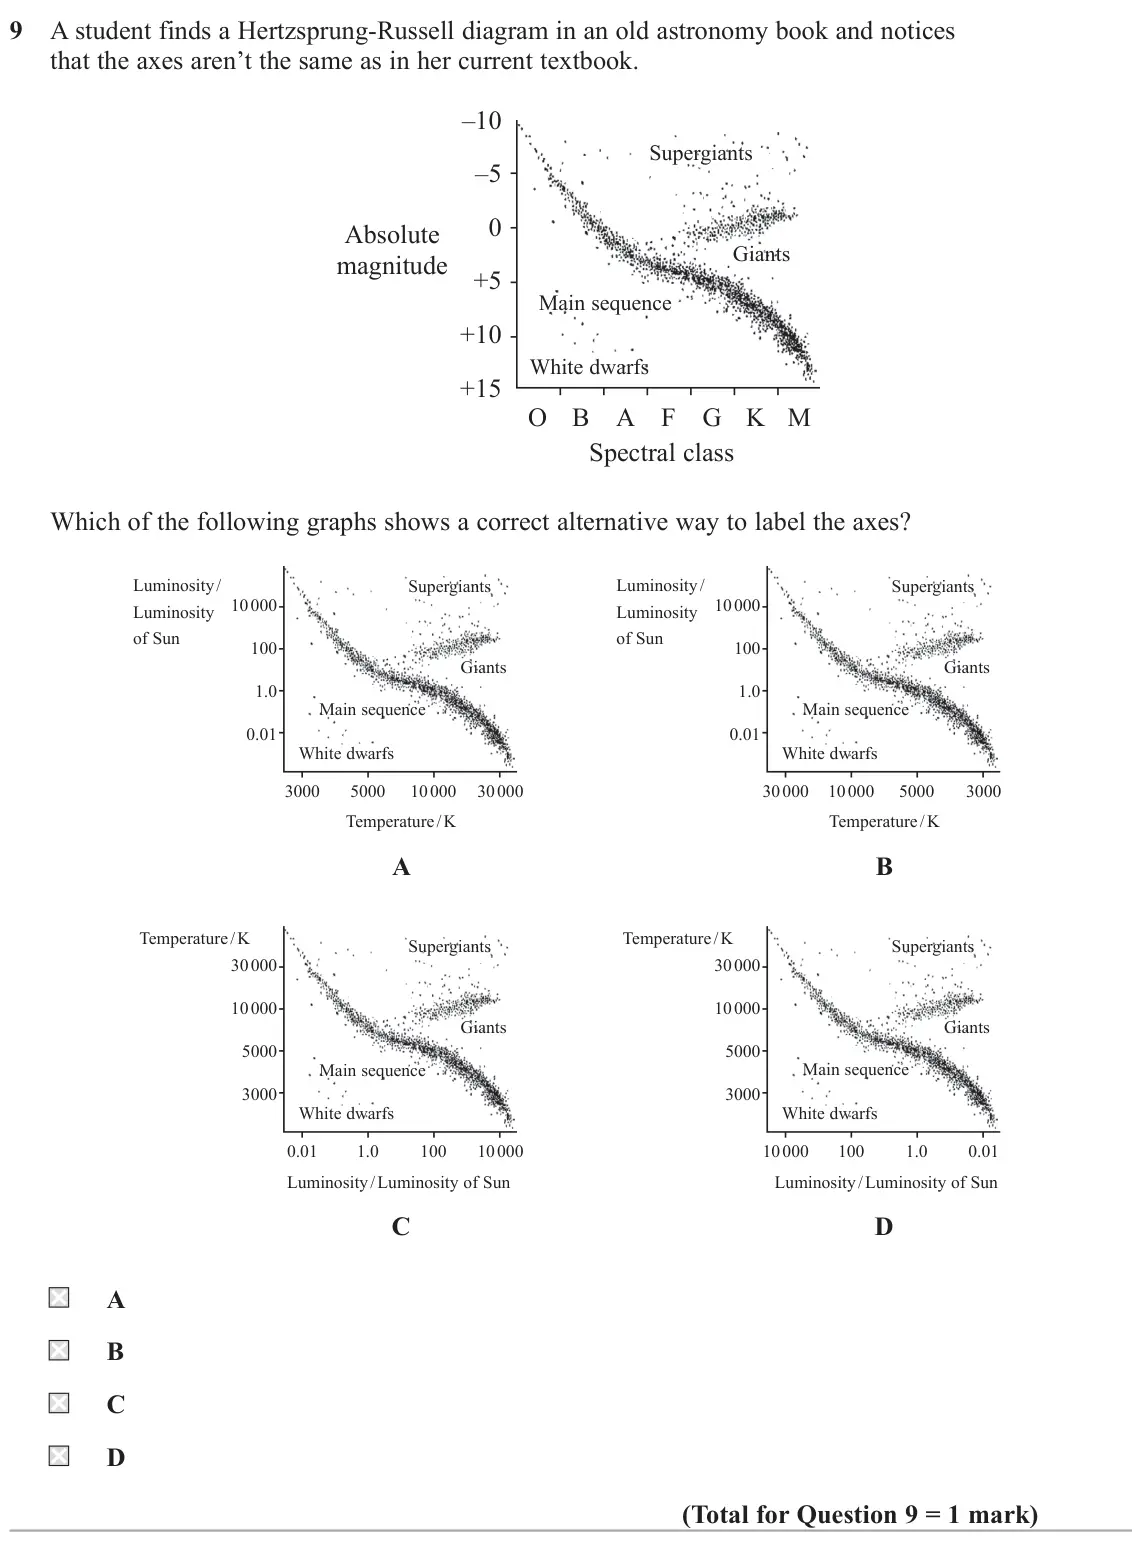
- October 2020, Paper 2, Q9 (1 mark): A student finds a Hertzsprung-Russell diagram in an old astronomy book and notices that the axes aren’t the same as in her current textbook. –10 Supergiants –5
- October 2020, Paper 3, Q11(a) (4 marks): An advertisement for solar panels claims that the intensity of radiation from the Sun incident at the top of the Earth’s atmosphere is more than 2 kW m−2. Asses
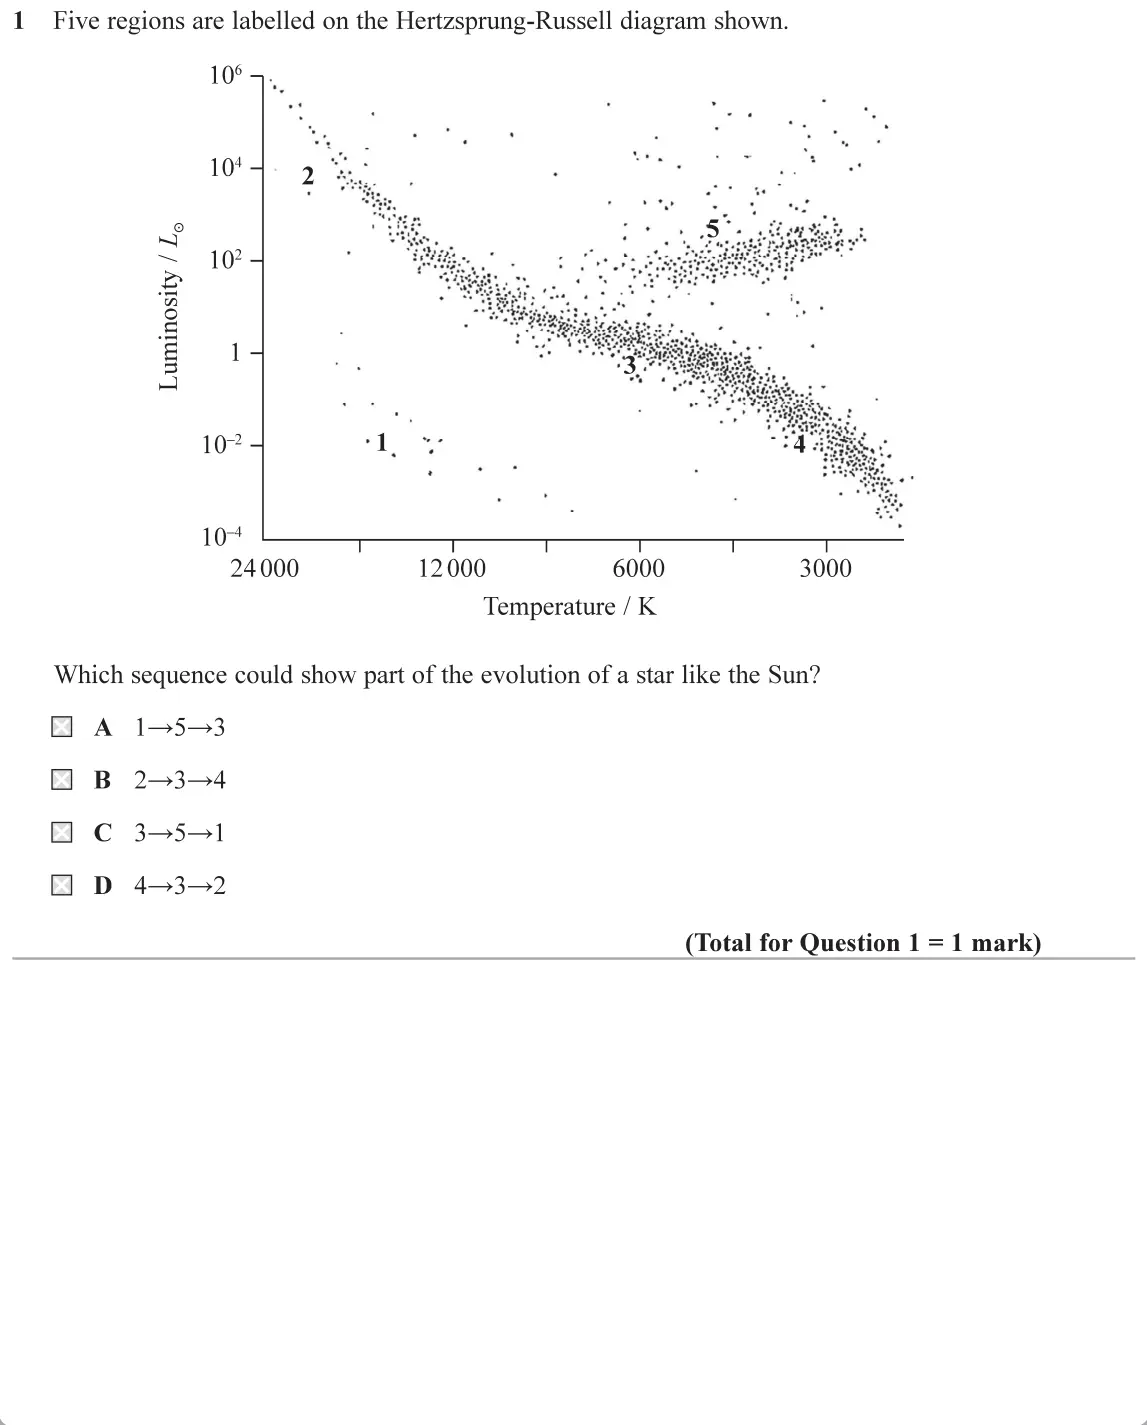
- June 2019, Paper 2, Q1 (1 mark): Five regions are labelled on the Hertzsprung-Russell diagram shown. 1 10° 104 - 2 10° - :: 1- 10-2- •1. : • • 104 T T 12000 24000 6000 3000 Temperature / K Whic
- June 2019, Paper 3, Q6(b) (1 mark): The transmission of electromagnetic radiation through the atmosphere is shown on the graph. 100 0 10–7 10–6 10–5 10–4 10–3 10–2 10–1 wavelength / m State one ad
- June 2018, Paper 2, Q19(a)(i) (3 marks): Show that the luminosity of Proxima Centauri is about 0.002 L . (3) distance to Proxima Centauri = 4.00 × 10¹⁶ m L = 3.85 × 1026 W
- June 2018, Paper 2, Q19(a)(ii) (3 marks): Proxima Centauri is described on a website as a main sequence star. Determine whether the surface temperature of Proxima Centauri is consistent with a position
- June 2018, Paper 2, Q19(c) (3 marks): Describe how the distance to nearby stars like Proxima Centauri is determined. (3)
- June 2017, Paper 2, Q6 (1 mark): Four regions A, B, C and D are labelled on the Hertzsprung‑Russell diagram. luminosity / L 106 D 104 102 C 1 B A 10–2 10–4 24 000 12 000 6000 3000 temperature
- June 2017, Paper 2, Q13(a) (1 mark): State what is meant by a standard candle. (1)
- June 2017, Paper 2, Q13(b) (2 marks): Explain why trigonometric parallax is not used beyond a certain distance. (2)
- June 2017, Paper 3, Q9(a) (2 marks): It is suggested that the relationship between luminosity and mass is of the form L = LSun M p where L = luminosity, M = (mass of star / mass of the Sun) and LSu
- June 2017, Paper 3, Q9(b)(i) (5 marks): Plot a graph of log L against log M. You may use the columns provided to show any processed data. (5)
- June 2017, Paper 3, Q9(b)(ii) (4 marks): Determine values for p and LSun and hence state the mathematical relationship between L and M. (4)
Questions, mark schemes and examiner’s reports are © Pearson Edexcel, from their published past papers. Plumi isn’t affiliated with any exam board. Want whole papers? Every Edexcel A-Level Physics paper.
Rather write your answers by hand on iPad? Plumi marks them against the same mark schemes.