 plumi
Probability: Edexcel A‑Level Maths questions
Every Edexcel A-Level Maths exam question on S.3 Probability, 2019–2025, with its mark scheme and examiner’s report.
Find questions447
All 12 questions on Probability, as a list
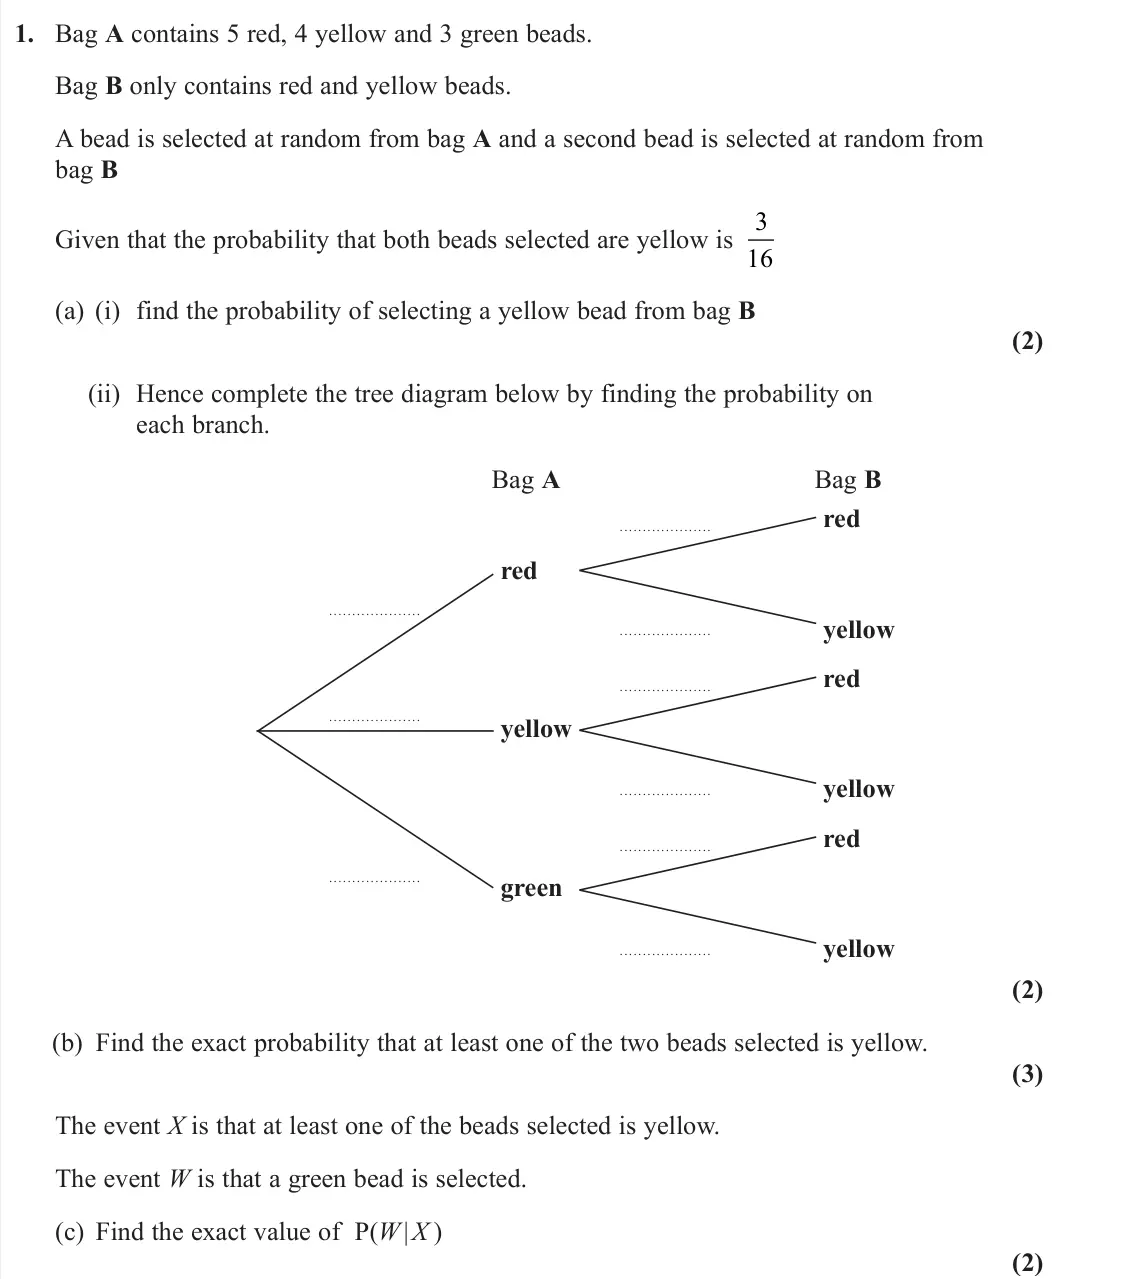
- June 2025, Statistics, Q1 (9 marks): Bag A contains 5 red, 4 yellow and 3 green beads. Bag B only contains red and yellow beads. A bead is selected at random from bag A and a second bead is selecte
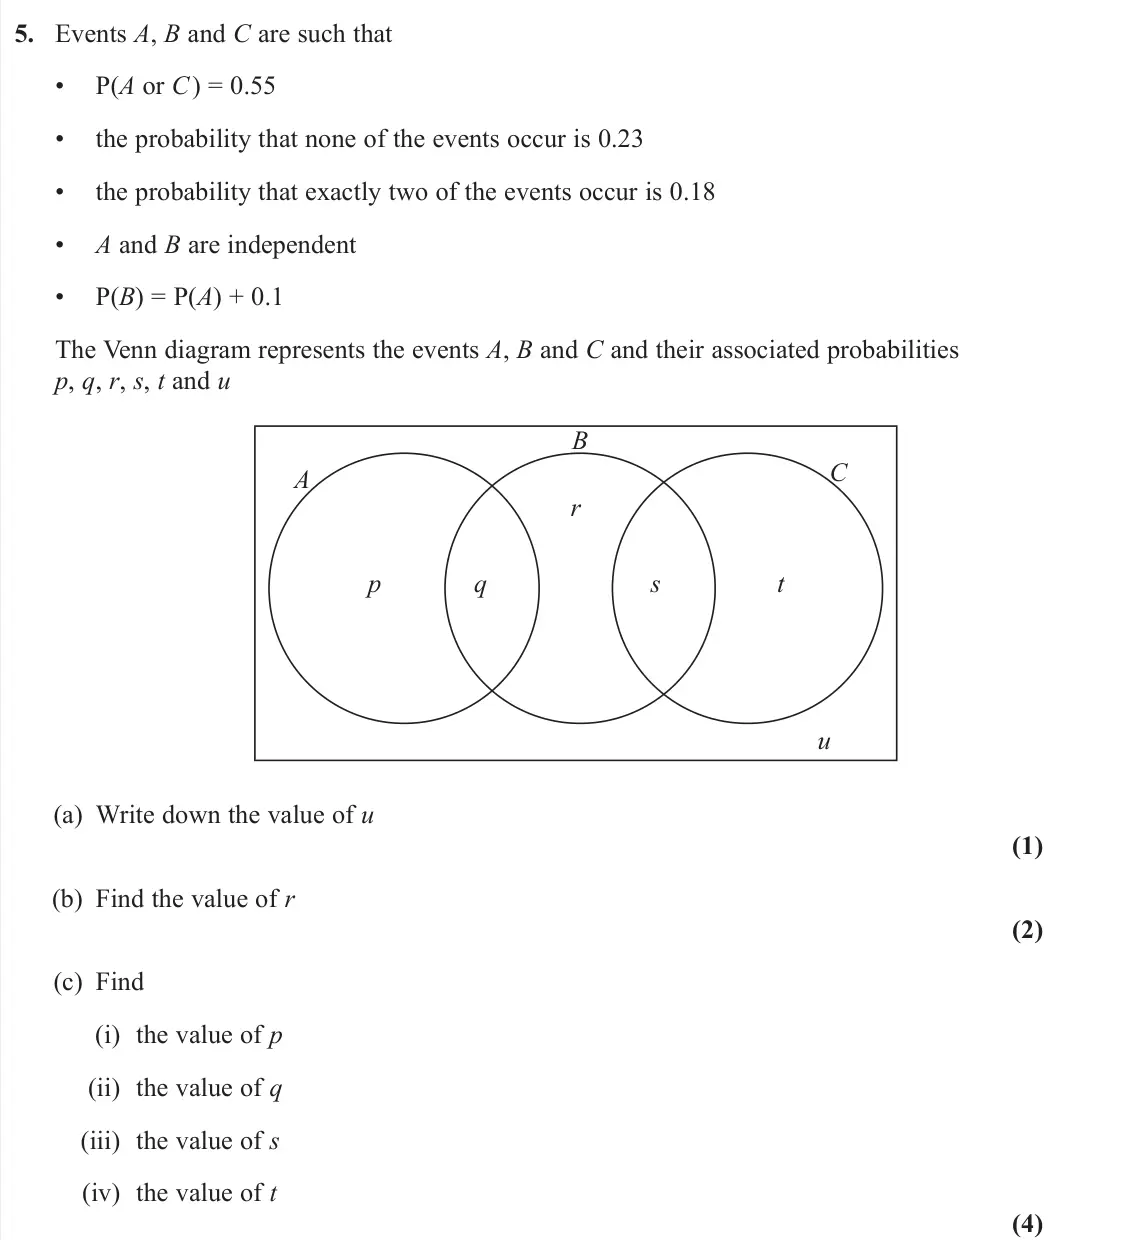
- June 2025, AS Statistics, Q5 (7 marks): Events A, B and C are such that • P(A or C) = 0.55 • the probability that none of the events occur is 0.23 • the probability that exactly two of the events occu
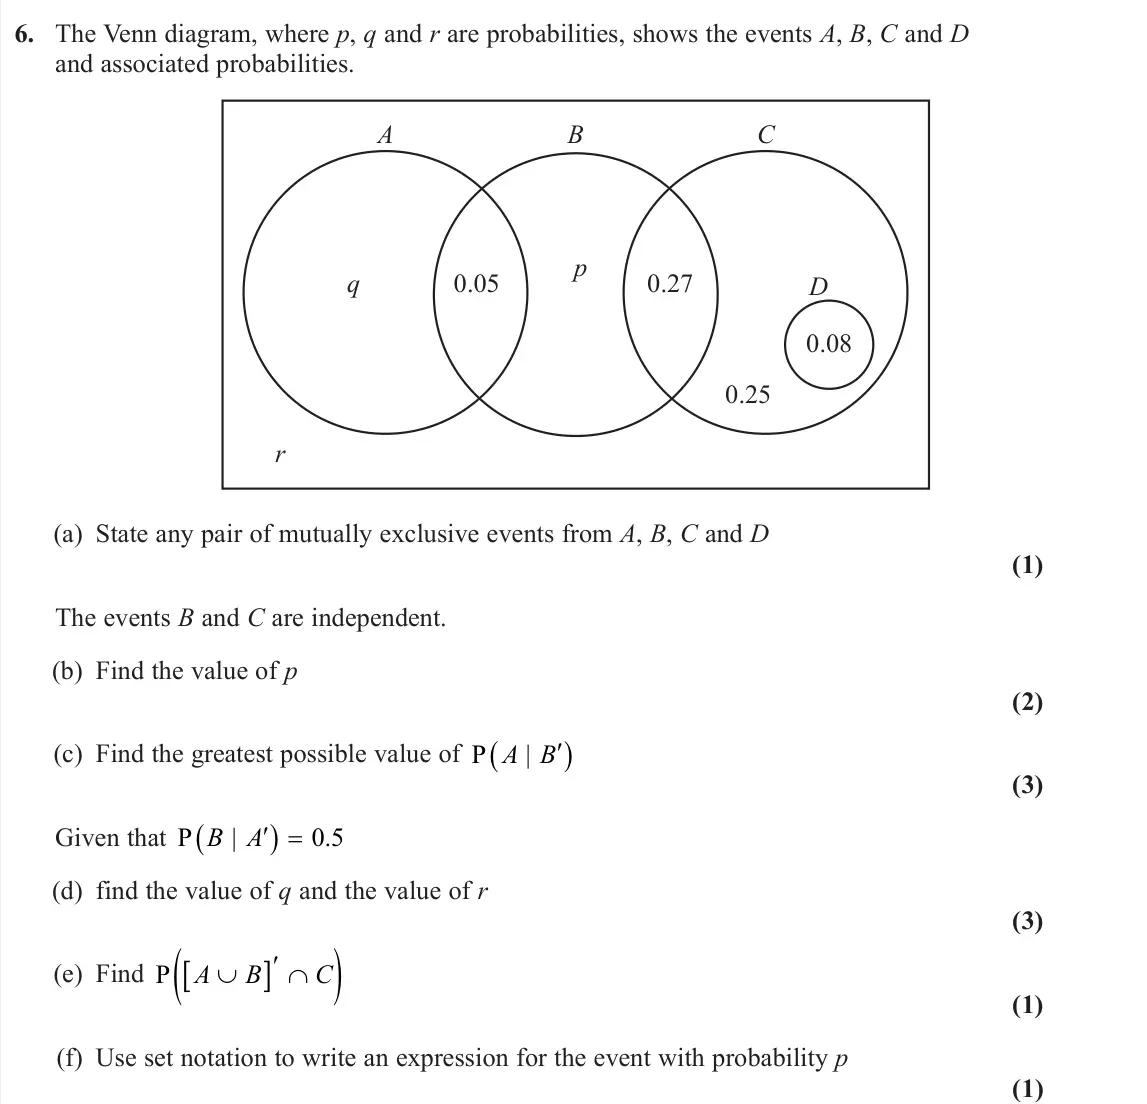
- June 2024, Statistics, Q6 (11 marks): The Venn diagram, where p, q and r are probabilities, shows the events A, B, C and D and associated probabilities. A B C r 0.05 0.27 0.25 0.08 p D q (a) State a
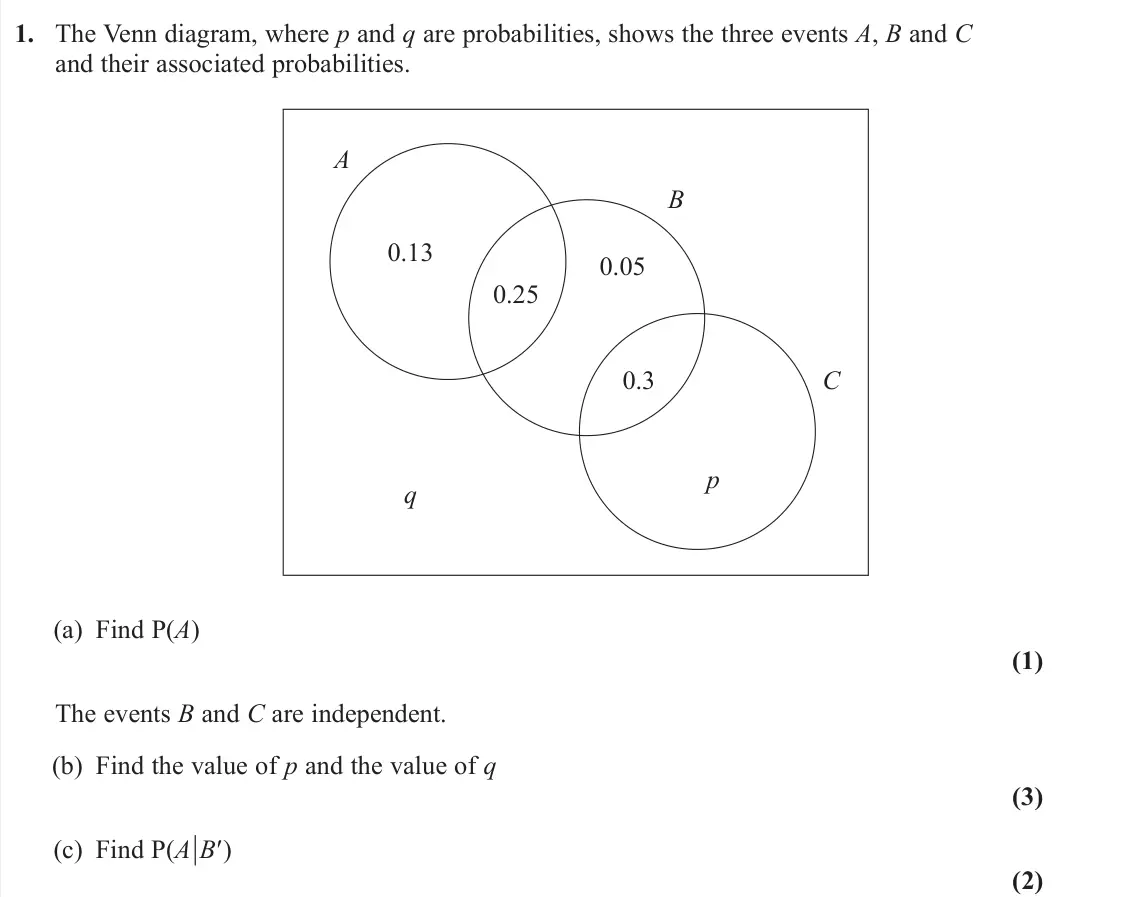
- June 2023, Statistics, Q1 (6 marks): The Venn diagram, where p and q are probabilities, shows the three events A, B and C and their associated probabilities. A 0.13 0.3 0.25 0.05 C p q B (a) Find P
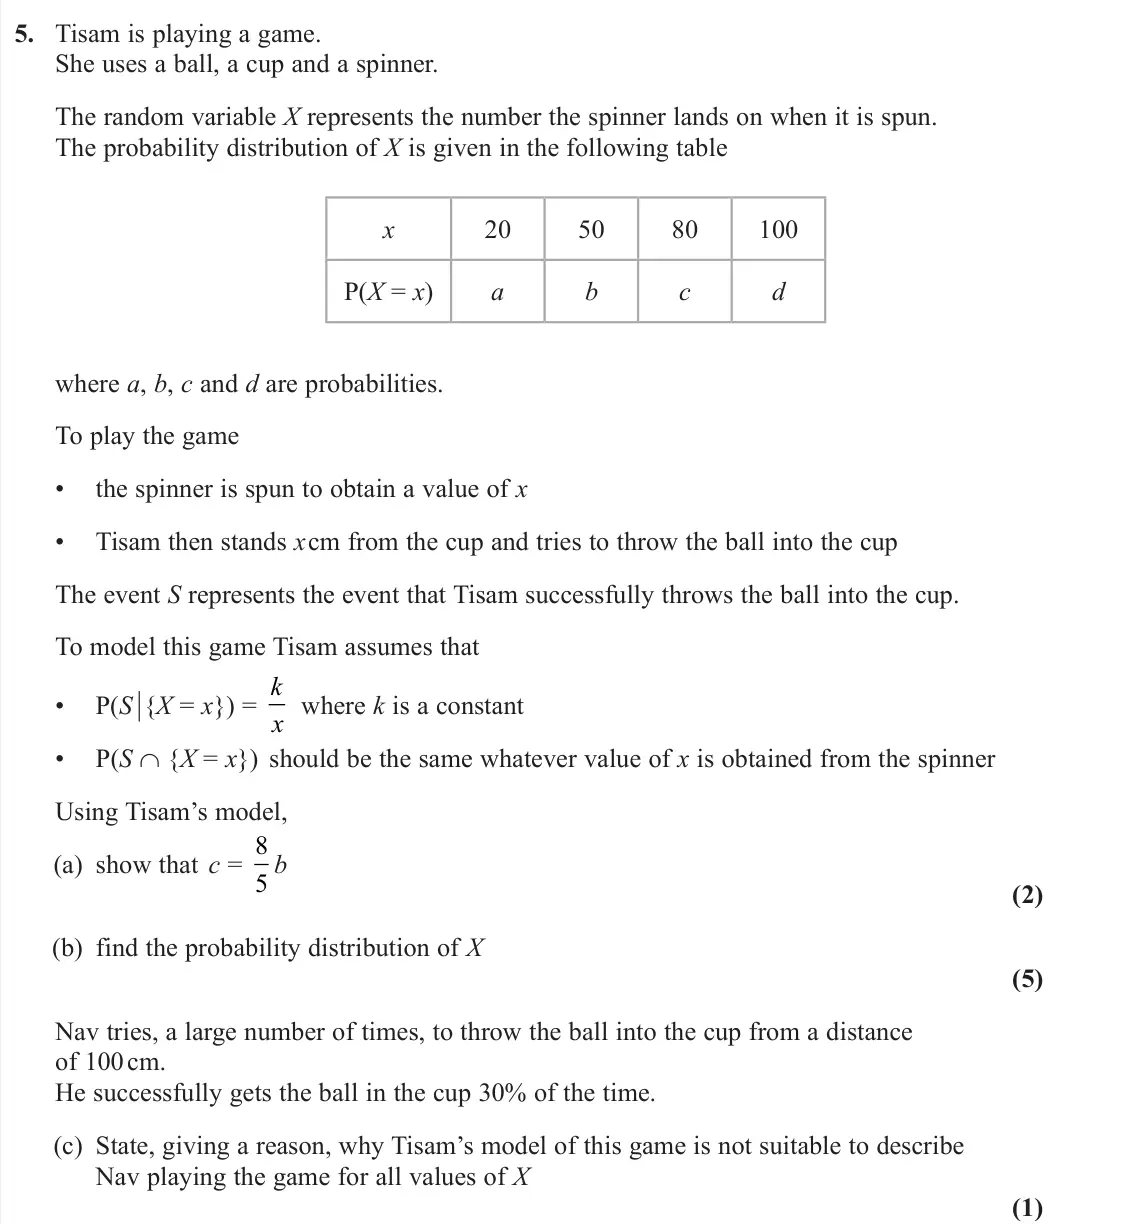
- June 2023, Statistics, Q5 (8 marks): Tisam is playing a game. She uses a ball, a cup and a spinner. The random variable X represents the number the spinner lands on when it is spun. The probability
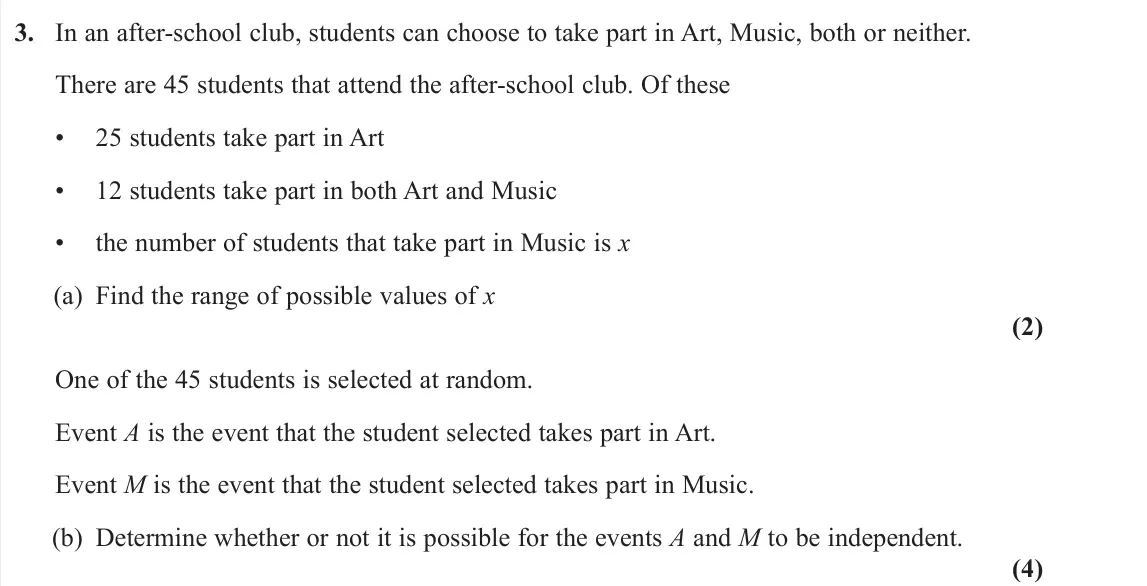
- June 2023, AS Statistics, Q3 (6 marks): In an after-school club, students can choose to take part in Art, Music, both or neither. There are 45 students that attend the after-school club. Of these • 25
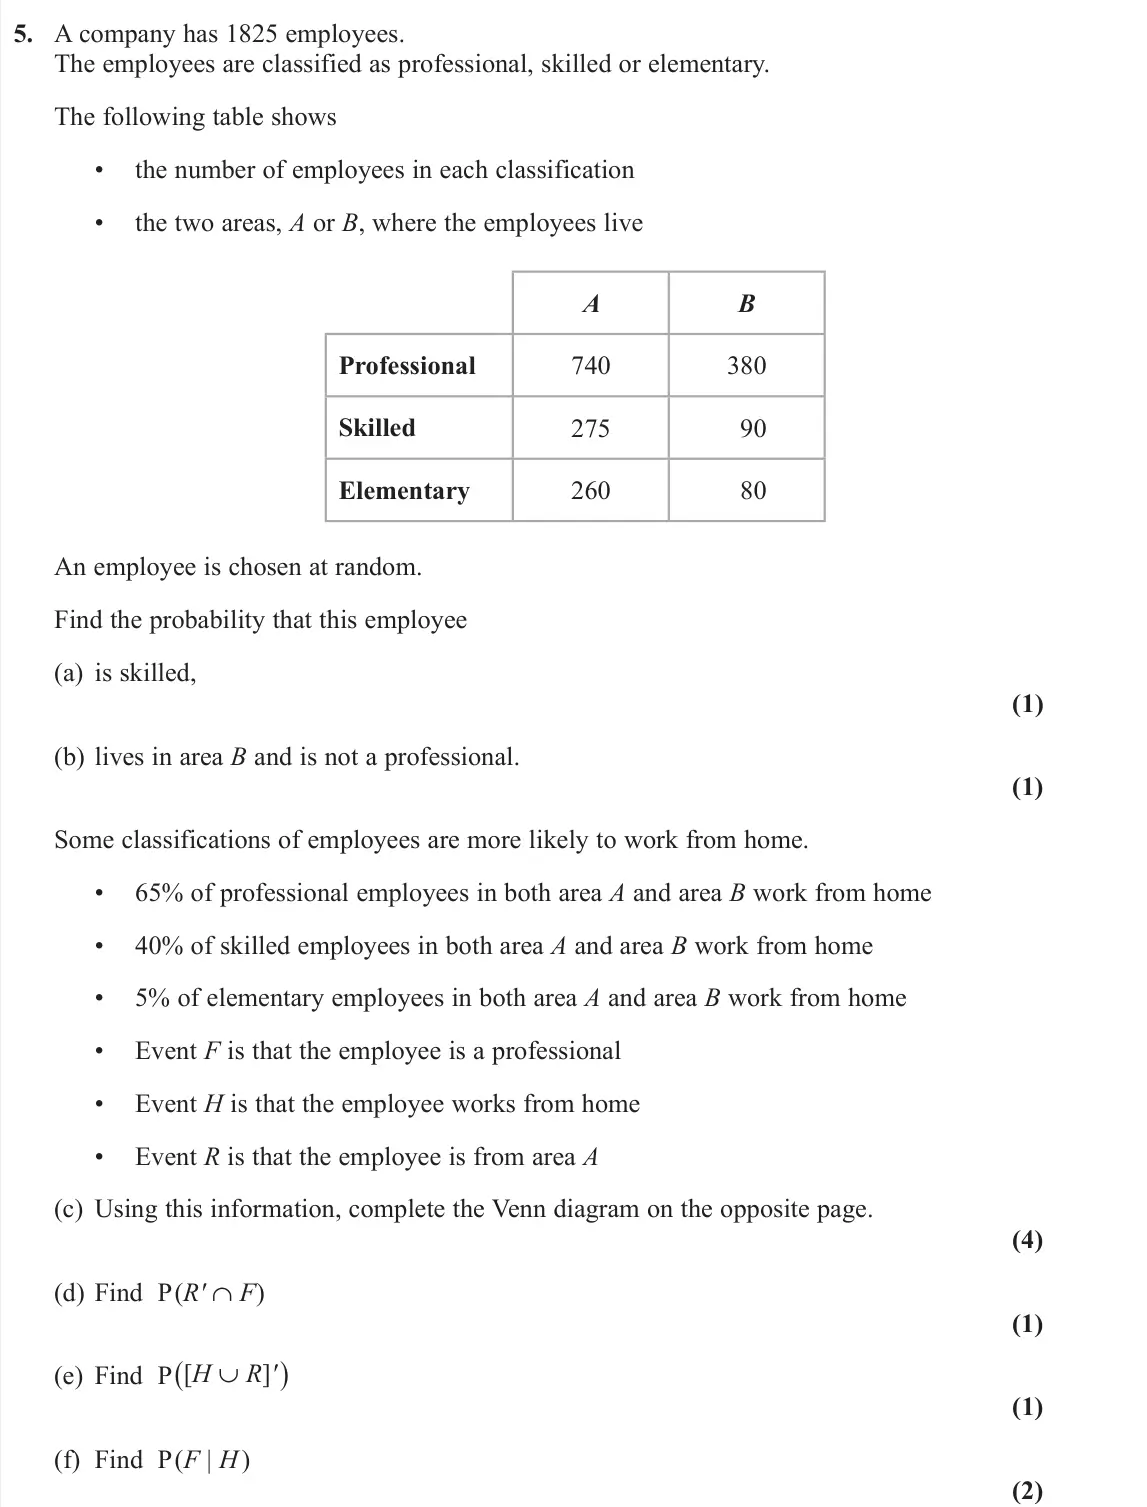
- June 2022, Statistics, Q5 (10 marks): A company has 1825 employees. The employees are classified as professional, skilled or elementary. The following table shows • the number of employees in each c
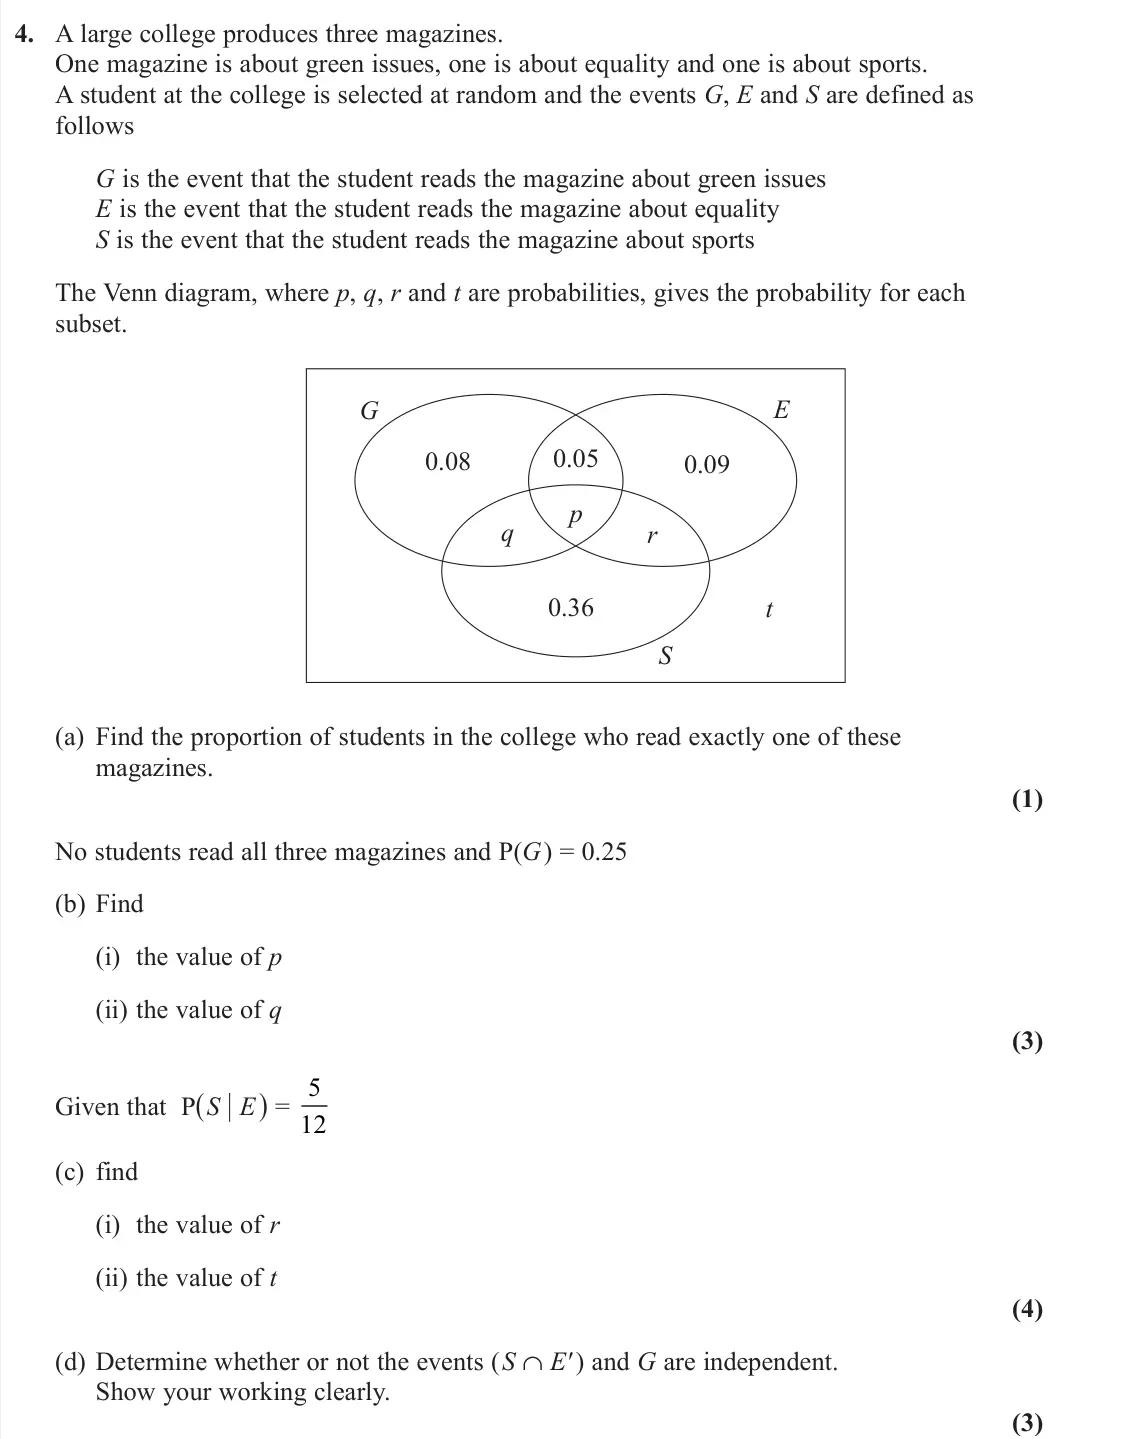
- November 2021, Statistics, Q4 (11 marks): A large college produces three magazines. One magazine is about green issues, one is about equality and one is about sports. A student at the college is selecte
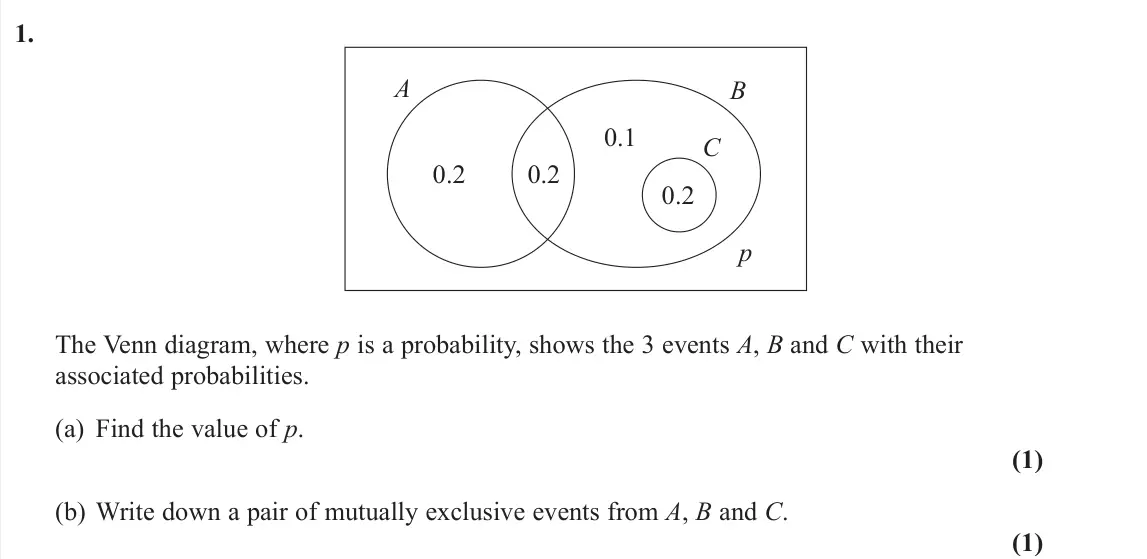
- November 2021, AS Statistics, Q1 (2 marks): 0.2 A 0.2 0.2 0.1 C p B The Venn diagram, where p is a probability, shows the 3 events A, B and C with their associated probabilities. (a) Find the value of p.
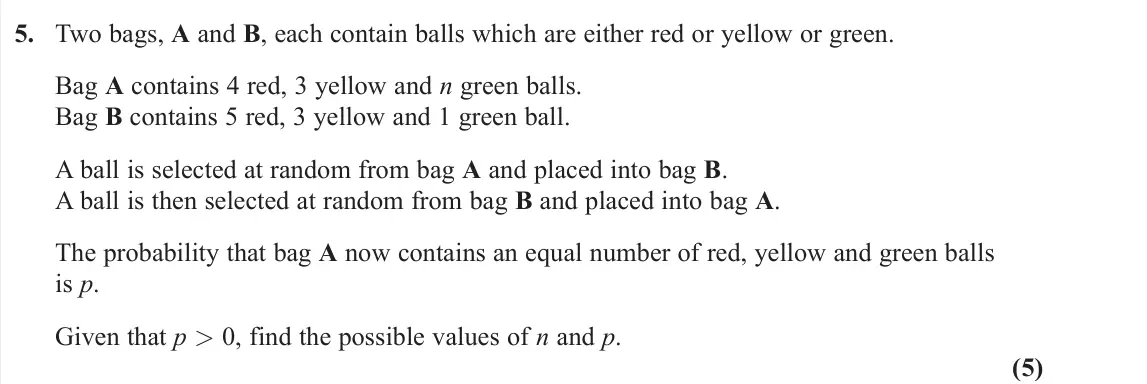
- November 2021, AS Statistics, Q5 (5 marks): Two bags, A and B, each contain balls which are either red or yellow or green. Bag A contains 4 red, 3 yellow and n green balls. Bag B contains 5 red, 3 yellow
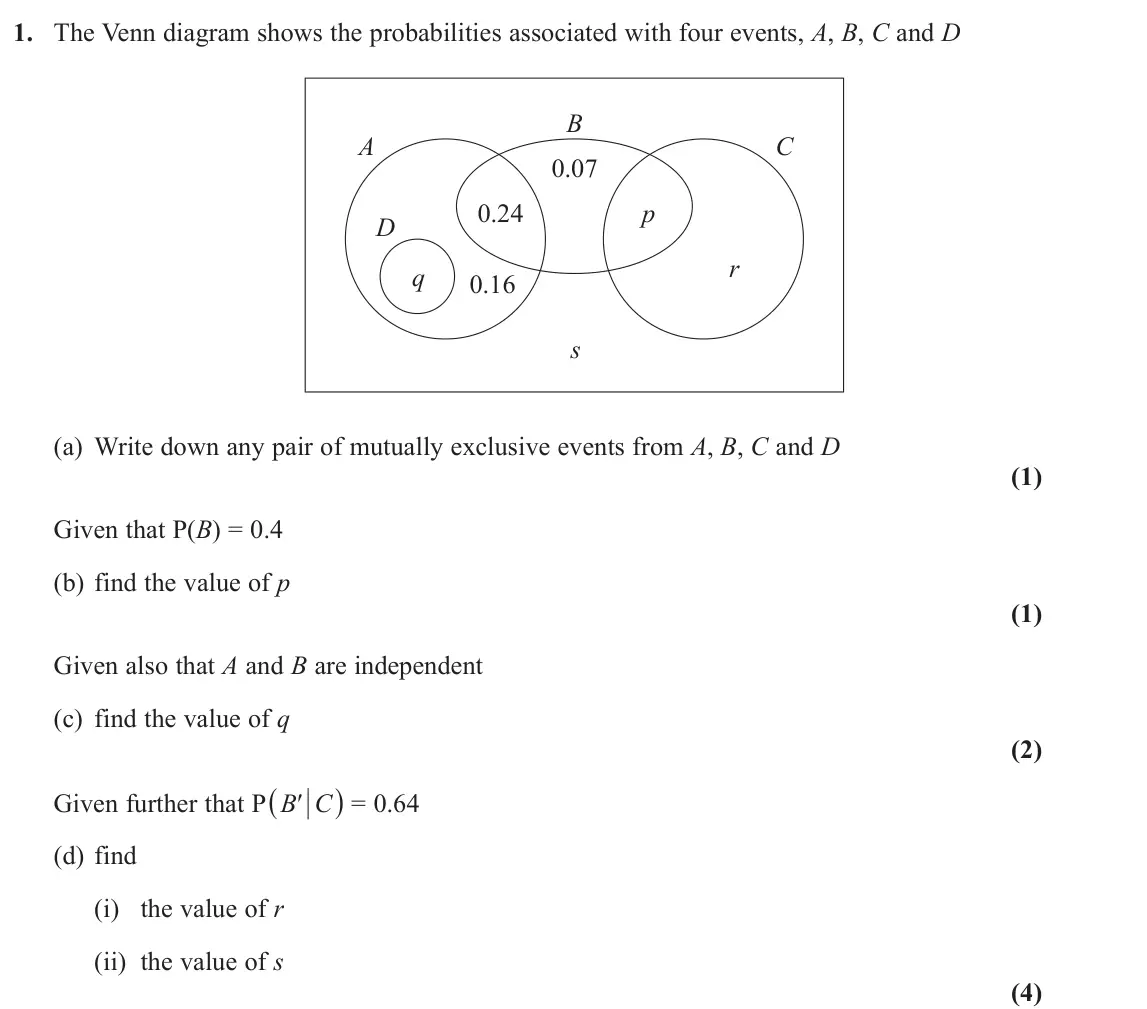
- November 2020, Statistics, Q1 (8 marks): The Venn diagram shows the probabilities associated with four events, A, B, C and D A 0.07 0.16 0.24 C B s r q p D (a) Write down any pair of mutually exclusive
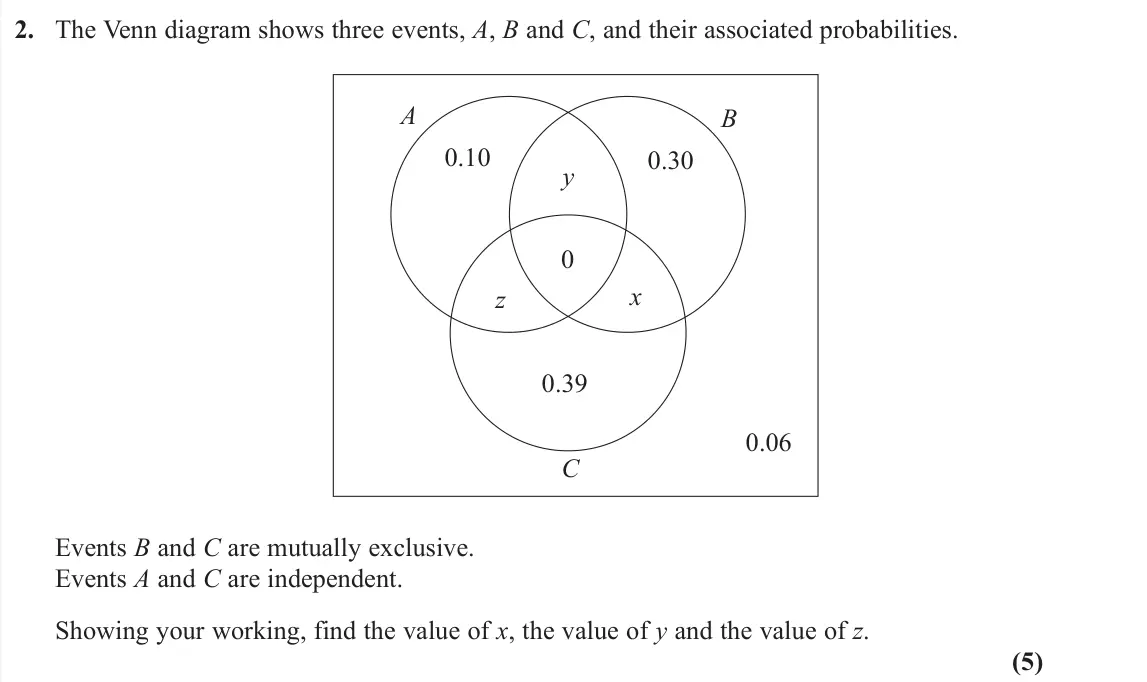
- June 2019, AS Statistics, Q2 (5 marks): The Venn diagram shows three events, A, B and C, and their associated probabilities. A 0.10 0.06 0.39 y 0.30 C x z 0 B Events B and C are mutually exclusive. Ev
Questions, mark schemes and examiner’s reports are © Pearson Edexcel, from their published past papers. Plumi isn’t affiliated with any exam board. Want whole papers? Every Edexcel A-Level Maths paper, or our free Edexcel-style practice pack.
Rather write your answers by hand on iPad? Plumi marks them against the same mark schemes.