 plumi
Kinetics I: Edexcel A‑Level Chemistry questions
Every Edexcel A-Level Chemistry exam question on 9 Kinetics I, 2016–2025, with its mark scheme and examiner’s report.
Find questions2,028
Calculations
Q5(b)
The whole paper ↗
Q5(c)(ii)
The whole paper ↗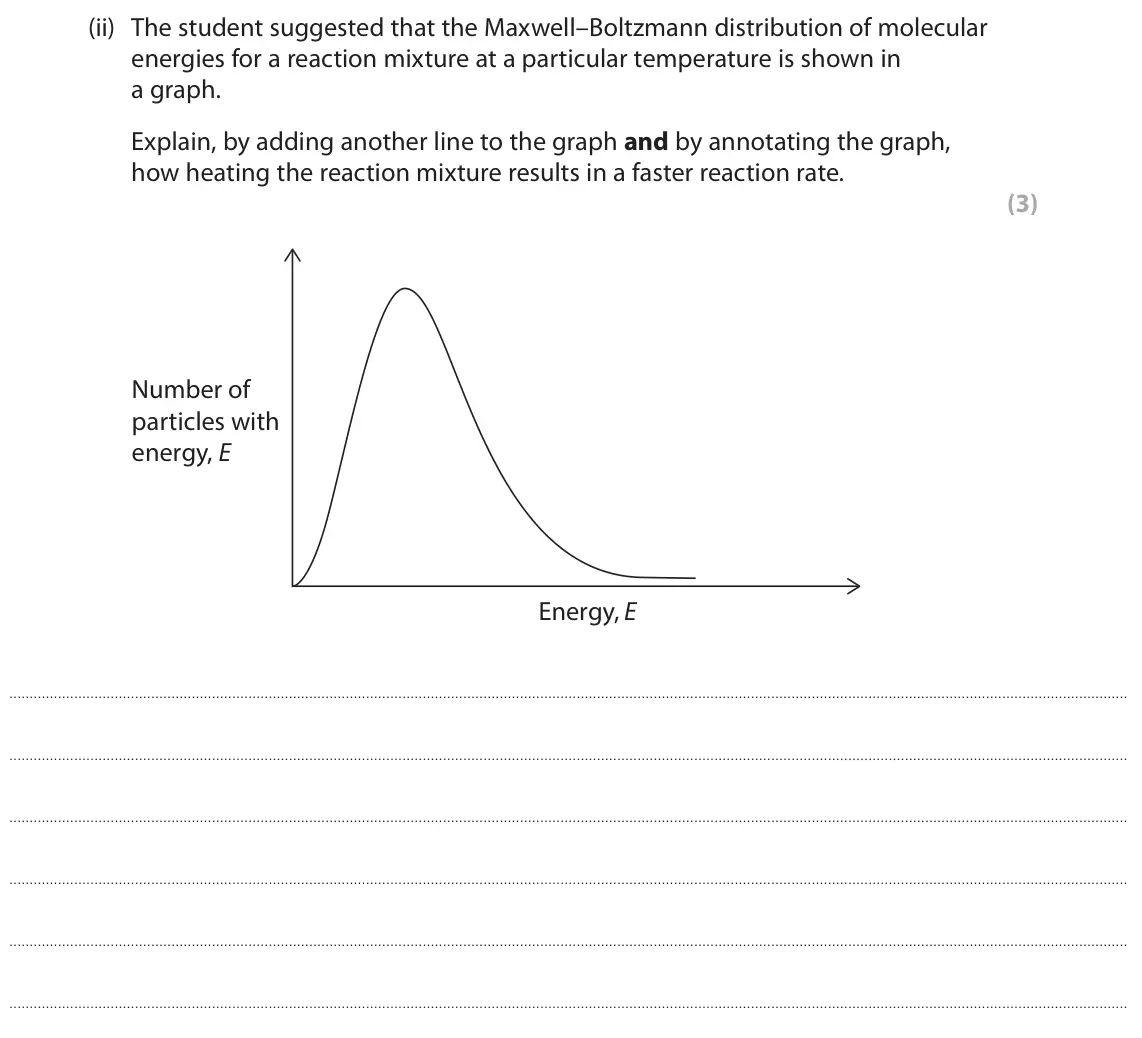
Q7(a)(i)
The whole paper ↗
Q7(a)(ii)
The whole paper ↗
Q7(b)(i)
The whole paper ↗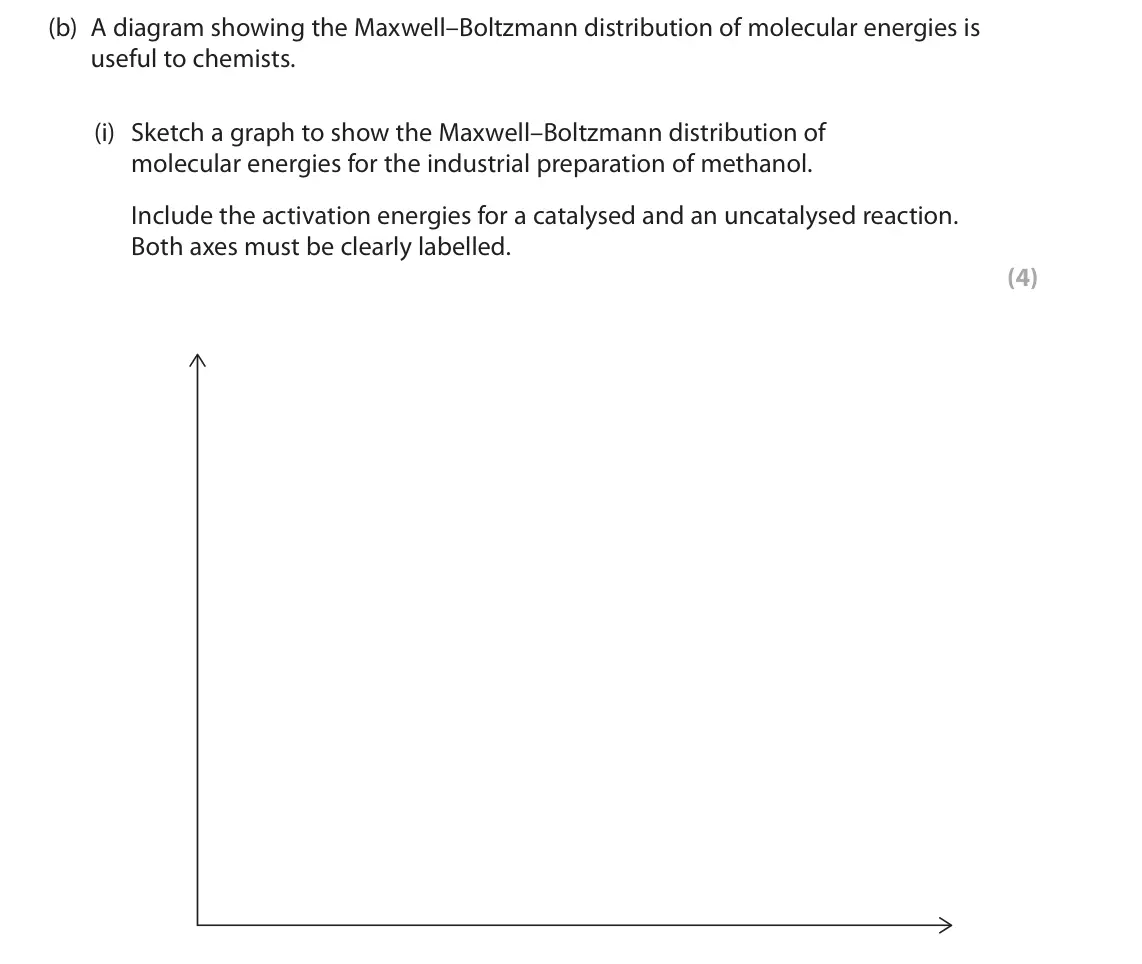
Q7(b)(ii)
The whole paper ↗
Q8(a)(ii)
The whole paper ↗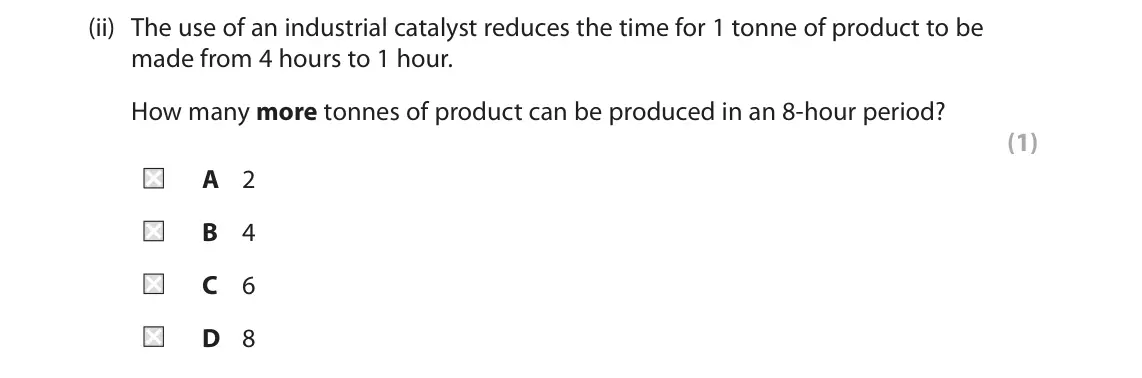
Q8(b)(i)
The whole paper ↗
Q8(b)(ii)
The whole paper ↗
Q5(a)(iv)
The whole paper ↗
Q6(a)
The whole paper ↗
Q6(b)(i)
The whole paper ↗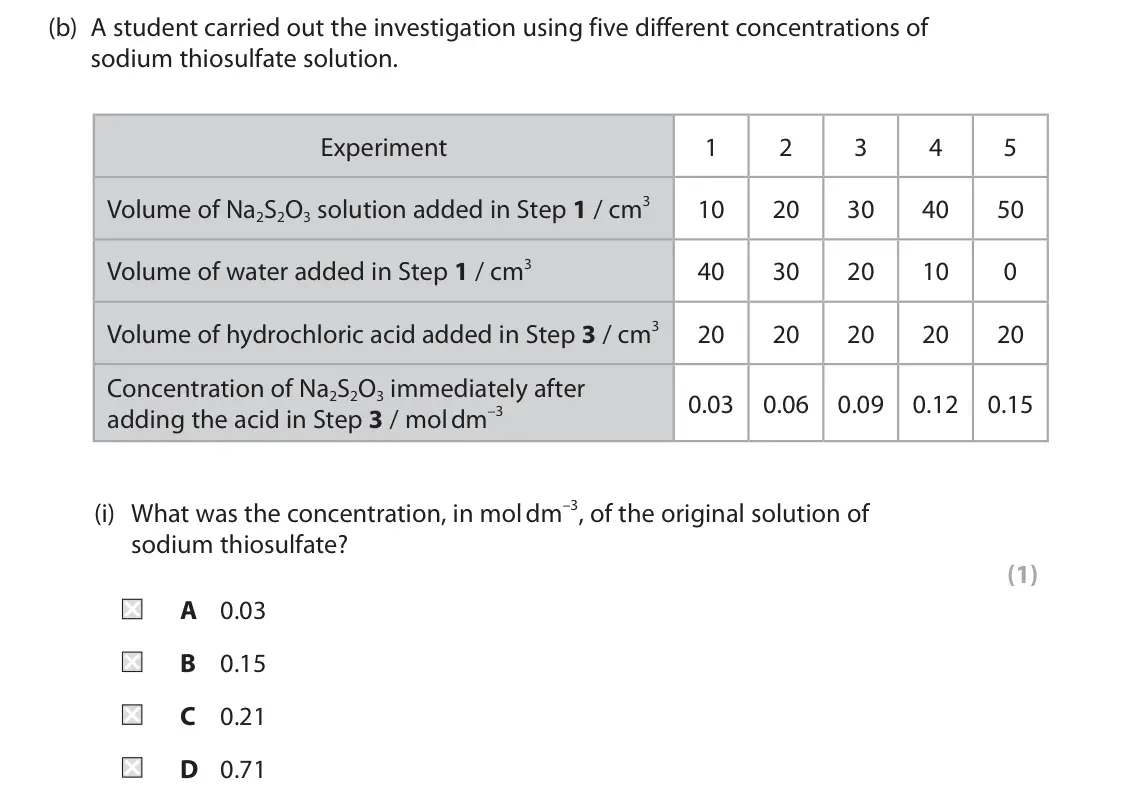
Q6(b)(ii)
The whole paper ↗
Q6(c)(i)
The whole paper ↗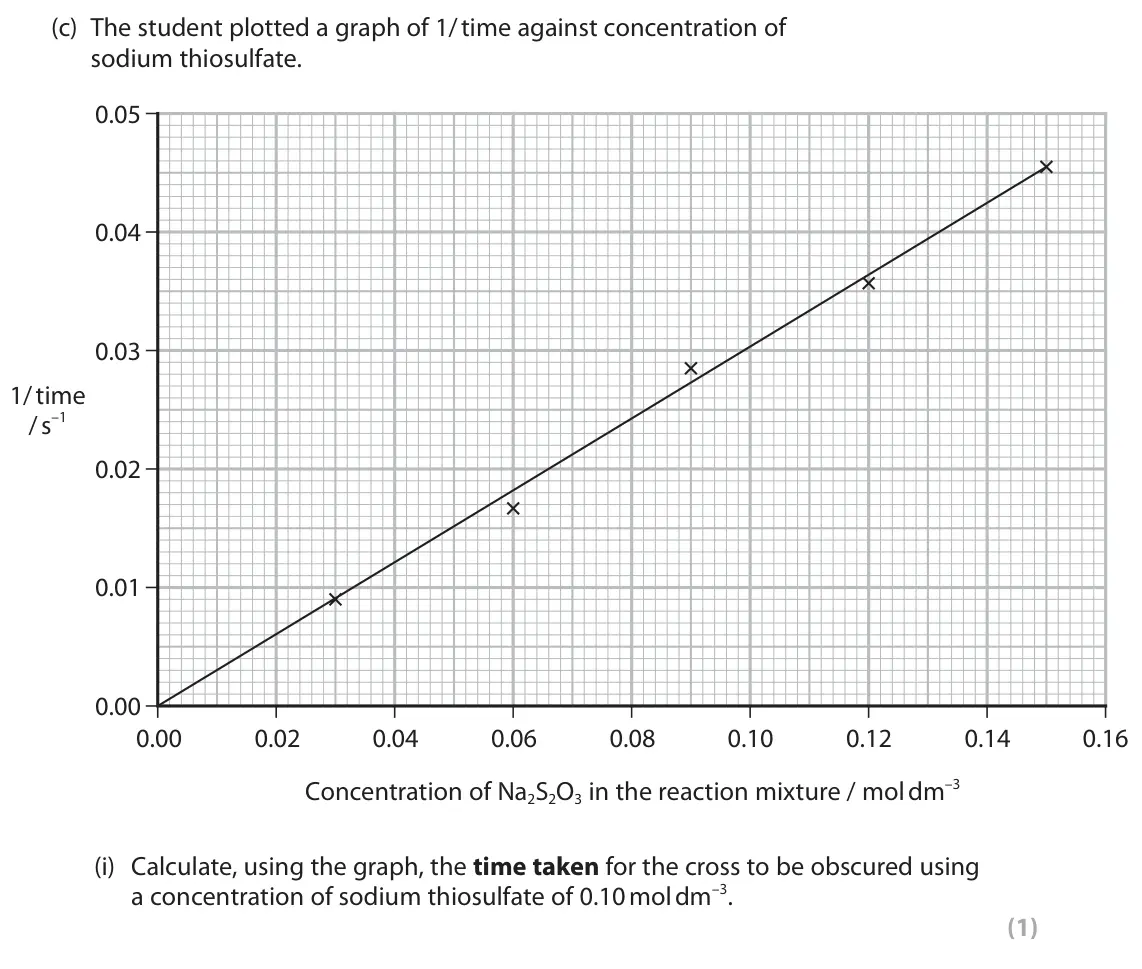
Q6(c)(ii)
The whole paper ↗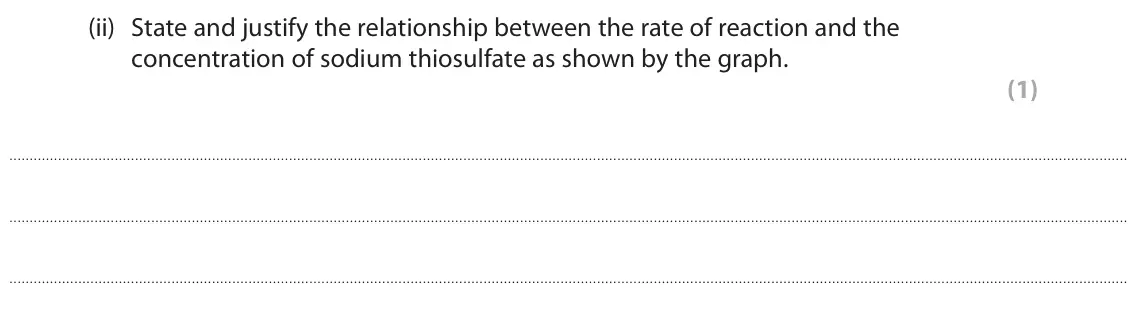
Q6(d)
The whole paper ↗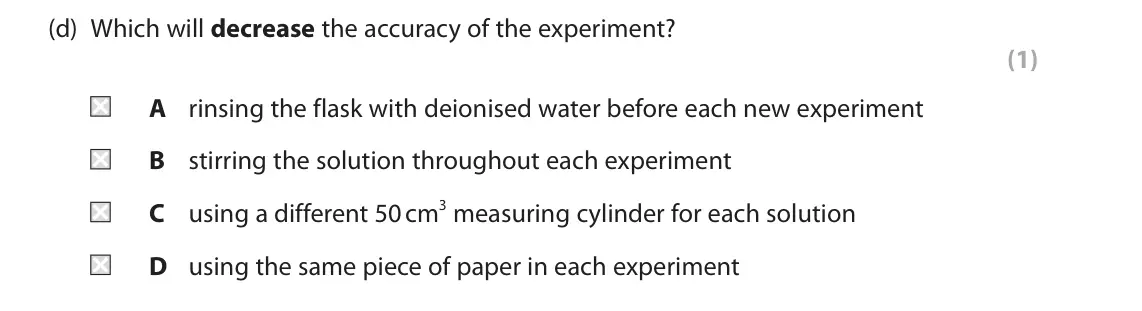
Q6(e)
The whole paper ↗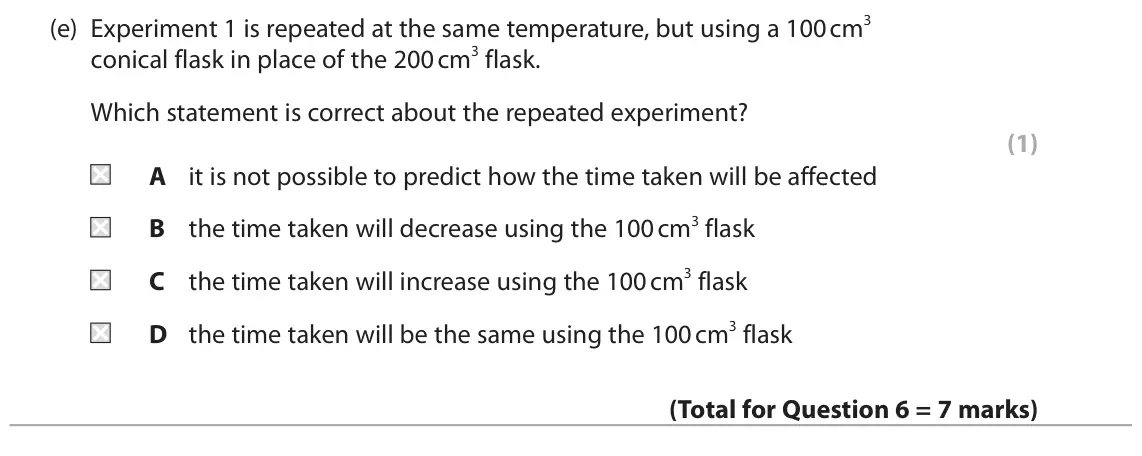
Q5(d)(i)
The whole paper ↗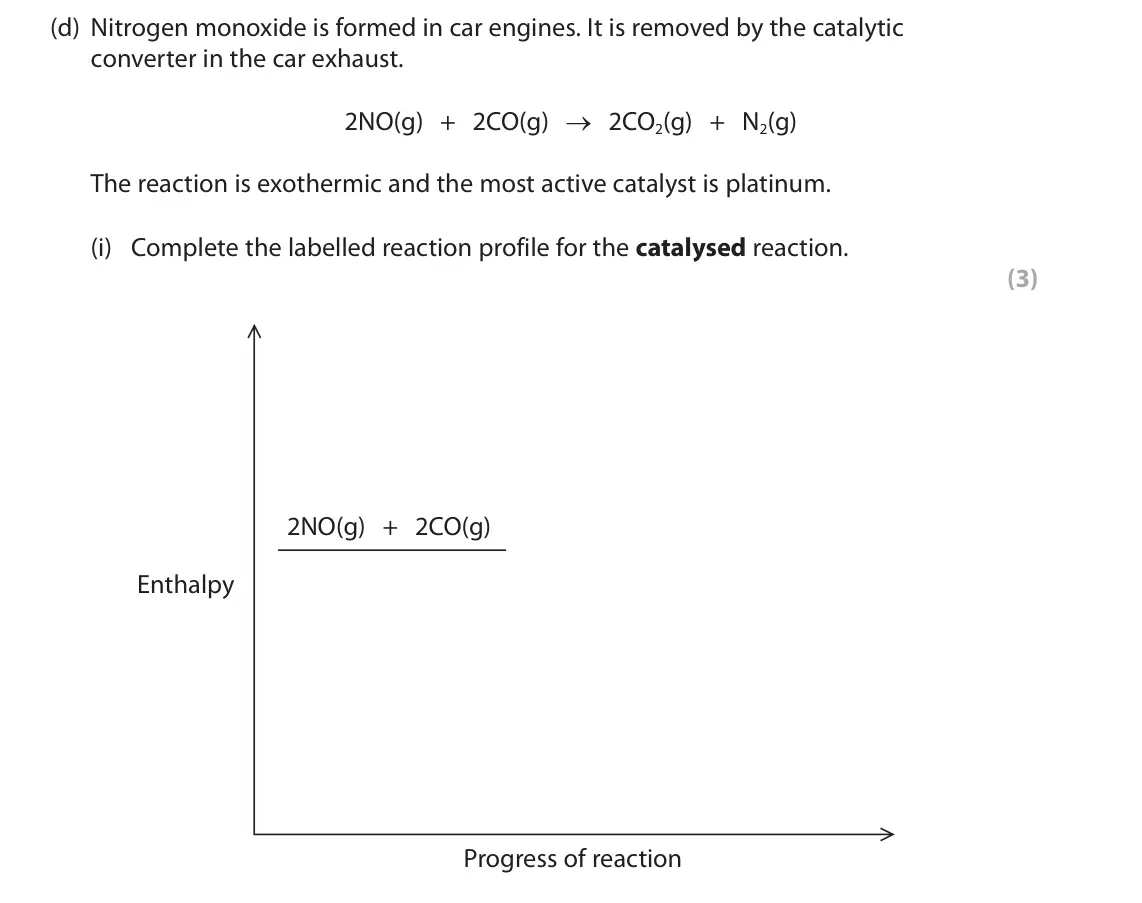
Q5(d)(ii)
The whole paper ↗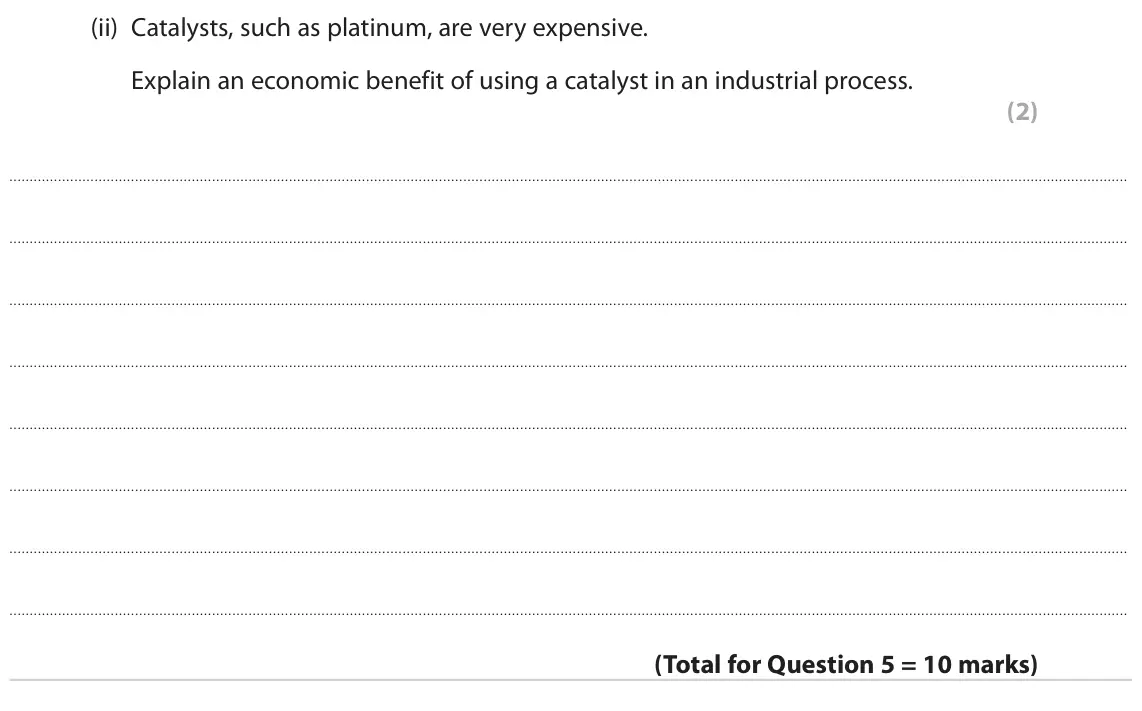
All 74 questions on Kinetics I, as a list
- June 2025, Paper 2, Q5(b) (1 mark): State why powdered metal carbonate reacts faster than large lumps. (1)
- June 2025, Paper 2, Q5(c)(ii) (3 marks): The student suggested that the Maxwell–Boltzmann distribution of molecular energies for a reaction mixture at a particular temperature is shown in a graph. Expl
- June 2025, AS Paper 2, Q7(a)(i) (3 marks): Explain why the reaction is carried out at a temperature of 700 K rather than 400 K or 1000 K. (3)
- June 2025, AS Paper 2, Q7(a)(ii) (3 marks): Explain why the reaction is carried out at a pressure of 90 atm rather than 40 atm or 140 atm. (3)
- June 2025, AS Paper 2, Q7(b)(i) (4 marks): Sketch a graph to show the Maxwell–Boltzmann distribution of molecular energies for the industrial preparation of methanol. Include the activation energies for
- June 2025, AS Paper 2, Q7(b)(ii) (2 marks): Explain how your Maxwell–Boltzmann graph shows the effect of a catalyst on this reaction. (2)
- June 2025, AS Paper 2, Q8(a)(ii) (1 mark): The use of an industrial catalyst reduces the time for 1 tonne of product to be made from 4 hours to 1 hour. How many more tonnes of product can be produced in
- June 2025, AS Paper 2, Q8(b)(i) (1 mark): State what is meant by a heterogeneous catalyst. (1)
- June 2025, AS Paper 2, Q8(b)(ii) (2 marks): Describe how a heterogeneous catalyst is able to increase the rate of reaction in a vehicle exhaust system. (2)
- June 2024, AS Paper 2, Q5(a)(iv) (1 mark): Give a reason why ice helps to prevent the formation of these redox products. (1)
- June 2024, AS Paper 2, Q6(a) (1 mark): State why the reaction mixture becomes cloudy. (1)
- June 2024, AS Paper 2, Q6(b)(i) (1 mark): What was the concentration, in mol dm–3, of the o
- June 2024, AS Paper 2, Q6(b)(ii) (1 mark): State why water is added in Experiments 1 to 4, but not in Experiment 5. (1)
- June 2024, AS Paper 2, Q6(c)(i) (1 mark): Calculate, using the graph, the time taken for the cross to be obscured using a concentration of sodium thiosulfate of 0.10 mol dm–3. (1)
- June 2024, AS Paper 2, Q6(c)(ii) (1 mark): State and justify the relationship between the rate of reaction and the concentration of sodium thiosulfate as shown by the graph. (1)
- June 2024, AS Paper 2, Q6(d) (1 mark): Which will decrease the accuracy of the experiment? (1) A rinsing the flask with deionised water before each new experiment B stirring the solution throughout e
- June 2024, AS Paper 2, Q6(e) (1 mark): Experiment 1 is repeated at the same temperature, but using a 100 cm3 conical flask in place of the 200 cm3 flask. Which statement is correct about the repeated
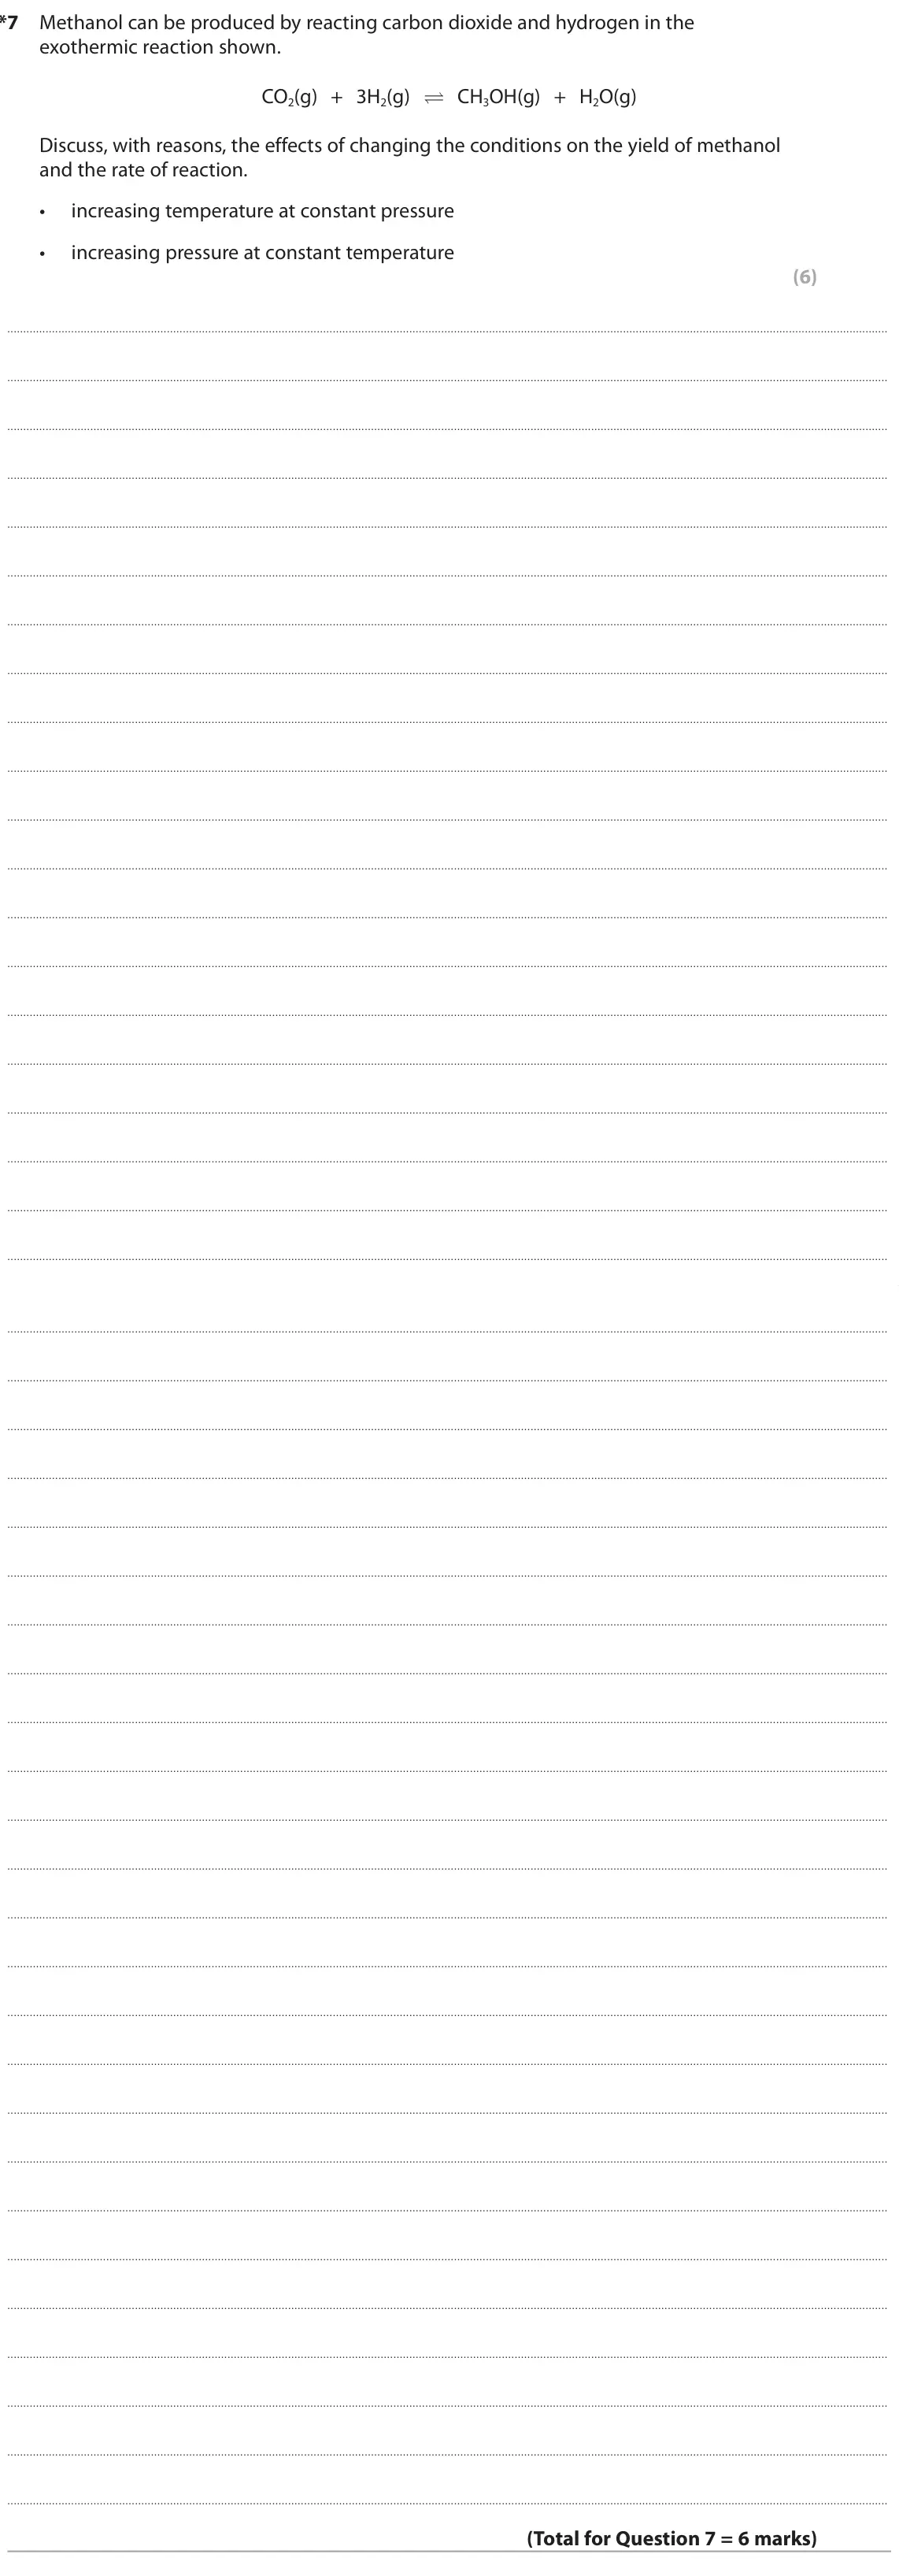
- June 2024, AS Paper 2, Q7 (6 marks): *7 Methanol can be produced by reacting carbon dioxide and hydrogen in the exothermic reaction shown. CO2(g) + 3H2(g) CH3OH(g) + H2O(g) Discuss, with reasons,
- June 2023, Paper 2, Q5(d)(i) (3 marks): Complete the labelled reaction profile for the catalysed reaction. (3) 2NO(g) + 2CO(g) Enthalpy Progress of reaction
- June 2023, Paper 2, Q5(d)(ii) (2 marks): Catalysts, such as platinum, are very expensive. Explain an economic benefit of using a catalyst in an industrial process. (2)
- June 2023, Paper 3, Q8(b)(i) (1 mark): Add a curve to show the distribution at a temperature of 308 K. (1)
- June 2023, Paper 3, Q8(b)(ii) (2 marks): Explain why a temperature rise from 298 K to 308 K results in a large increase in the rate of reaction. Refer to the Maxwell‑Boltzmann distribution in your answ
- June 2023, AS Paper 2, Q1 (2 marks): This question is about collision theory. The Maxwell-Boltzmann distribution of molecular energies for a reaction at a particular temperature is shown in the gra
- June 2022, AS Paper 2, Q1(a)(i) (1 mark): The activation energy is the minimum energy required (1) A for a reaction to take place when reactant molecules collide B for reactant molecules to collide C fo
- June 2022, AS Paper 2, Q1(a)(ii) (2 marks): Explain, with reference to the gaseous particles, the differences in the two distributions. (2)
- June 2022, AS Paper 2, Q1(a)(iii) (1 mark): Which of the following is not an explanation of why increasing the temperature increases the rate of a reaction? (1) A the area under the curve to the right of
- June 2022, AS Paper 2, Q1(b)(i) (4 marks): Draw fully labelled reaction profiles for the reaction both with and without a catalyst for an exothermic reaction. (4) Energy Reaction progress
- June 2022, AS Paper 2, Q1(b)(ii) (1 mark): State how a catalyst increases the rate of a chemical reaction. (1)
- June 2022, AS Paper 2, Q1(c) (1 mark): A heterogeneous catalyst is often added to a reaction between gases. A heterogeneous catalyst (1) A increases the rate without taking part in the reaction B inc
- November 2021, Paper 3, Q4(a) (3 marks): Draw curves on the graph to show the results you would expect for Experiments 2, 3 and 4. Label the curves 2, 3 and 4. (3)
- November 2021, Paper 3, Q4(b) (3 marks): Determine the initial rate of reaction for Experiment 1. You must show your working on the graph. Include units in your answer. (3) 1.0 0.8 0.6 Experiment 1 Los
- November 2021, Paper 3, Q4(c) (4 marks): A student was required to devise an alternative method of carrying out this experiment that involved collecting the gas produced. Outline the procedure that the
- November 2021, AS Paper 2, Q3 (1 mark): The Maxwell‑Boltzmann distribution of molecular energies for the reactant molecules in an uncatalysed reaction is shown. Number of molecules with energy E Kinet
- November 2021, AS Paper 2, Q6(a) (3 marks): Calculate the rate of reaction at 50 s. Show your working on the graph. Include units with your final answer. (3) Rate of reaction at 50 s =
- November 2021, AS Paper 2, Q9(c)(i) (2 marks): Give a reason why the catalyst is warmed and a reason why the catalyst may melt. (2)
- November 2021, AS Paper 2, Q9(c)(ii) (2 marks): Complete the reaction profile for this catalysed oxidation of ammonia, showing the enthalpy change, ΔrH. (2) Reactants Enthalpy Reaction path
- November 2021, AS Paper 2, Q9(c)(iii) (3 marks): Describe the processes that occur on the surface of a heterogeneous catalyst during the oxidation of ammonia in air. (3)
- October 2020, Paper 2, Q9(a)(i) (1 mark): Give the label for the vertical axis. (1)
- October 2020, Paper 2, Q9(a)(ii) (2 marks): Draw a second curve on the same set of axes for the same gas at a lower temperature, T2. (2)
- October 2020, Paper 2, Q9(a)(iii) (2 marks): Explain, in terms of collisions and energy, why lowering the temperature decreases the rate of reaction. (2)
- October 2020, Paper 2, Q9(a)(iv) (1 mark): A catalyst is added to the gas. Label the diagram above with the symbol Ecat to show a possible activation energy for the reaction in the presence of a catalyst
- October 2020, AS Paper 2, Q3(a) (1 mark): The best way to describe the activation energy of a reaction is (1) A the average energy of the particles when they react B the difference in energy between the
- October 2020, AS Paper 2, Q3(b)(i) (1 mark): In which diagram does the arrow represent the activation energy for the backward reaction when a catalyst is present? (1) A B 500 500 400 400 300 300 Enthalpy E
- October 2020, AS Paper 2, Q3(b)(ii) (1 mark): Estimate, using the diagram, the decrease in the activation energy for the forward reaction when a catalyst is added. (1) 500 450 400 350 300 reactants Enthalpy
- October 2020, AS Paper 2, Q3(c) (1 mark): State why a solid (heterogeneous) catalyst is suitable for a reaction in the gas phase. (1)
- October 2020, AS Paper 2, Q3(d)(i) (1 mark): Which is the area of the graph corresponding to the number of molecules with sufficient energy to react when a catalyst is present? (1) A Y B Y − Z C Y + Z D Z
- October 2020, AS Paper 2, Q3(d)(ii) (1 mark): Which would always result in a decrease in the number of molecules contained within area Y? (1) A decreasing the temperature of the gas B increasing the pressur
- October 2020, AS Paper 2, Q4(b)(i) (4 marks): Explain the effects of increasing the pressure on the yield of the products and on the rate of the reaction in Step 1. (4)
- October 2020, AS Paper 2, Q4(b)(ii) (3 marks): Step 2 is carried out at a compromise temperature of 500 K. Explain why 500 K is considered to be a compromise for Step 2 by considering what would happen at hi
- October 2020, AS Paper 2, Q6(a) (2 marks): Complete the diagram to show how the gas can be collected and its volume measured, labelling the apparatus used. (2) aqueous hydrogen peroxide manganese(IV) oxi
- October 2020, AS Paper 2, Q6(b)(i) (1 mark): The rate of reaction may be assumed to be approximately constant up to the first volume measurement (20.0 s in this experiment). Use this approximation to calcu
- October 2020, AS Paper 2, Q6(b)(ii) (2 marks): Draw a tangent at 40 s on the graph on Page 20 and use it to calculate the rate of reaction at this time. (2)
- October 2020, AS Paper 2, Q6(b)(iii) (2 marks): The experiment was repeated on a different day when the laboratory was 20 °C warmer. The volume of oxygen was recorded for the same total time of 150 s. Draw th
- October 2020, AS Paper 2, Q6(b)(iv) (2 marks): Explain, using collision theory, any differences between the line you have drawn and the original line of best fit. (2)
- October 2020, AS Paper 2, Q6(c) (4 marks): Catalysts are not used up during a reaction. Manganese(IV) oxide acts as a heterogeneous catalyst. Describe in outline a method to show that the manganese(IV) o
- June 2019, AS Paper 2, Q4(c) (2 marks): Explain why, in the industrial process involving this reaction, a catalyst is used. (2)
- June 2019, AS Paper 2, Q8(a)(i) (2 marks): Complete the graph of concentration against time by adding the six missing points. Draw a line to pass through all the points. (2) Graph of concentration of Y a
- June 2019, AS Paper 2, Q8(a)(ii) (4 marks): Describe how you would find a numerical value for the initial rate of reaction and for the maximum rate of reaction in this experiment from the graph. No actual
- June 2019, AS Paper 2, Q8(b) (2 marks): For many reactions, the values of the initial rate and the maximum rate are the same. Explain why the values of the two reaction rates obtained in this experime
- June 2019, AS Paper 2, Q8(c) (1 mark): Give a reason why the measurement of the initial rate of reaction is likely to be less accurate than the measurement of the maximum rate. (1)
- June 2018, Paper 2, Q4(d) (1 mark): The Maxwell-Boltzmann distribution diagram shows the molecular energies for the gaseous system immediately after the airbag has been deployed. Number of molecul
- June 2018, Paper 3, Q3(d)(iii) (2 marks): This question is about the identification of a Group 2 carbonate. A chemistry teacher found a bottle containing lumps of a white solid. The original label was m
- June 2018, AS Paper 2, Q3(c)(ii) (2 marks): Explain the effect, if any, of an increase in pressure on the rate of this reaction. (2)
- June 2018, AS Paper 2, Q3(c)(iii) (2 marks): The platinum-rhodium catalyst used in this reaction is a heterogeneous catalyst. State what is meant by the term ‘heterogeneous’ and why a catalyst has no effec
- June 2018, AS Paper 2, Q3(d) (1 mark): The diagram shows a Maxwell-Boltzmann distribution of particle energies, including the activation energy, Ea , for a reaction. (1) Number of particles with Ea e
- June 2018, AS Paper 2, Q5(c)(i) (2 marks): In stage 1, chlorine is reacted with ethene at a temperature between 50 °C and 80 °C CH2Cl ΔH = −178 kJ mol−1 Cl2 + CH2 CH2 CH2Cl Give one reason why a temper
- June 2017, Paper 2, Q5(b) (1 mark): Which area in the Maxwell-Boltzmann distribution diagram represents the increase in the number of particles with sufficient energy to react in the presence of a
- June 2017, AS Paper 2, Q6(a) (6 marks): Evaluate the feasibility of each of these changes in terms of their effect on the rate, yield and economics of the reaction. (6)
- June 2017, AS Paper 2, Q6(b)(i) (3 marks): On the axes provided, sketch the reaction profiles for the uncatalysed and catalysed reaction. 2SO2(g) + O2(g) ` _ 2SO3(g) ǻrH = –197 kJ mol–1 Label the uncatal
- June 2017, AS Paper 2, Q6(b)(ii) (2 marks): On your reaction profile, identify and label both the enthalpy change and the activation energy for the catalysed reaction. (2)
- June 2017, AS Paper 2, Q7(b)(i) (3 marks): Draw a graph of [1-bromo-2-methylpropane] against time. (3)
- June 2017, AS Paper 2, Q7(b)(ii) (3 marks): Use your graph to calculate a value for the rate of reaction at 100 s. Include units in your answer. (3)
- June 2016, AS Paper 2, Q3(b)(i) (1 mark): On the graph, draw the Maxwell-Boltzmann distribution for the same system at a higher temperature. (1)
- June 2016, AS Paper 2, Q3(b)(ii) (3 marks): Use the graph to explain why a small increase in temperature results in a large increase in the rate of a gaseous reaction. (3)
Questions, mark schemes and examiner’s reports are © Pearson Edexcel, from their published past papers. Plumi isn’t affiliated with any exam board. Want whole papers? Every Edexcel A-Level Chemistry paper.
Rather write your answers by hand on iPad? Plumi marks them against the same mark schemes.