 plumi
National and global energy resources: AQA GCSE Physics questions
Every AQA GCSE Physics exam question on 4.1.3 National and global energy resources, 2018–2025, with its mark scheme and examiner’s report.
Find questions1,653
Calculations
Q01.1
The whole paper ↗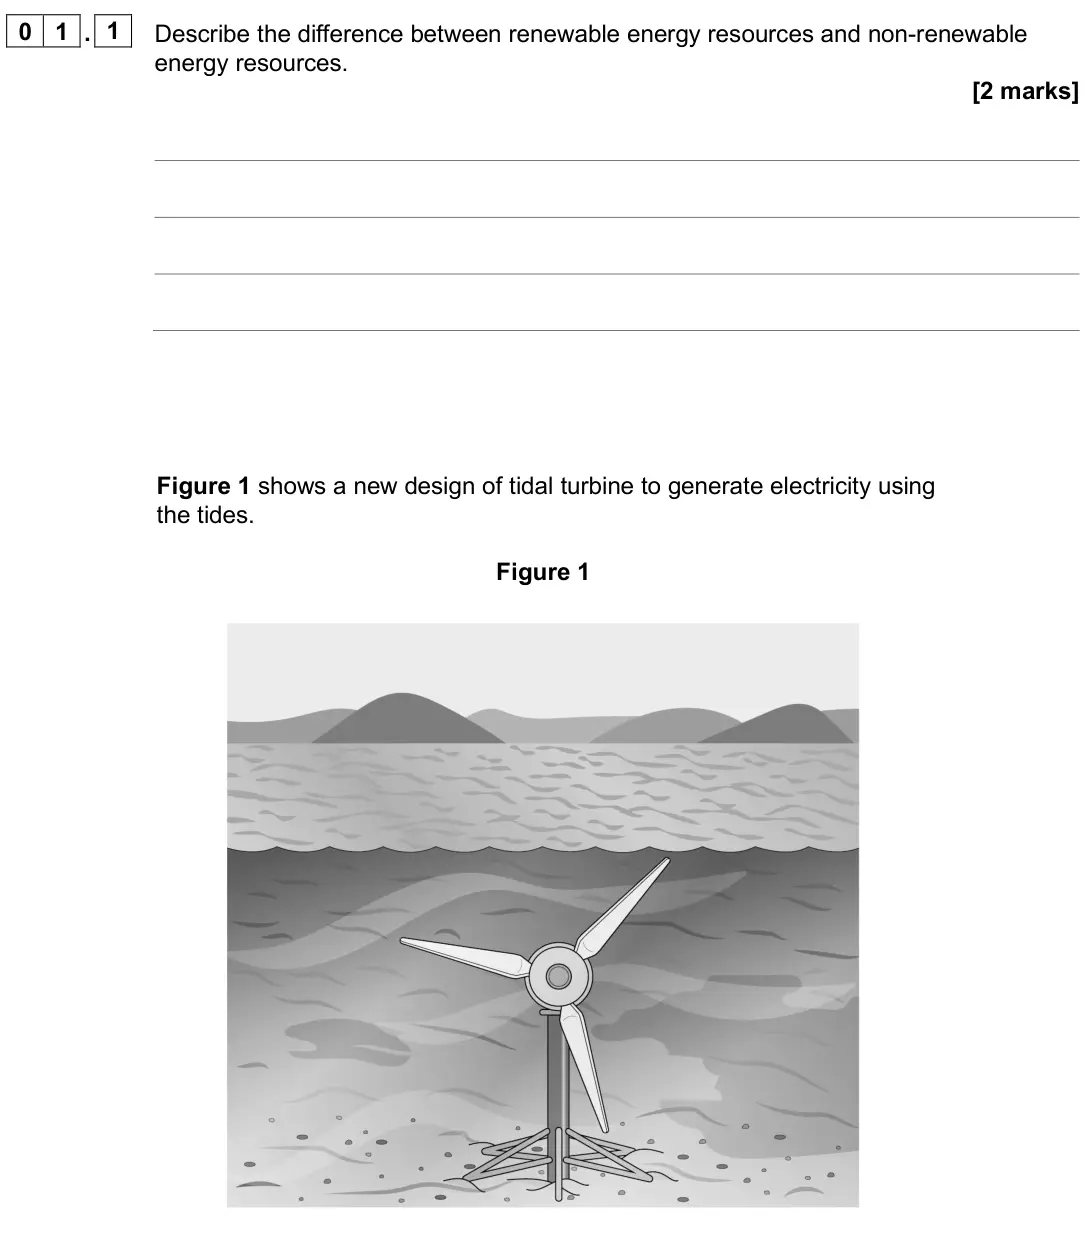
Q01.4
The whole paper ↗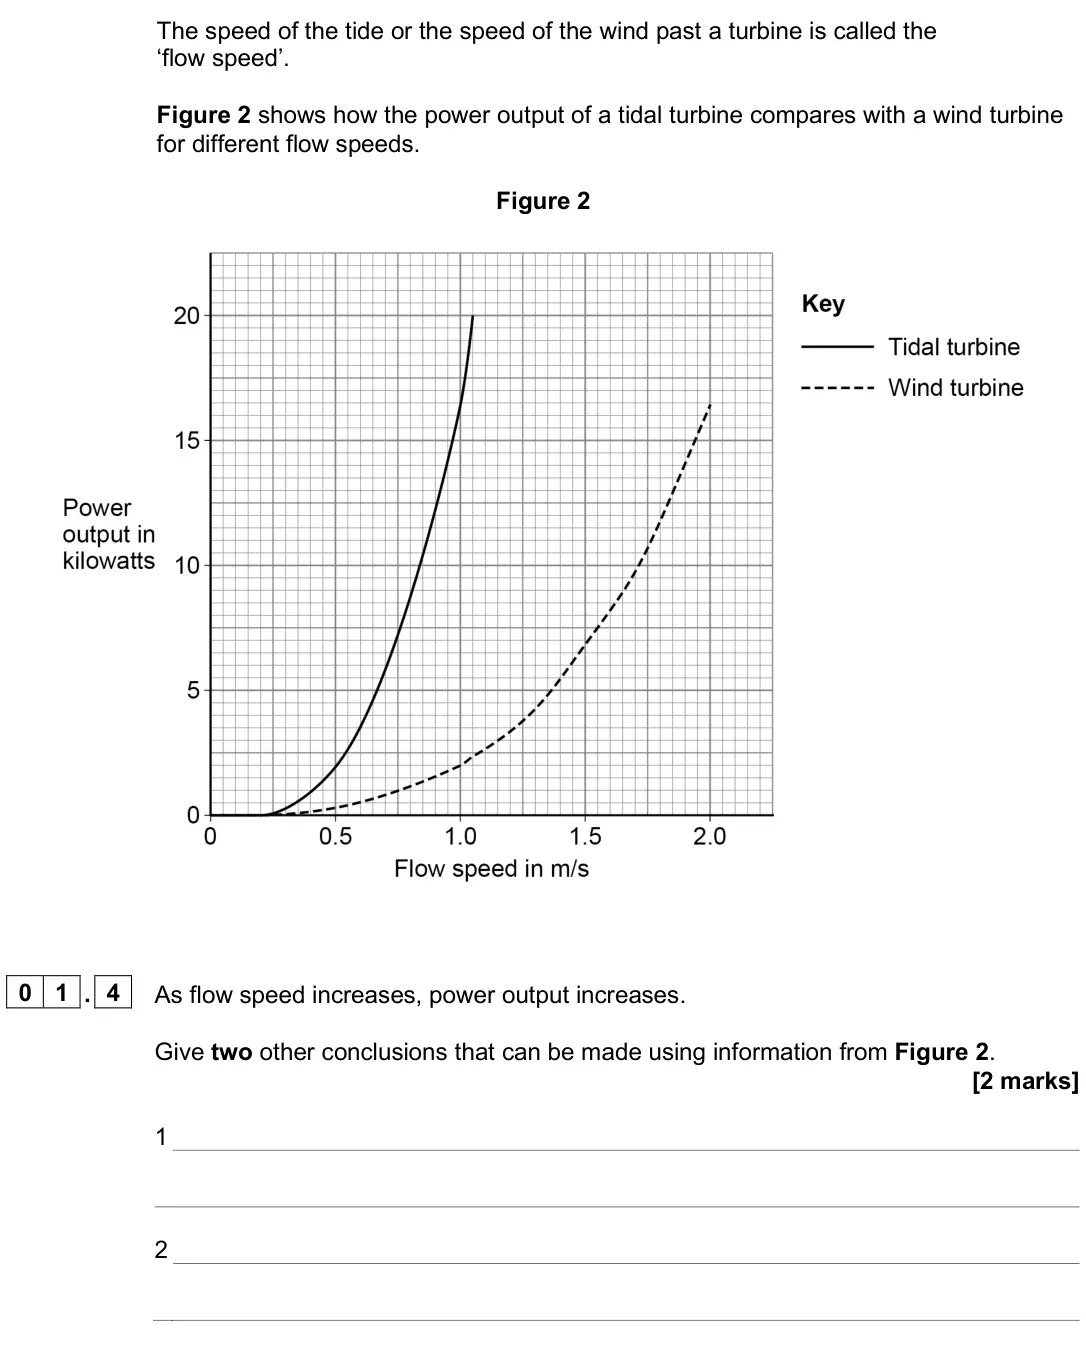
Q01.5
The whole paper ↗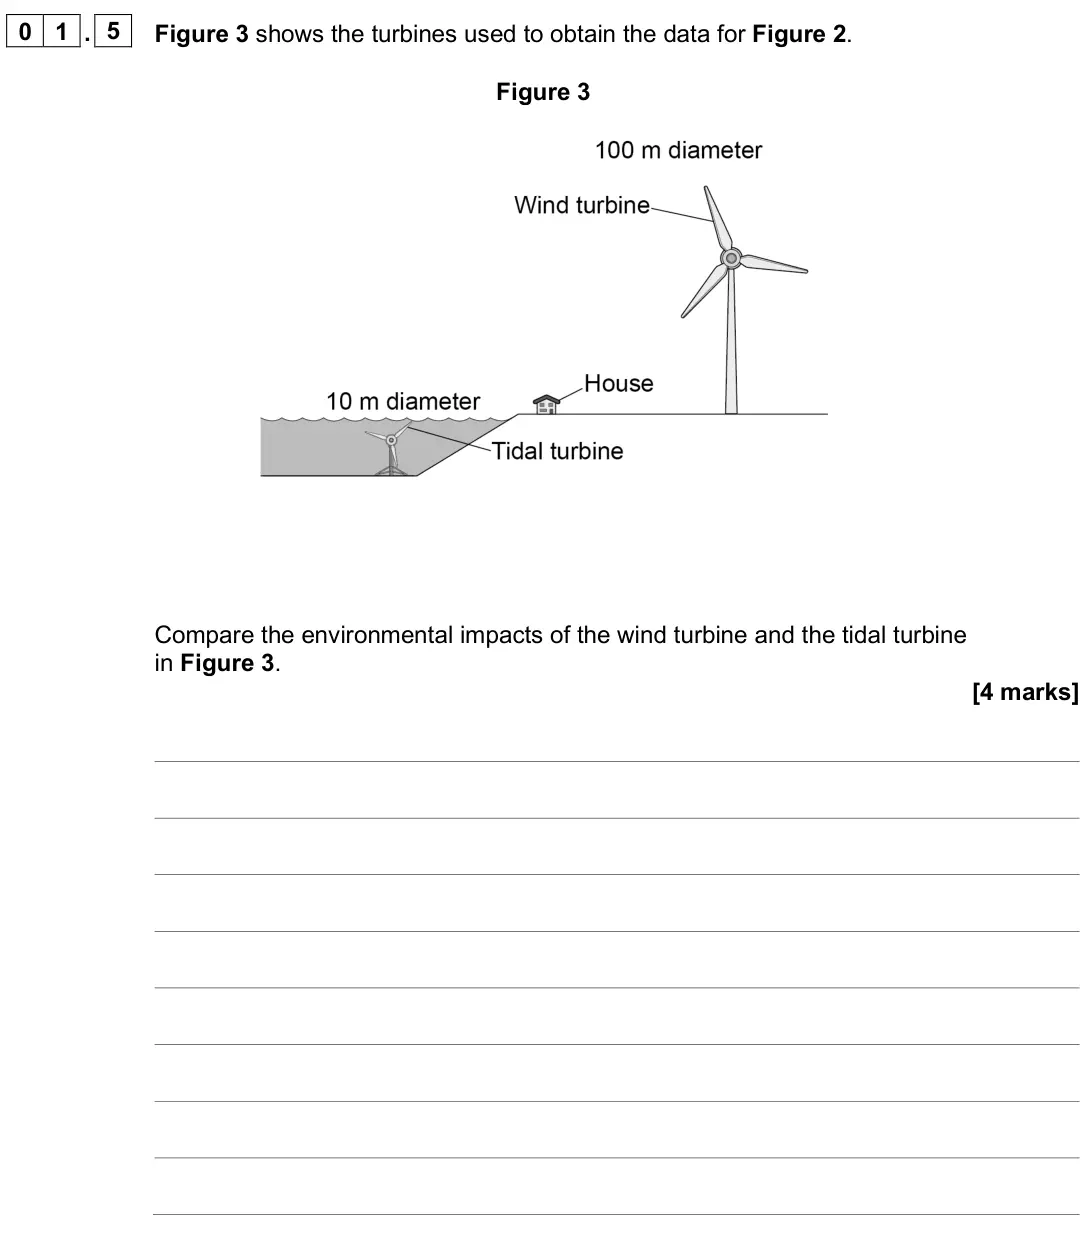
Q04.1
The whole paper ↗
Q04.2
The whole paper ↗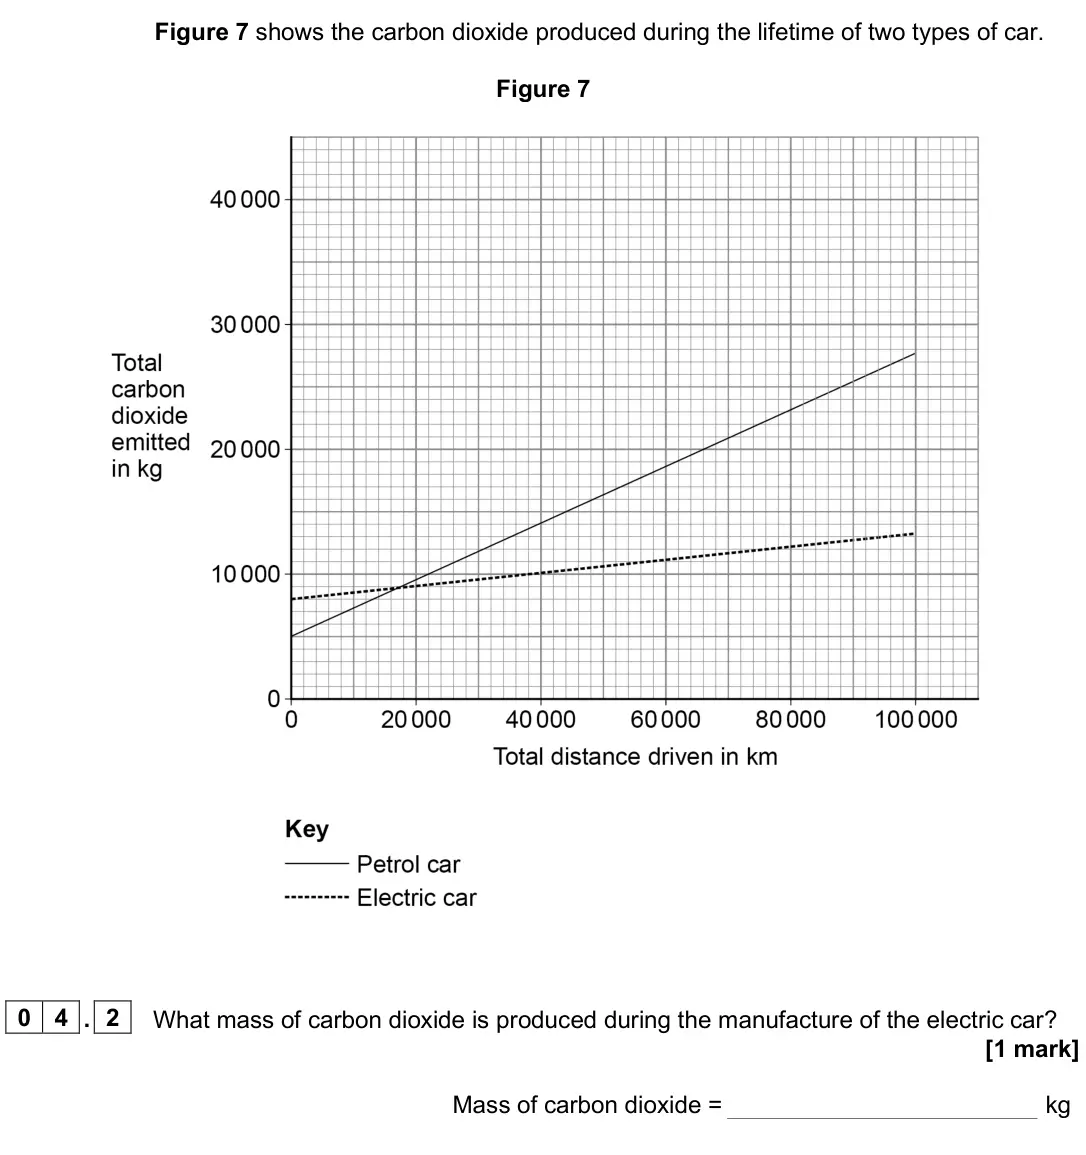
Q04.3
The whole paper ↗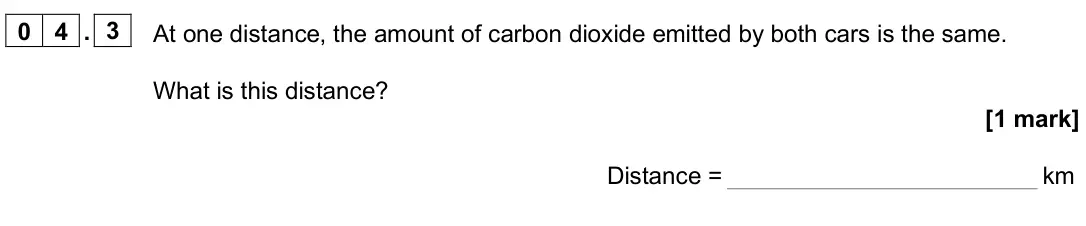
Q04.4
The whole paper ↗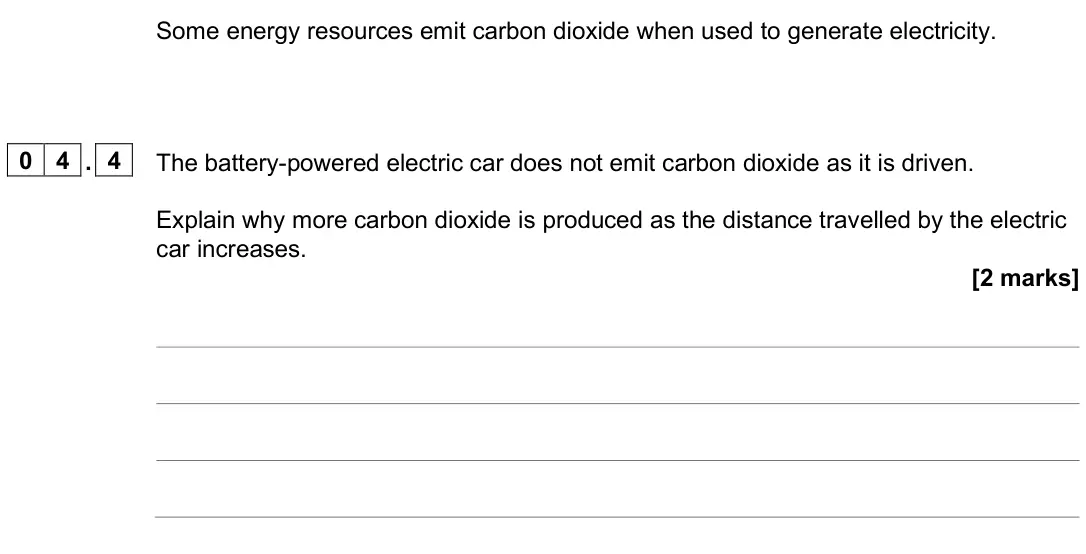
Q04.5
The whole paper ↗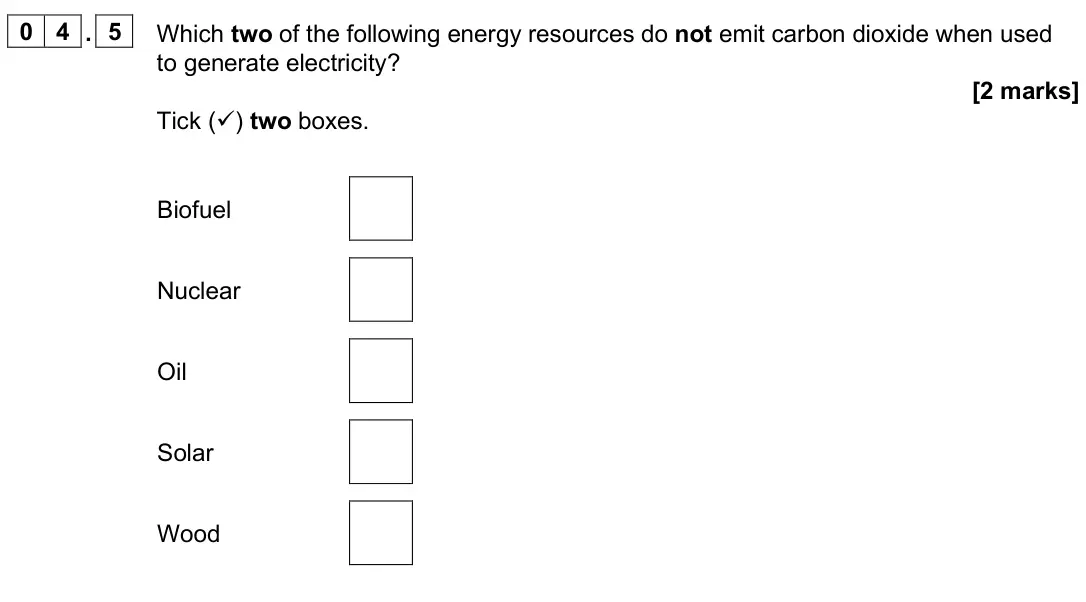
Q01.1
The whole paper ↗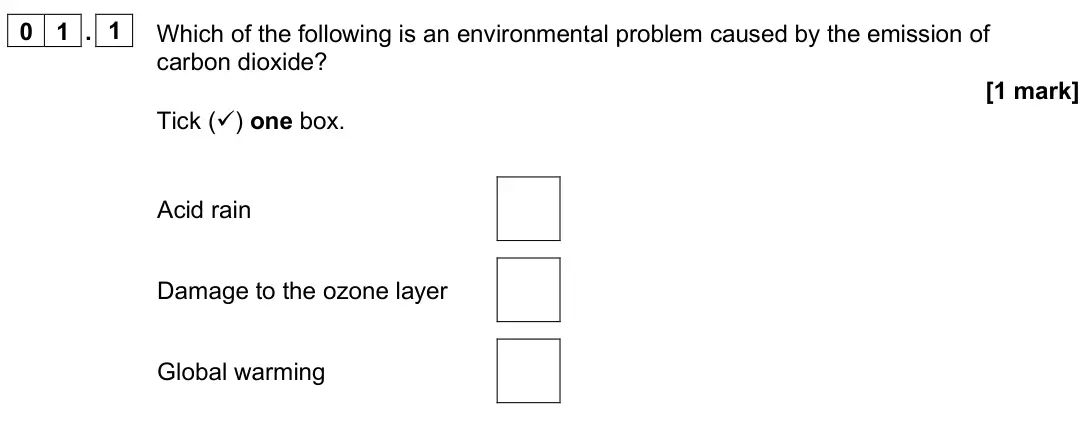
Q01.2
The whole paper ↗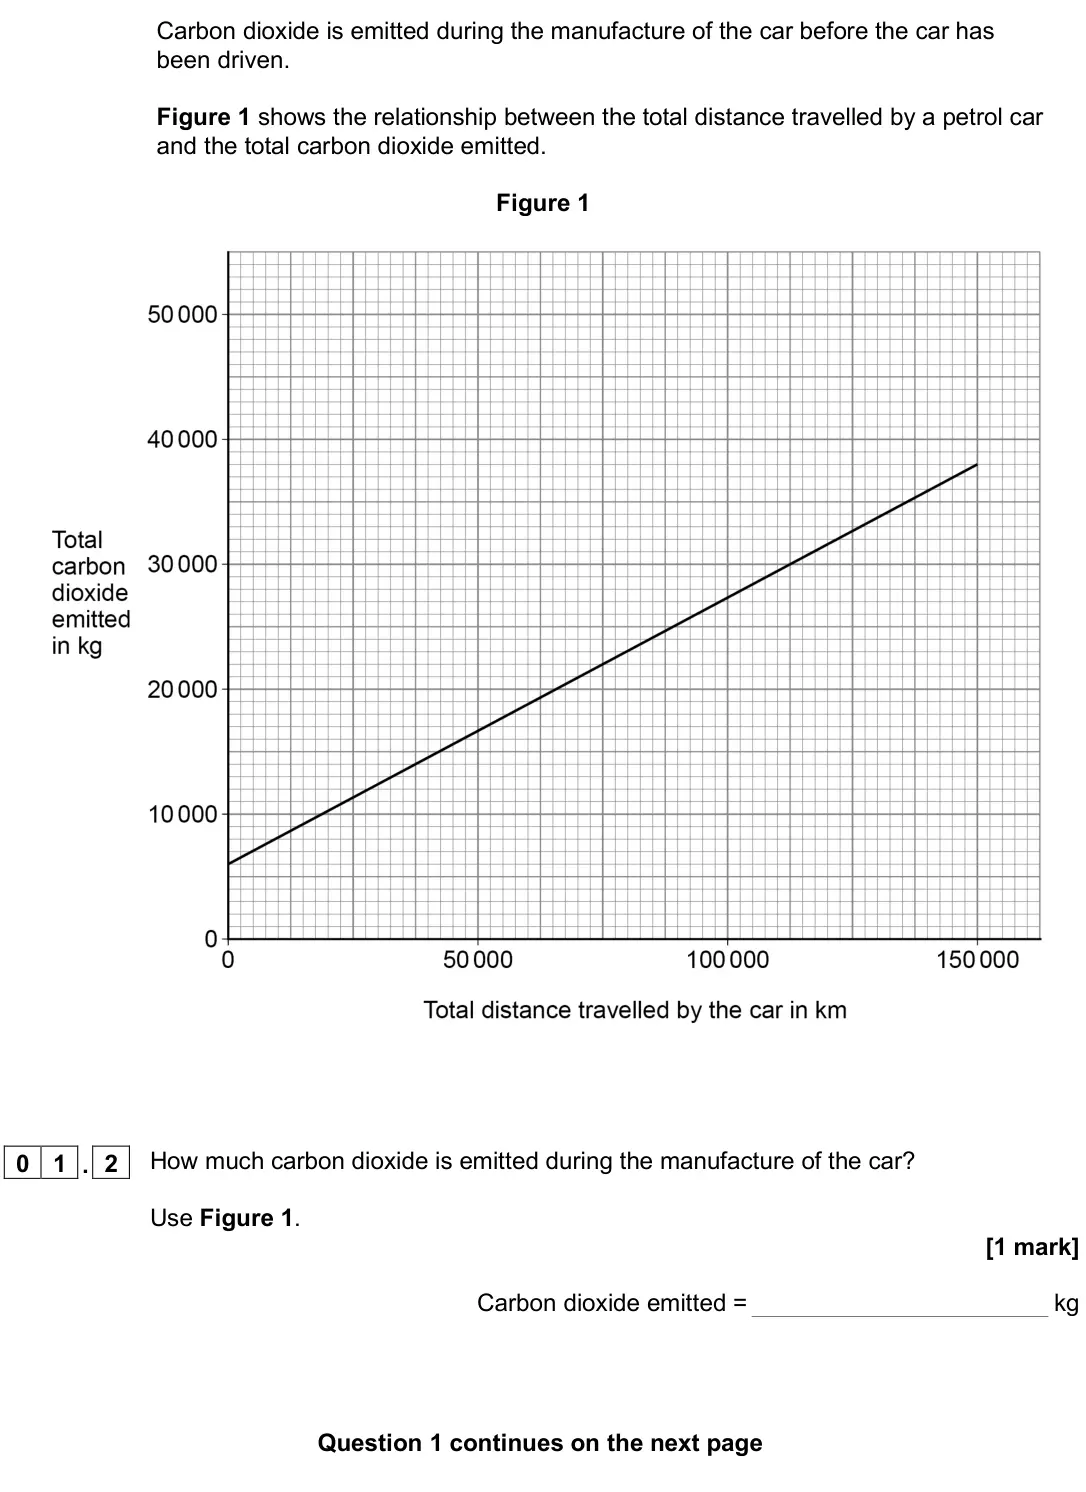
Q01.3
The whole paper ↗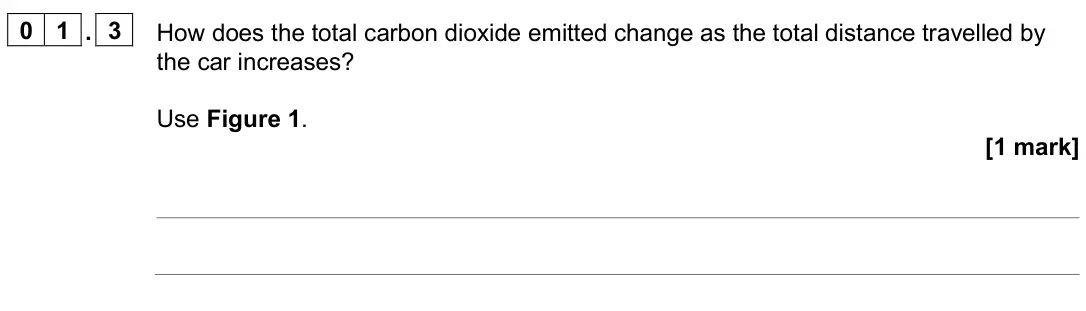
Q01.4
The whole paper ↗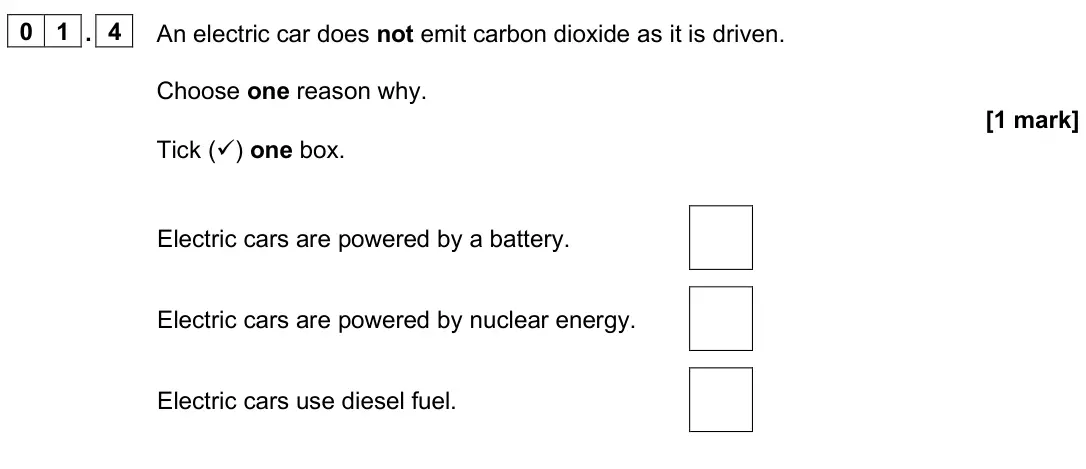
Q01.5
The whole paper ↗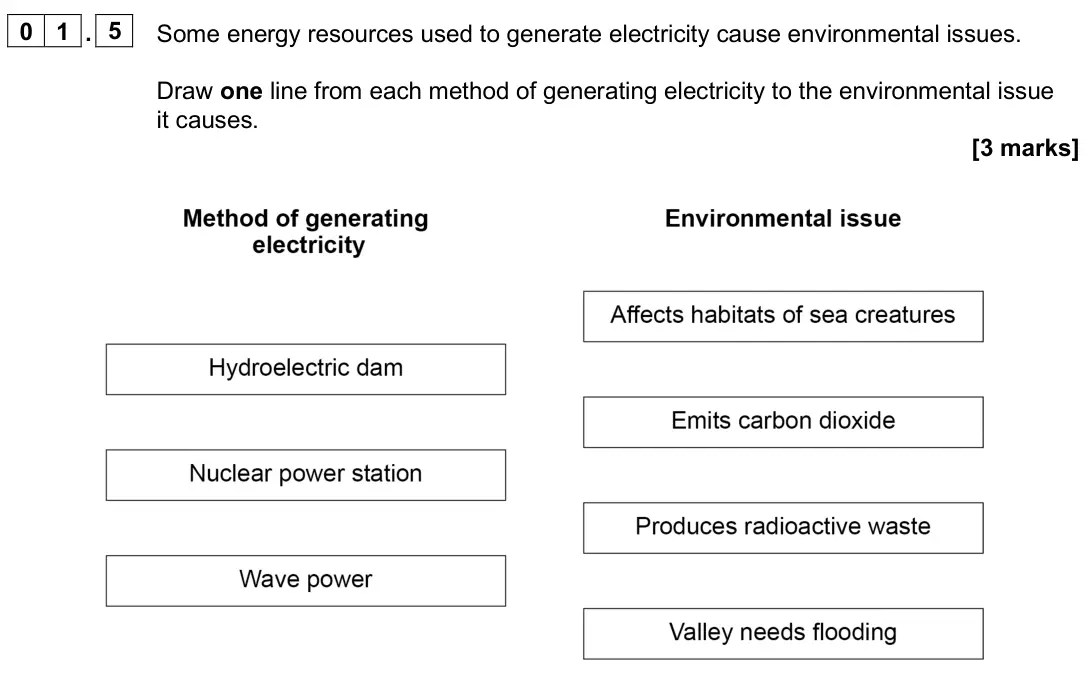
Q08.1
The whole paper ↗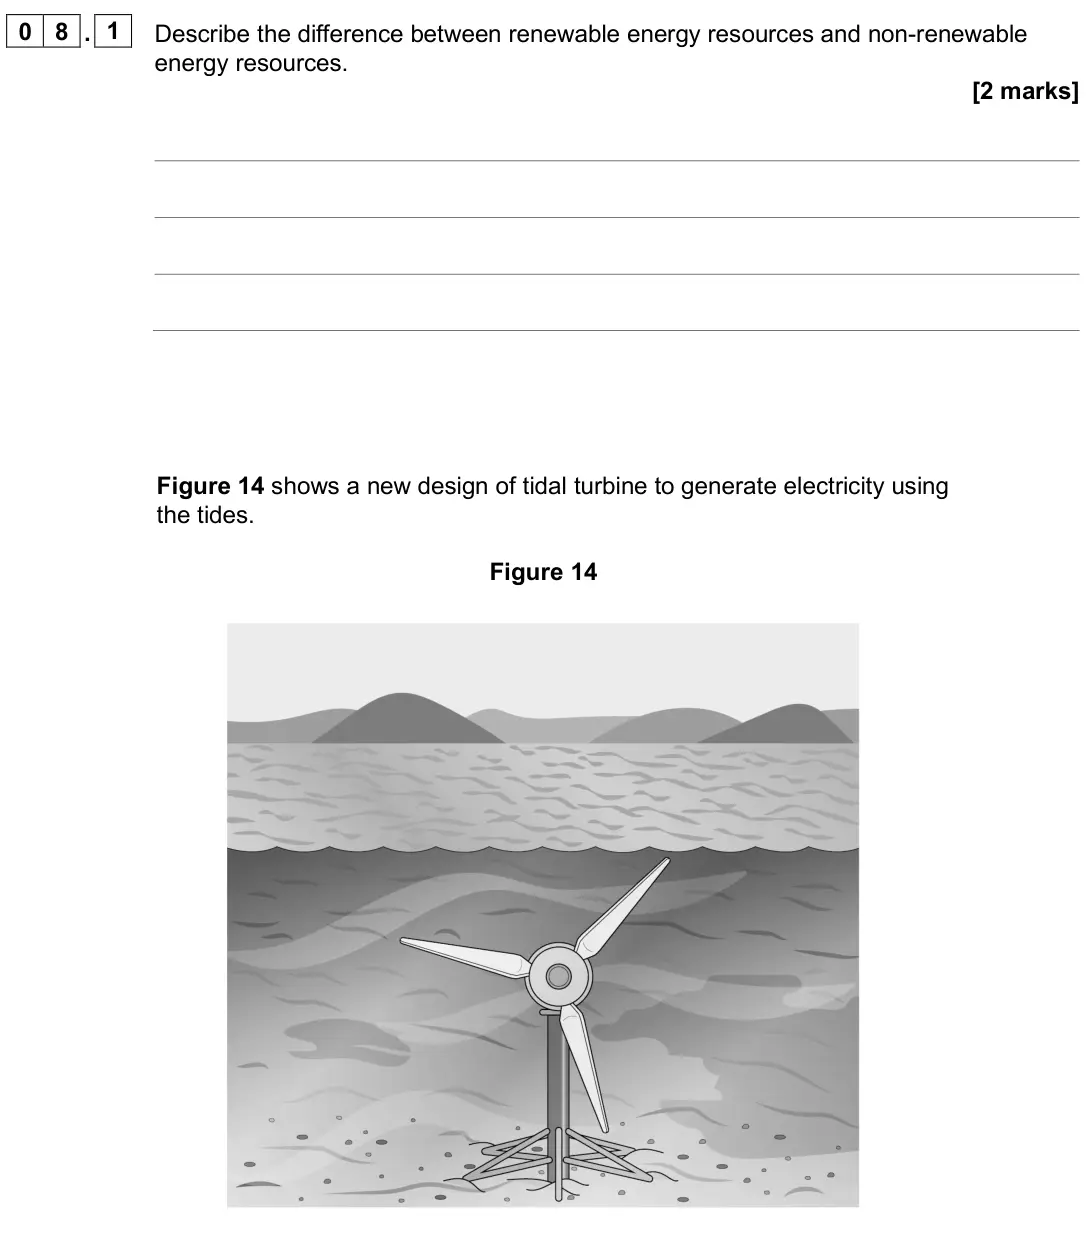
Q08.4
The whole paper ↗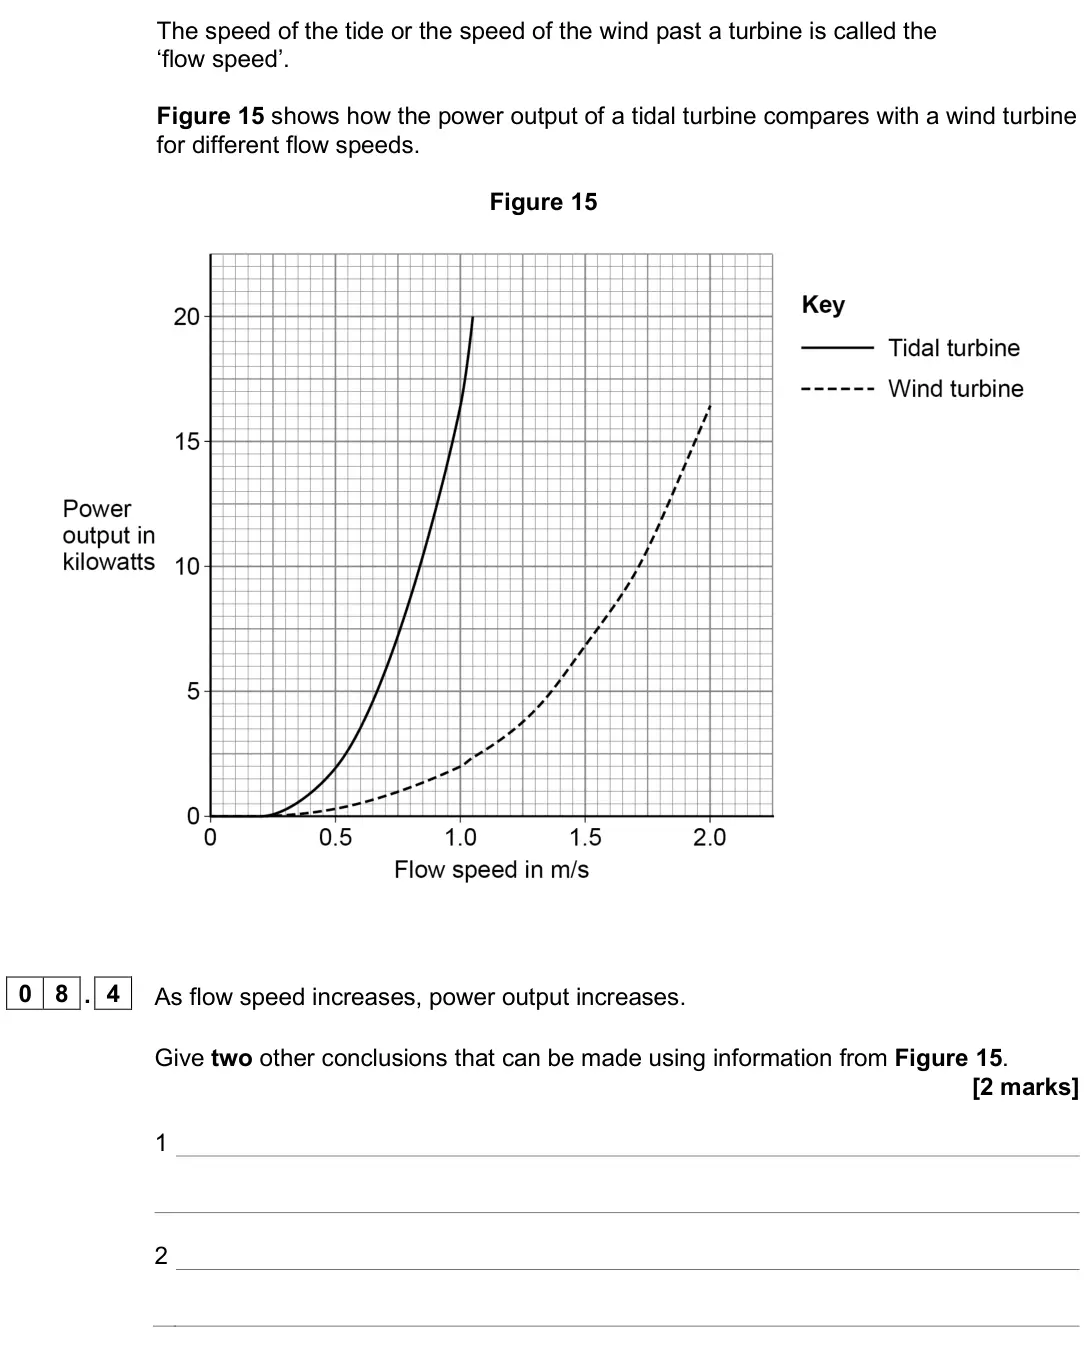
Q08.5
The whole paper ↗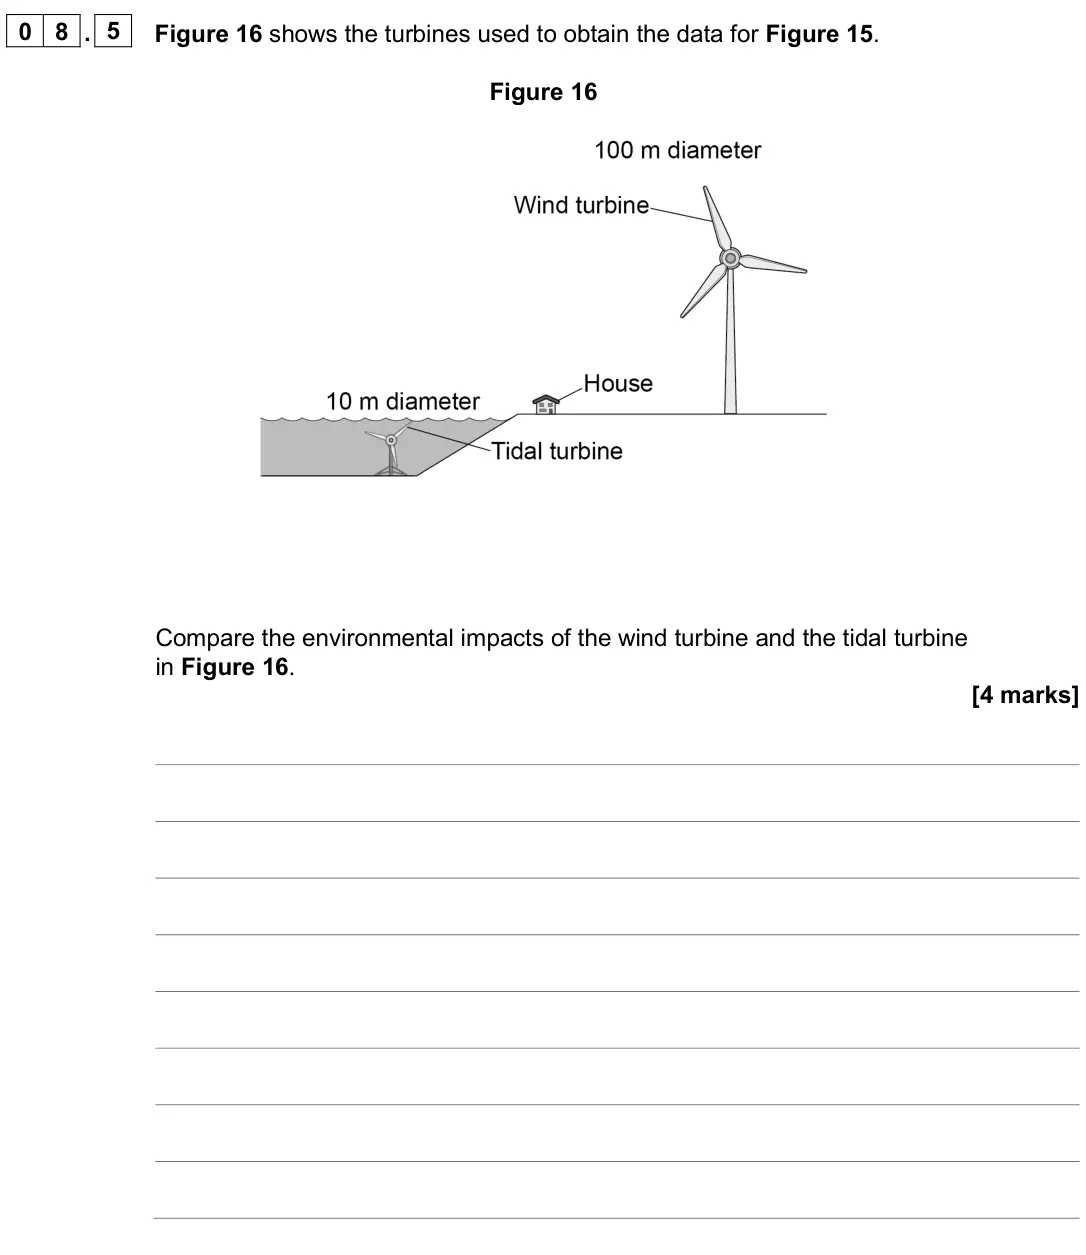
Q01.4
The whole paper ↗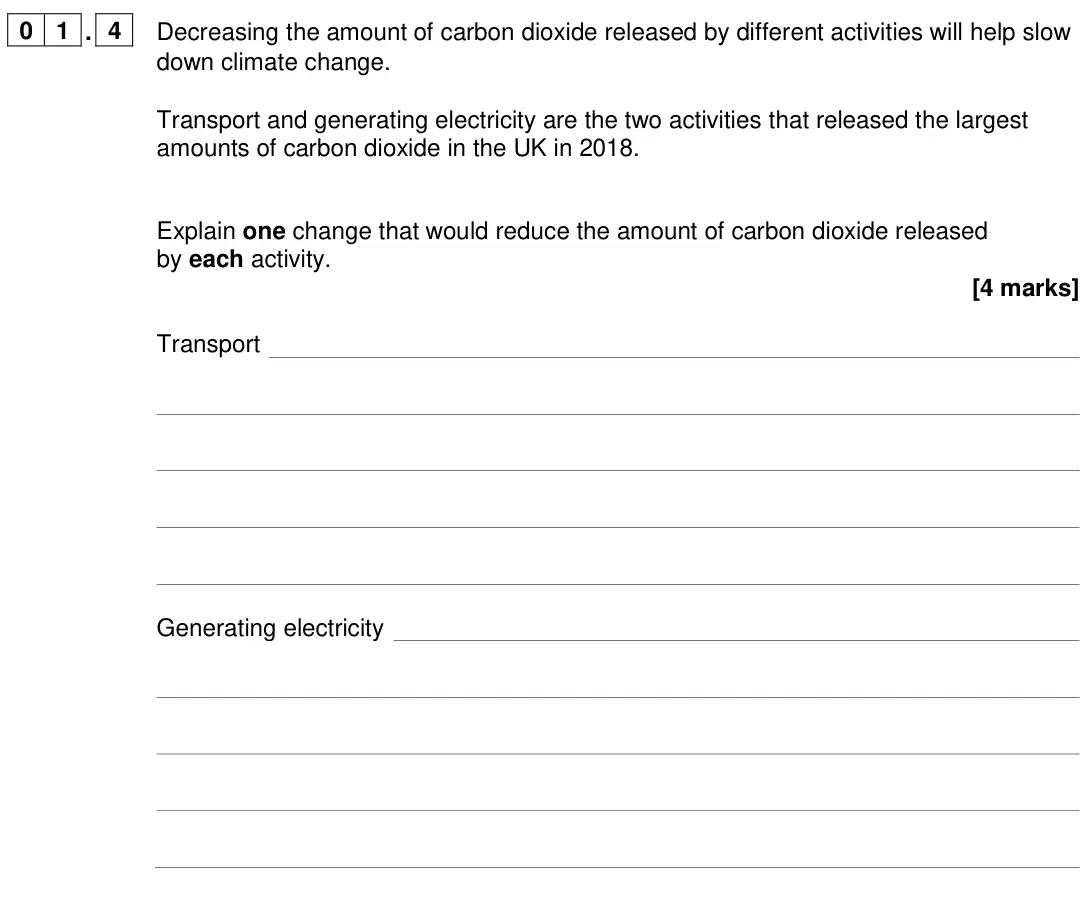
Q02.5
The whole paper ↗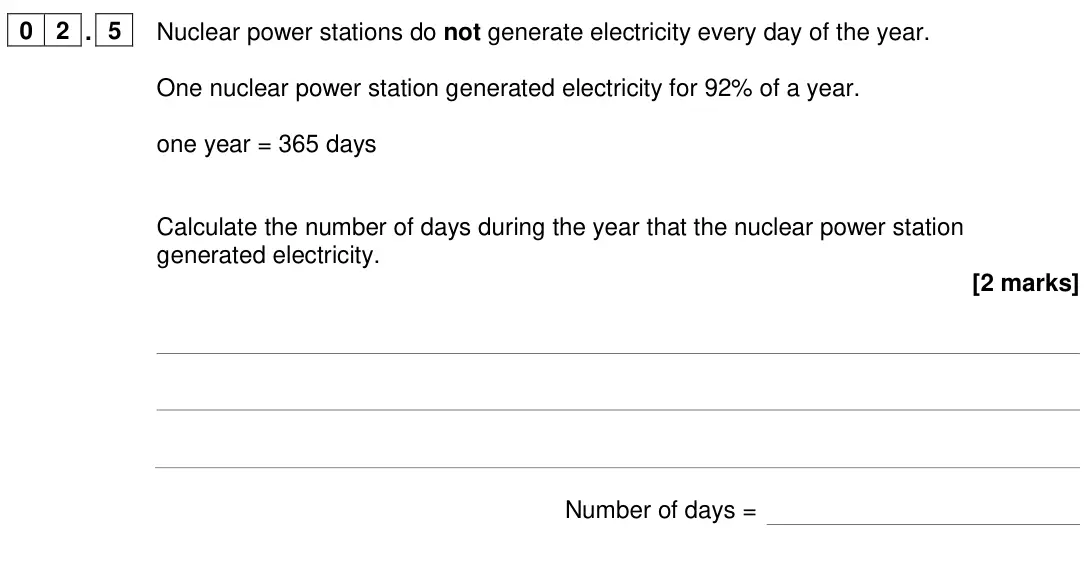
Q09.4
The whole paper ↗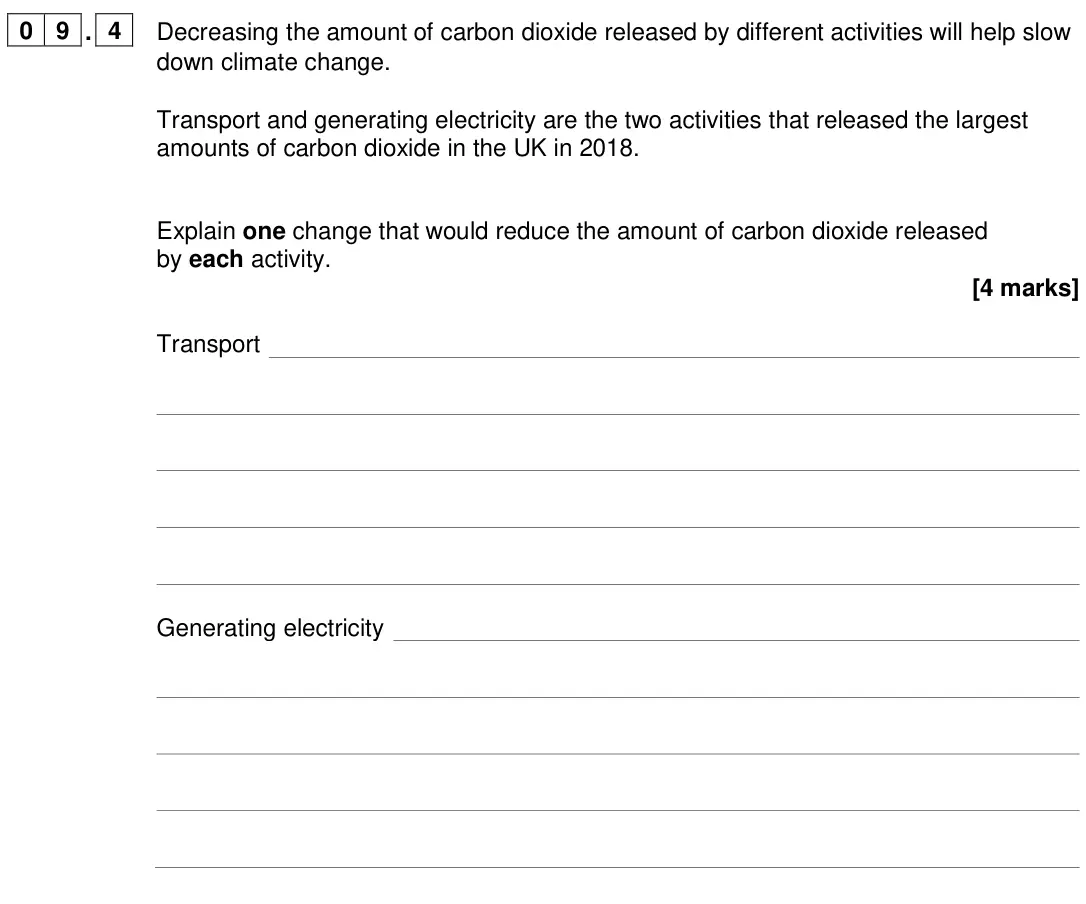
Q10.5
The whole paper ↗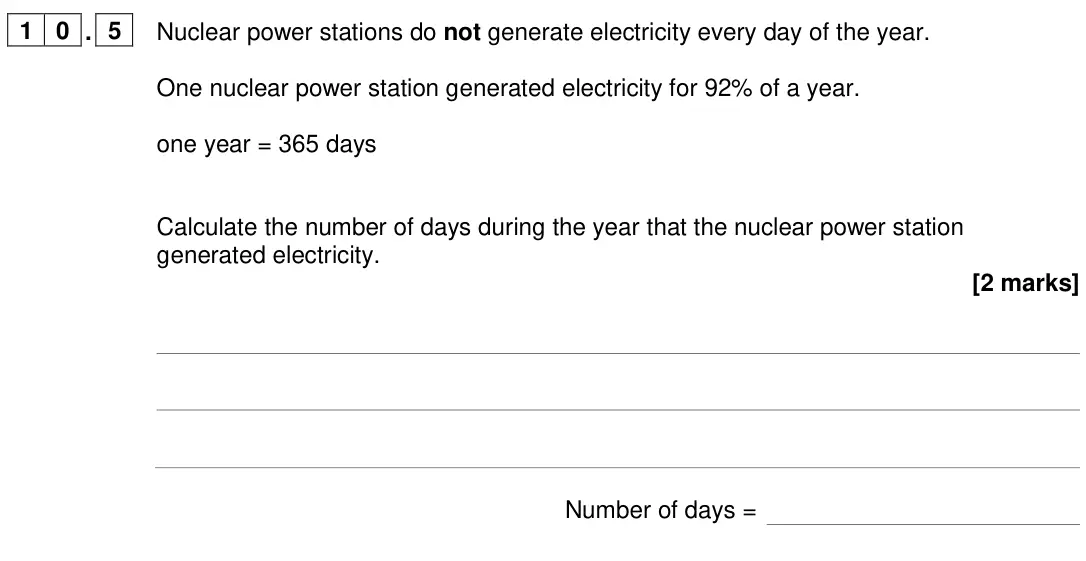
All 65 questions on National and global energy resources, as a list
- June 2025, Paper 1 Higher, Q01.1 (2 marks): Describe the difference between renewable energy resources and non-renewable energy resources. [2 marks] Figure 1 shows a new design of tidal turbine to generat
- June 2025, Paper 1 Higher, Q01.4 (2 marks): As flow speed increases, power output increases. Give two other conclusions that can be made using information from Figure 2. [2 marks] 1 2
- June 2025, Paper 1 Higher, Q01.5 (4 marks): Figure 3 shows the turbines used to obtain the data for Figure 2. Figure 3 Compare the environmental impacts of the wind turbine and the tidal turbine in Figure
- June 2025, Paper 1 Higher, Q04.1 (2 marks): Explain one environmental problem caused by the emission of carbon dioxide. [2 marks]
- June 2025, Paper 1 Higher, Q04.2 (1 mark): What mass of carbon dioxide is produced during the manufacture of the electric car? [1 mark] Mass of carbon dioxide = kg
- June 2025, Paper 1 Higher, Q04.3 (1 mark): At one distance, the amount of carbon dioxide emitted by both cars is the same. What is this distance? [1 mark] Distance = km
- June 2025, Paper 1 Higher, Q04.4 (2 marks): The battery-powered electric car does not emit carbon dioxide as it is driven. Explain why more carbon dioxide is produced as the distance travelled by the elec
- June 2025, Paper 1 Higher, Q04.5 (2 marks): Which two of the following energy resources do not emit carbon dioxide when used to generate electricity? [2 marks] Tick () two boxes. Biofuel Nuclear Oil Sola
- June 2025, Paper 1 Foundation, Q01.1 (1 mark): Which of the following is an environmental problem caused by the emission of carbon dioxide? [1 mark] Tick () one box. Acid rain Damage to the ozone layer Glob
- June 2025, Paper 1 Foundation, Q01.2 (1 mark): How much carbon dioxide is emitted during the manufacture of the car? Use Figure 1. [1 mark] Carbon dioxide emitted = kg
- June 2025, Paper 1 Foundation, Q01.3 (1 mark): How does the total carbon dioxide emitted change as the total distance travelled by the car increases? Use Figure 1. [1 mark]
- June 2025, Paper 1 Foundation, Q01.4 (1 mark): An electric car does not emit carbon dioxide as it is driven. Choose one reason why. [1 mark] Tick () one box. Electric cars are powered by a battery. Electric
- June 2025, Paper 1 Foundation, Q01.5 (3 marks): Some energy resources used to generate electricity cause environmental issues. Draw one line from each method of generating electricity to the environmental iss
- June 2025, Paper 1 Foundation, Q08.1 (2 marks): Describe the difference between renewable energy resources and non-renewable energy resources. [2 marks] Figure 14 shows a new design of tidal turbine to genera
- June 2025, Paper 1 Foundation, Q08.4 (2 marks): As flow speed increases, power output increases. Give two other conclusions that can be made using information from Figure 15. [2 marks] 1 2
- June 2025, Paper 1 Foundation, Q08.5 (4 marks): Figure 16 shows the turbines used to obtain the data for Figure 15. Figure 16 Compare the environmental impacts of the wind turbine and the tidal turbine in Fig
- June 2024, Paper 1 Higher, Q01.4 (4 marks): Decreasing the amount of carbon dioxide released by different activities will help slow down climate change. Transport and generating electricity are the two ac
- June 2024, Paper 1 Higher, Q02.5 (2 marks): Nuclear power stations do not generate electricity every day of the year. One nuclear power station generated electricity for 92% of a year. one year = 365 days
- June 2024, Paper 1 Foundation, Q09.4 (4 marks): Decreasing the amount of carbon dioxide released by different activities will help slow down climate change. Transport and generating electricity are the two ac
- June 2024, Paper 1 Foundation, Q10.5 (2 marks): Nuclear power stations do not generate electricity every day of the year. One nuclear power station generated electricity for 92% of a year. one year = 365 days
- June 2023, Paper 1 Higher, Q04.3 (2 marks): Figure 5 shows how the power output of the generator varied during one year. Figure 5 A solar power system is installed in the remote village in addition to the
- June 2023, Paper 1 Foundation, Q04.1 (2 marks): Calculate the percentage of electricity generated using hydroelectric power. [2 marks] Percentage = %
- June 2023, Paper 1 Foundation, Q04.5 (2 marks): The hydroelectric generator is turned by falling river water. Figure 5 shows how the power output of the hydroelectric generator varied during one year. Figure
- June 2022, Paper 1 Higher, Q01.1 (2 marks): Calculate the mean power needed for 1 home. Give your answer in watts. [2 marks] Mean power needed for 1 home = W
- June 2022, Paper 1 Higher, Q01.2 (2 marks): On one day the demand for electricity in the UK was 34 000 MW. Suggest two reasons why wind power was not able to meet this demand. [2 marks] 1 2
- June 2022, Paper 1 Higher, Q01.4 (2 marks): In most homes in the UK there are many different electrical devices. Explain why people should be encouraged to use energy efficient electrical devices. [2 mark
- June 2022, Paper 1 Foundation, Q07.1 (2 marks): Electricity from the power station can be generated using renewable or non-renewable energy resources. Complete Table 2 to show which energy resources are renew
- June 2022, Paper 1 Foundation, Q09.1 (2 marks): Calculate the mean power needed for 1 home. Give your answer in watts. [2 marks] Mean power needed for 1 home = W
- June 2022, Paper 1 Foundation, Q09.2 (2 marks): On one day the demand for electricity in the UK was 34 000 MW. Suggest two reasons why wind power was not able to meet this demand. [2 marks] 1 2
- June 2022, Paper 1 Foundation, Q09.4 (2 marks): In most homes in the UK there are many different electrical devices. Explain why people should be encouraged to use energy efficient electrical devices. [2 mark
- November 2021, Paper 1 Higher, Q02.3 (2 marks): The idea of obtaining power from nuclear fusion was investigated using models. The models were tested before starting to build the first commercial nuclear fusi
- November 2021, Paper 1 Higher, Q02.4 (2 marks): Generating electricity using nuclear fusion will have fewer environmental effects than generating electricity using fossil fuels. Explain one environmental effe
- November 2021, Paper 1 Higher, Q05.4 (2 marks): It is unlikely that all of the electricity that the UK needs can be generated by solar power systems. Explain why. [2 marks]
- November 2021, Paper 1 Foundation, Q06.1 (2 marks): The solar cells on the roof of the house always face in the same direction. Explain one disadvantage caused by the solar cells only facing in one direction. [2
- November 2021, Paper 1 Foundation, Q06.6 (1 mark): Why is it unlikely that all the UK’s electricity needs could be met by solar power systems? [1 mark] Tick () one box. A very large area would need to be covere
- November 2021, Paper 1 Foundation, Q10.3 (2 marks): The idea of obtaining power from nuclear fusion was investigated using models. The models were tested before starting to build the first commercial nuclear fusi
- November 2021, Paper 1 Foundation, Q10.4 (2 marks): Generating electricity using nuclear fusion will have fewer environmental effects than generating electricity using fossil fuels. Explain one environmental effe
- November 2020, Paper 1 Higher, Q03.5 (2 marks): Figure 5 shows how the UK demand for electricity increases and decreases during one day. Figure 5 The hydroelectric power station in Figure 4 can provide 1.5 ×
- November 2020, Paper 1 Higher, Q04.1 (2 marks): Determine the percentage increase in electricity generated using gas-fired power stations from 2014 to 2018. [2 marks] Percentage increase = %
- November 2020, Paper 1 Higher, Q04.2 (2 marks): Give two environmental advantages of using a gas-fired power station to generate electricity compared with using a coal-fired power station. [2 marks] 1 2
- November 2020, Paper 1 Higher, Q04.3 (2 marks): A student does not believe that climate change is occurring. Explain how the data in Figure 7 suggests the student is wrong. [2 marks]
- November 2020, Paper 1 Foundation, Q01.2 (2 marks): Calculate how many times greater the percentage of electricity generated by gas-fired power stations was in 2018 than in 2014. [2 marks] Number of times greater
- November 2020, Paper 1 Foundation, Q01.3 (2 marks): Explain one environmental effect of generating electricity using a gas-fired power station. [2 marks]
- November 2020, Paper 1 Foundation, Q01.4 (1 mark): The UK government wants more electricity to be generated using renewable energy resources. What is a renewable energy resource? [1 mark] Tick () one box. An en
- November 2020, Paper 1 Foundation, Q01.5 (2 marks): An offshore wind farm is a group of wind turbines that are placed out at sea. Figure 3 shows the power output of an offshore wind farm compared with a wind farm
- November 2020, Paper 1 Foundation, Q10.5 (2 marks): Figure 15 shows how the UK demand for electricity increases and decreases during one day. Figure 15 The hydroelectric power station in Figure 14 can provide 1.5
- June 2019, Paper 1 Foundation, Q05.1 (2 marks): The UK government plans to stop using coal-fired power stations by 2025. Explain one environmental problem caused when electricity is generated by burning coal.
- June 2019, Paper 1 Foundation, Q05.2 (2 marks): Give two renewable energy resources that could make up the ‘Other’ energy resources in Figure 6. [2 marks] 1 2
- June 2019, Paper 1 Foundation, Q05.3 (2 marks): Determine the percentage of electricity generated in nuclear power stations that day. Use data from Figure 6. [2 marks] Percentage of electricity generated in n
- June 2019, Paper 1 Foundation, Q05.4 (2 marks): What was the difference between the maximum demand and minimum demand for electricity during this day? [2 marks] Difference = MW
- June 2019, Paper 1 Foundation, Q05.5 (2 marks): Figure 7 shows that the demand for electricity increased between 06:00 and 09:00 Solar power could have met the demand if there were enough solar panels install
- June 2019, Paper 1 Foundation, Q06.1 (2 marks): Table 2 compares an electric car and a diesel car. Table 2 Power source Maximum acceleration in m/s2 Mass of power source in kg Range in km Maximum power output
- June 2019, Paper 1 Foundation, Q06.2 (2 marks): The mass of the battery in the electric car is 420 kg The total mass of the electric car is 1610 kg Calculate the mass of the battery as a percentage of the tot
- June 2019, Paper 1 Foundation, Q06.3 (2 marks): Designers of electric car batteries want to increase the amount of energy that can be stored in a battery. Suggest two reasons why. [2 marks] 1 2
- Specimen, Paper 1 Higher, Q03.1: Suggest one reason for the shape of the graph between 15.00 and 18.00 on Monday. [1 mar
- Specimen, Paper 1 Higher, Q03.2: Gas fired power stations reduce their output when demand for electricity is low. Suggest one time on Figure 2 when the demand for electricity was low. [1 mar
- Specimen, Paper 1 Higher, Q03.3 (2 marks): The National Grid ensures that fossil fuel power stations in the UK only produce about 33% of the total electricity they could produce when operating at a maxim
- Specimen, Paper 1 Foundation, Q01.1 (2 marks): Coal is a non-renewable energy resource. Name two other non-renewable energy resources. [2 mark 1 2
- Specimen, Paper 1 Foundation, Q01.2 (1 mark): A wind turbine does not generate electricity constantly. For how many hours did the wind turbine generate no electricity? [1 mark] Time = hours
- Specimen, Paper 1 Foundation, Q01.4 (1 mark): An island has a large number of wind turbines and a coal-fired power station. The island needs to use the electricity generated by the coal-fired power station
- Specimen, Paper 1 Foundation, Q01.5 (2 marks): A wind turbine has an average power output of 0.60 MW. A coal-fired power station has a continuous power output of 1500 MW. Calculate how many wind turbines wou
- Specimen, Paper 1 Foundation, Q01.6: It is important that scientists develop new energy resources. Choose one reason why. [1 mar Tick one box. All energy resources are running out. All energy resou
- Specimen, Paper 1 Foundation, Q11.1: Suggest one reason for the shape of the graph between 15.00 and 18.00 on Monday. [1 mar
- Specimen, Paper 1 Foundation, Q11.2: Gas fired power stations reduce their output when demand for electricity is low. Suggest one time on Figure 13 when the demand for electricity was low. [1 mar
- Specimen, Paper 1 Foundation, Q11.3 (2 marks): The National Grid ensures that fossil fuel power stations in the UK only produce about 33% of the total electricity they could produce when operating at a maxim
Questions, mark schemes and examiner’s reports are © AQA, from their published past papers. Plumi isn’t affiliated with any exam board. Want whole papers? Every AQA GCSE Physics paper.
Rather write your answers by hand on iPad? Plumi marks them against the same mark schemes.