Skip to content

Data presentation and interpretation: AQA A‑Level Maths questions

Every AQA A-Level Maths exam question on L Data presentation and interpretation, 2018–2025, with its mark scheme and examiner’s report.

Find questions426
426 questions

  1. Q13

    June 2025 · Paper 3

    The whole paper ↗
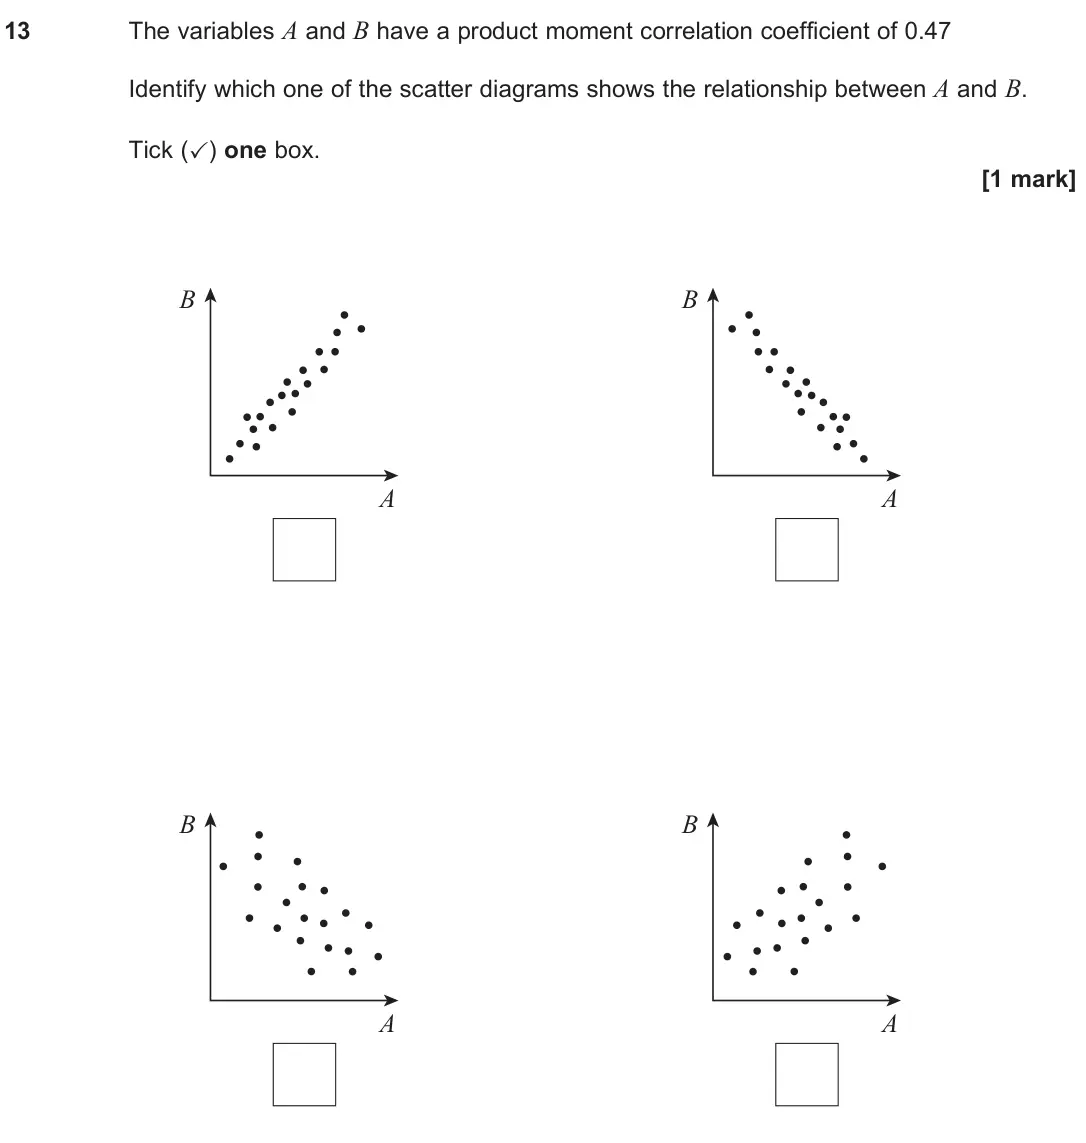
    June 2025 Paper 3, question 13: The variables A and B have a product moment correlation coefficient of 0.47 Identify which one of the scatter diagrams shows the relationship between A and B. T
  2. Q16

    June 2025 · Paper 3

    The whole paper ↗
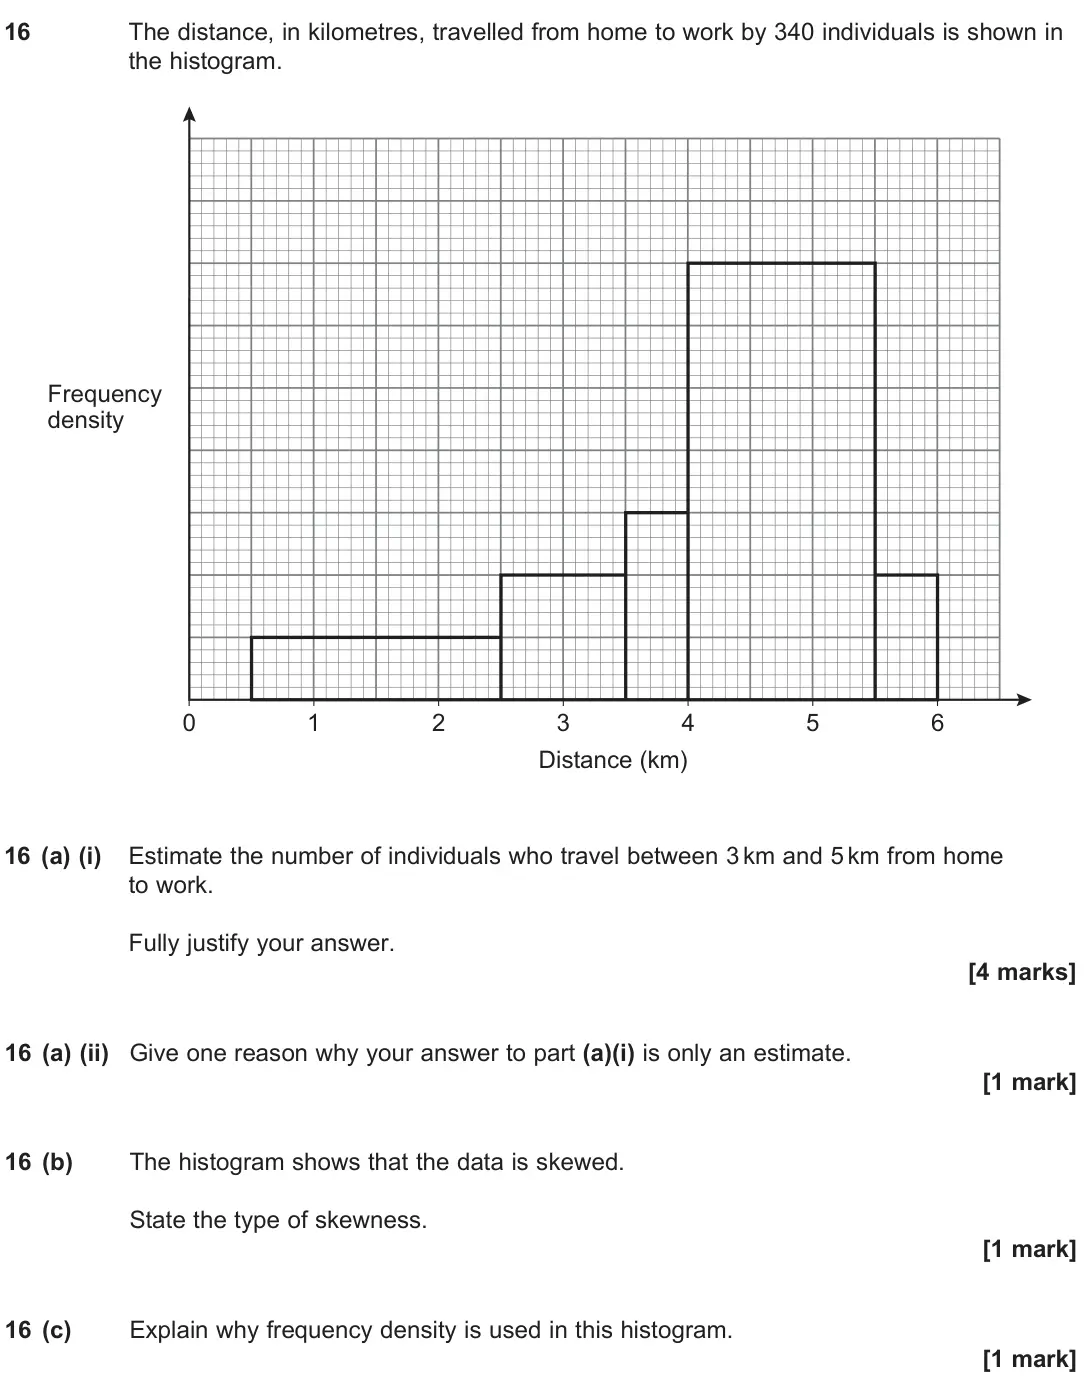
    June 2025 Paper 3, question 16: The distance, in kilometres, travelled from home to work by 340 individuals is shown in the histogram. 1 2 3 4 5 6 Distance (km) Frequency density 0 16 (a) (i)
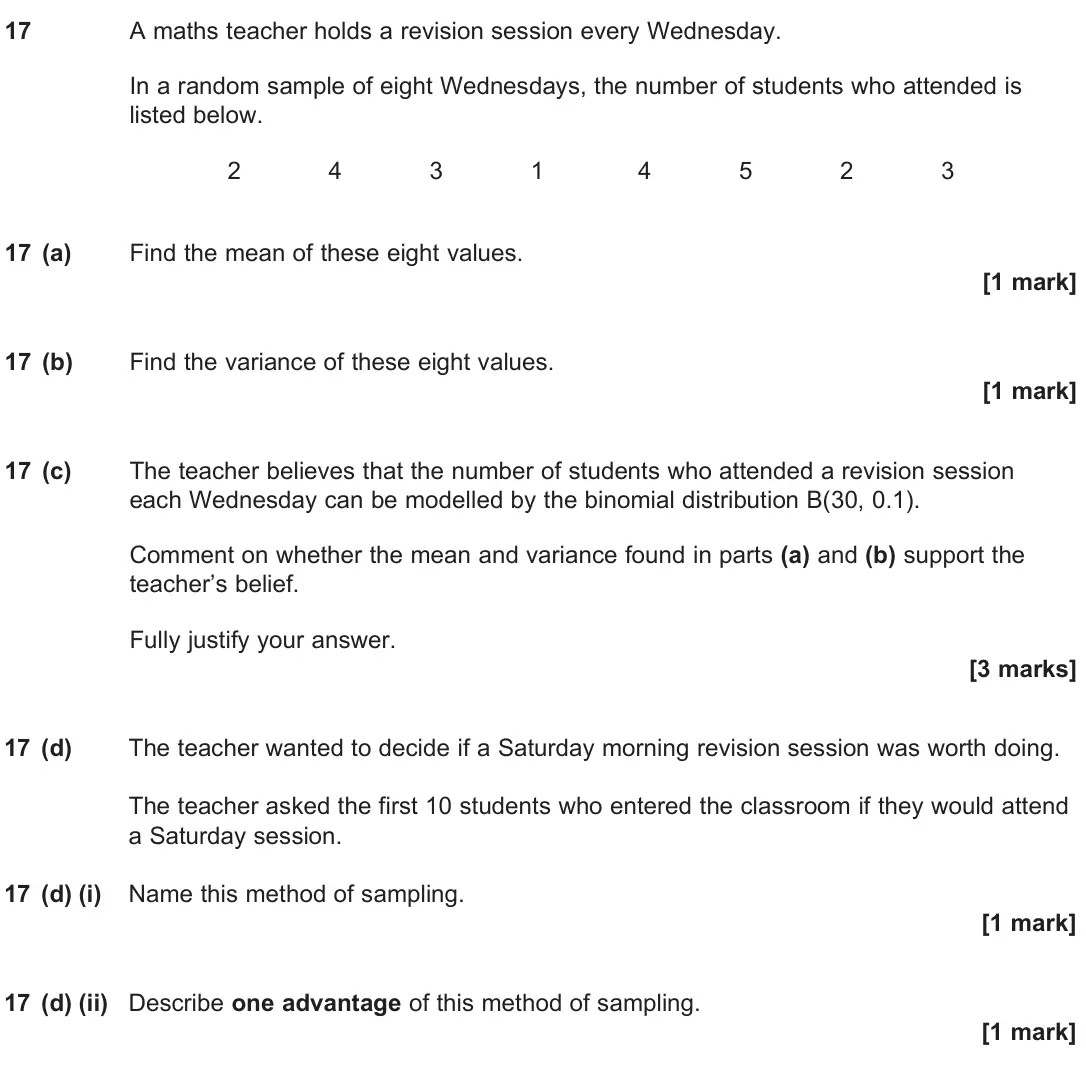
  3. June 2025 Paper 3, question 17: A maths teacher holds a revision session every Wednesday. In a random sample of eight Wednesdays, the number of students who attended is listed below. 2 4 3 1 4
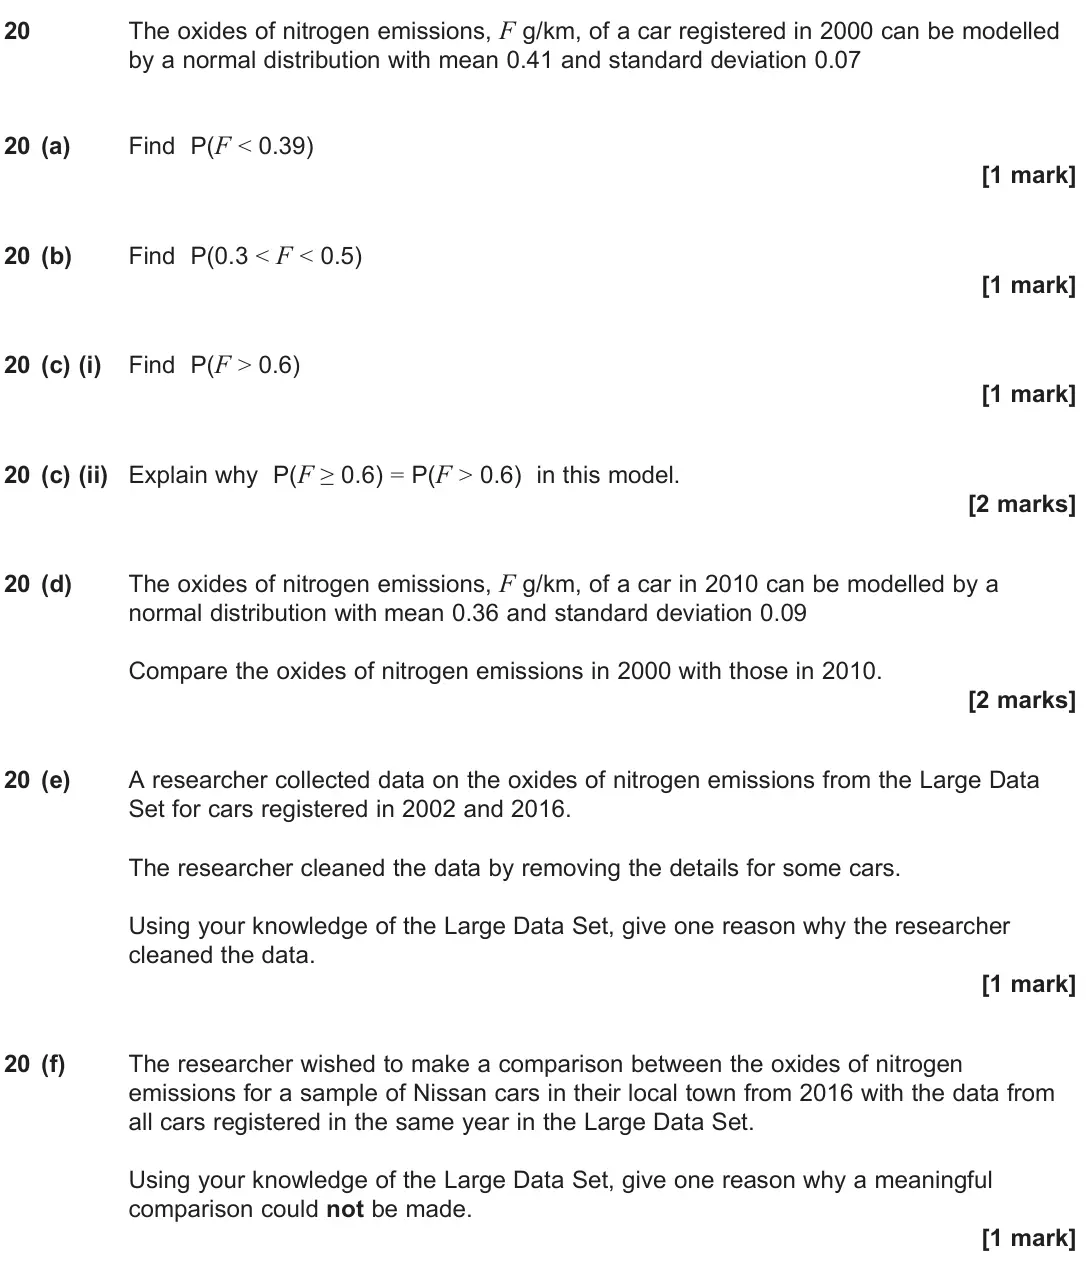
  4. June 2025 Paper 3, question 20: The oxides of nitrogen emissions, F g/km, of a car registered in 2000 can be modelled by a normal distribution with mean 0.41 and standard deviation 0.07 20 (a)
  5. Q12

    June 2024 · Paper 3

    The whole paper ↗
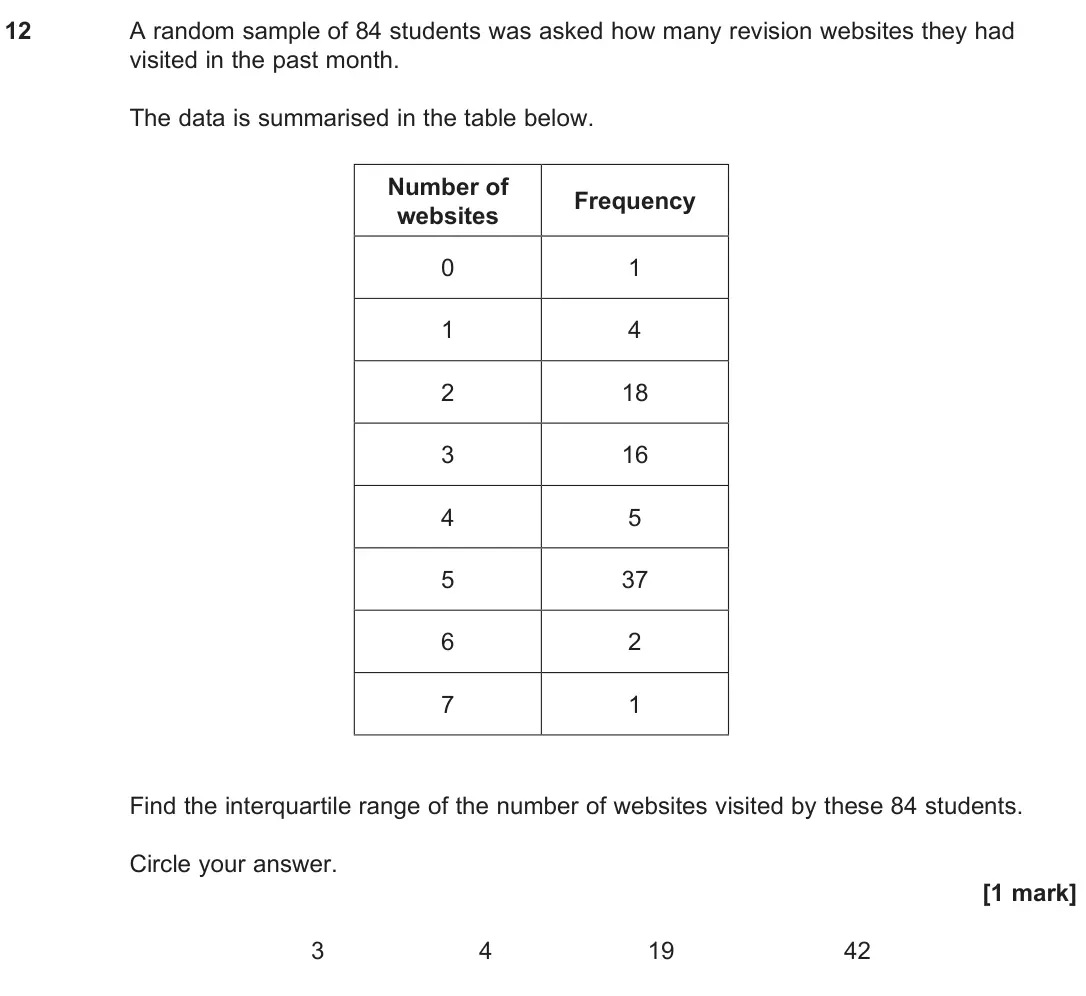
    June 2024 Paper 3, question 12: A random sample of 84 students was asked how many revision websites they had visited in the past month. The data is summarised in the table below. _ Number of w
  6. Q14

    June 2024 · Paper 3

    The whole paper ↗
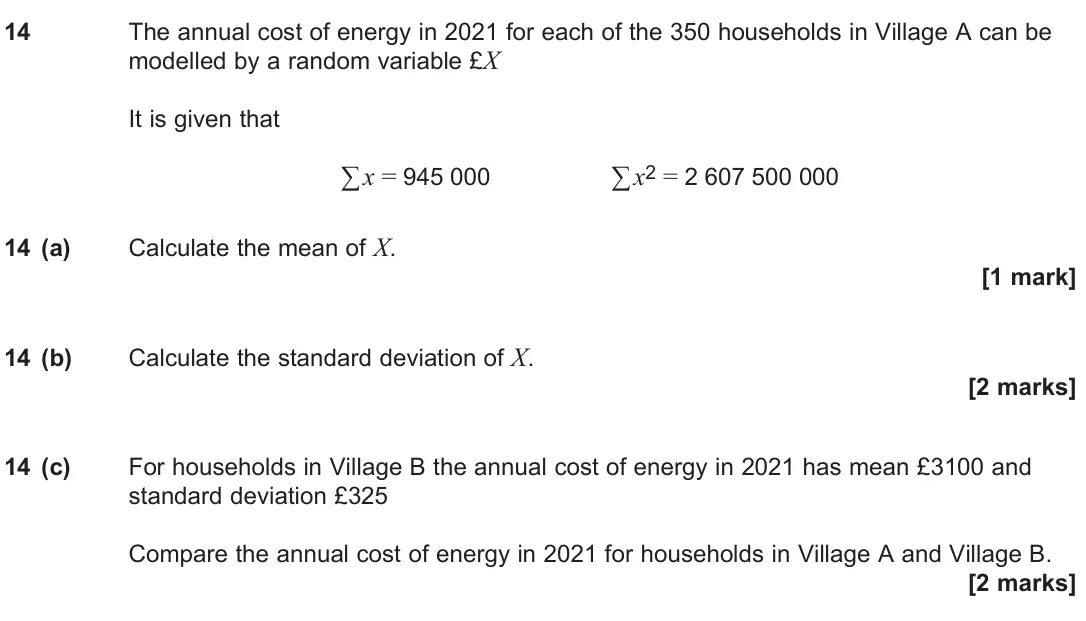
    June 2024 Paper 3, question 14: The annual cost of energy in 2021 for each of the 350 households in Village A can be modelled by a random variable £X It is given that ∑ x = 945 000 ∑ x2 = 2 60
  7. Q10

    June 2023 · Paper 3

    The whole paper ↗
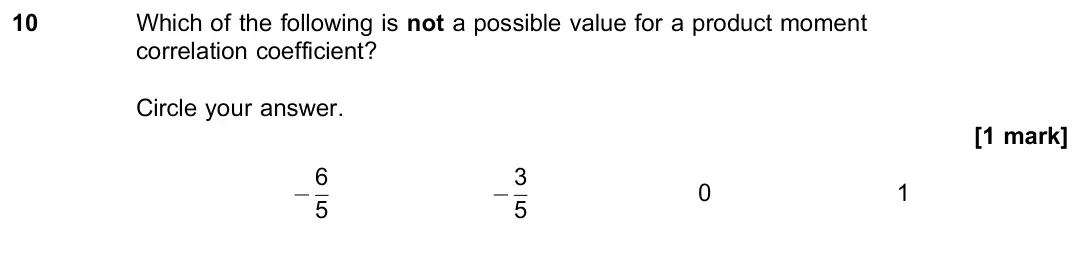
    June 2023 Paper 3, question 10: Which of the following is not a possible value for a product moment correlation coefficient? Circle your answer. [1 mark] − 6 5 − 3 5 0 1
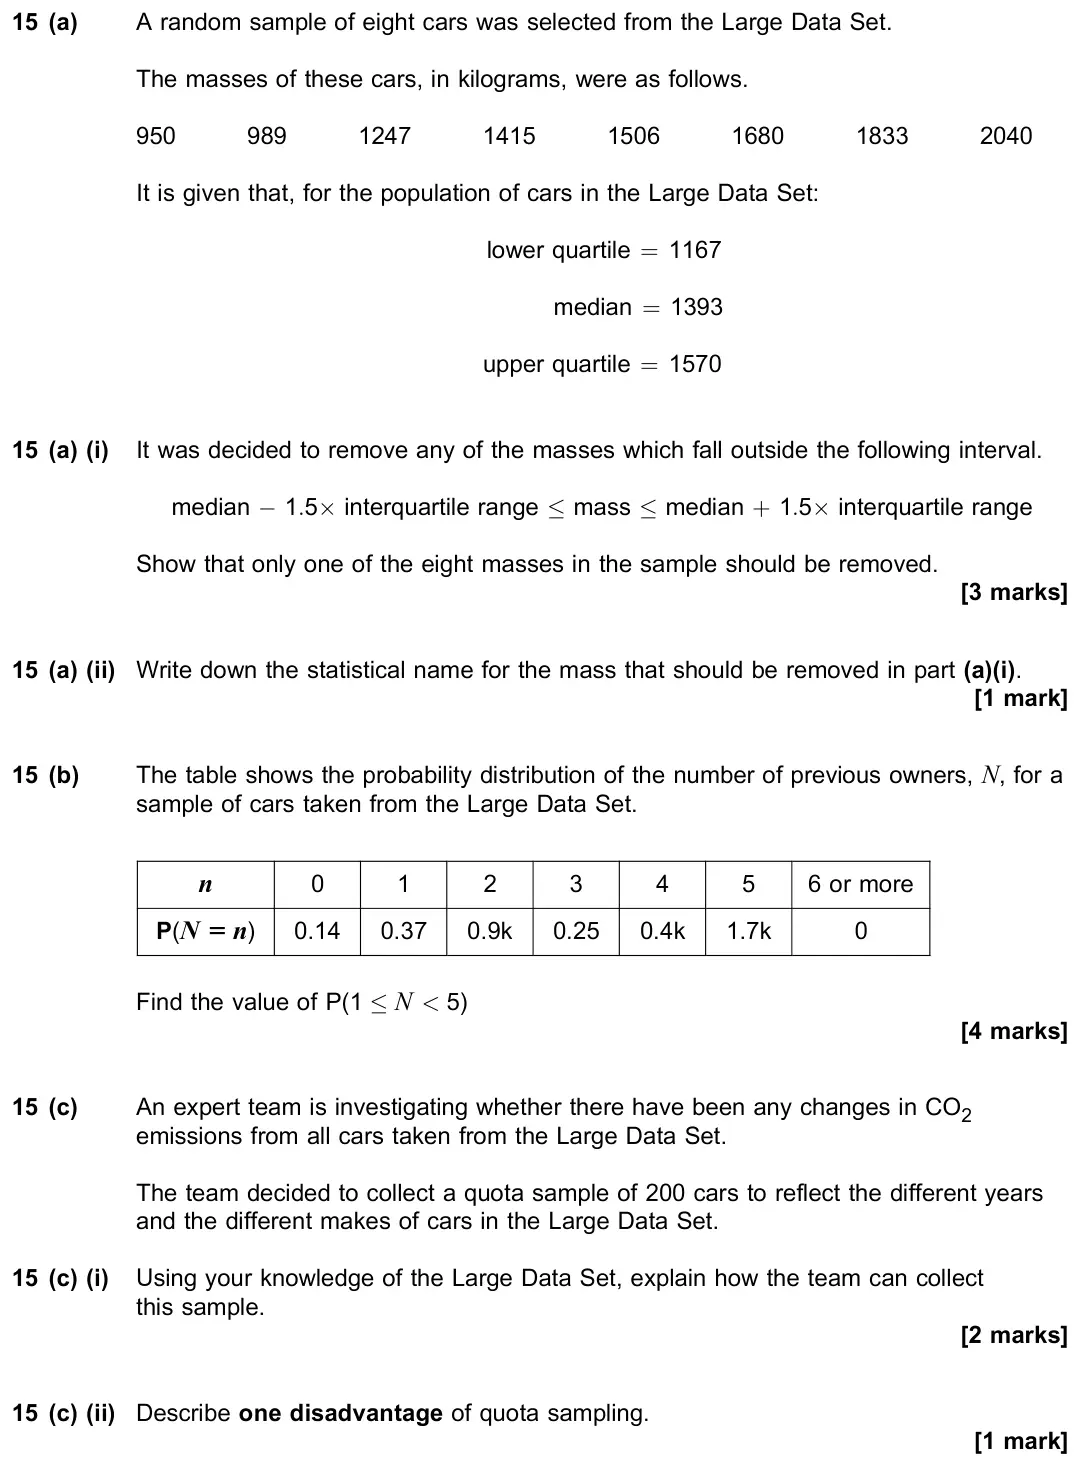
  8. June 2023 Paper 3, question 15: (a) A random sample of eight cars was selected from the Large Data Set. The masses of these cars, in kilograms, were as follows. 950 989 1247 1415 1506 1680 183
  9. Q12

    June 2022 · Paper 3

    The whole paper ↗
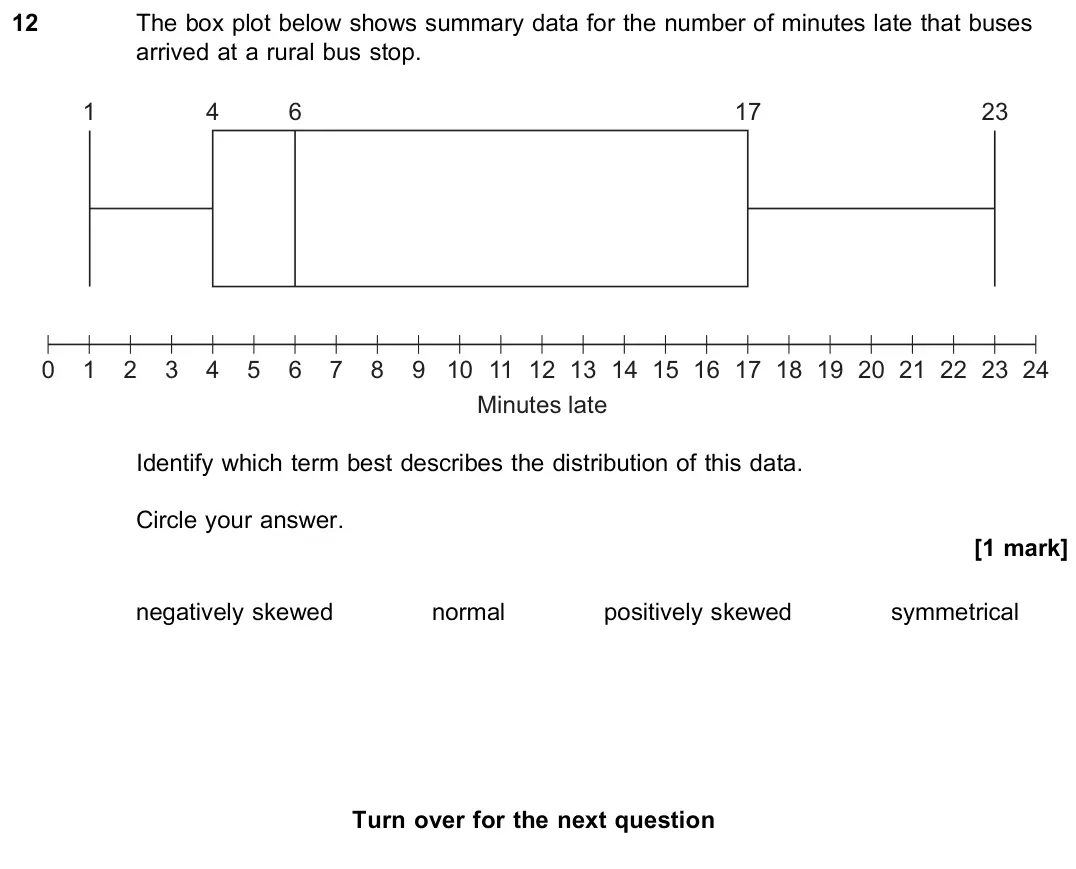
    June 2022 Paper 3, question 12: The box plot below shows summary data for the number of minutes late that buses arrived at a rural bus stop. 24 0 1 1 2 3 4 4 5 6 6 7 8 9 10 11 12 Minutes late
  10. Q13

    June 2022 · Paper 3

    The whole paper ↗
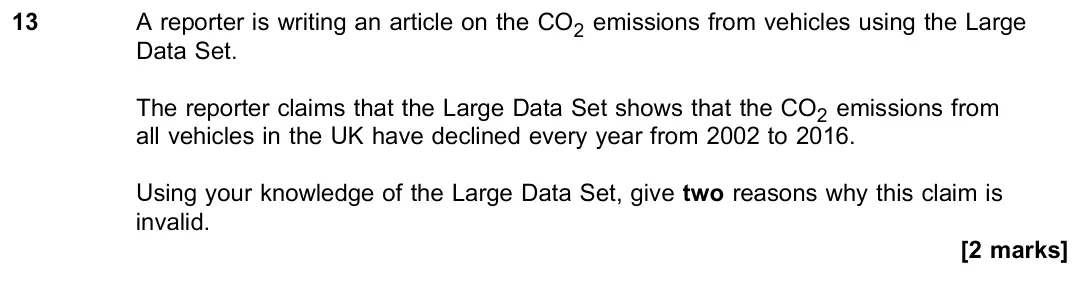
    June 2022 Paper 3, question 13: A reporter is writing an article on the CO2 emissions from vehicles using the Large Data Set. The reporter claims that the Large Data Set shows that the CO2 emi
  11. Q18

    June 2022 · Paper 3

    The whole paper ↗
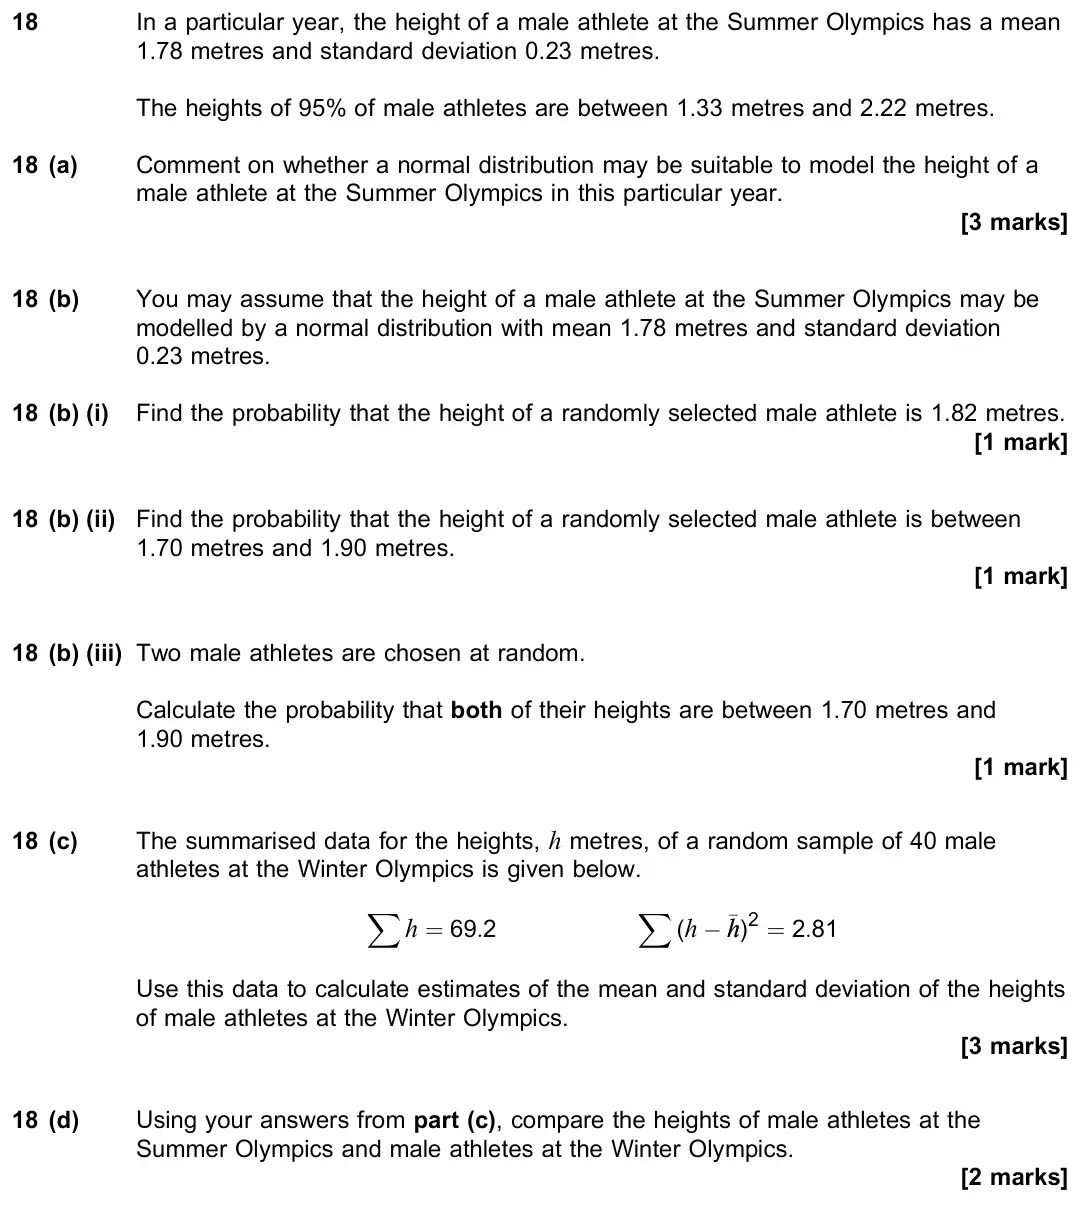
    June 2022 Paper 3, question 18: In a particular year, the height of a male athlete at the Summer Olympics has a mean 1.78 metres and standard deviation 0.23 metres. The heights of 95% of male
  12. Q10

    November 2021 · Paper 3

    The whole paper ↗
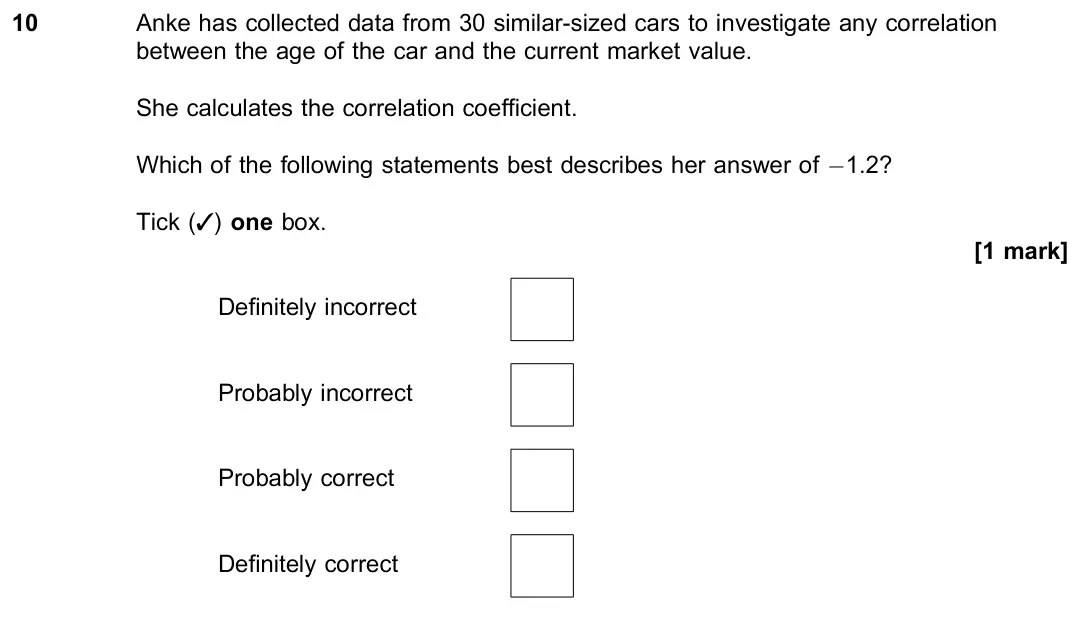
    November 2021 Paper 3, question 10: Anke has collected data from 30 similar-sized cars to investigate any correlation between the age of the car and the current market value. She calculates the co
  13. Q13

    November 2021 · Paper 3

    The whole paper ↗
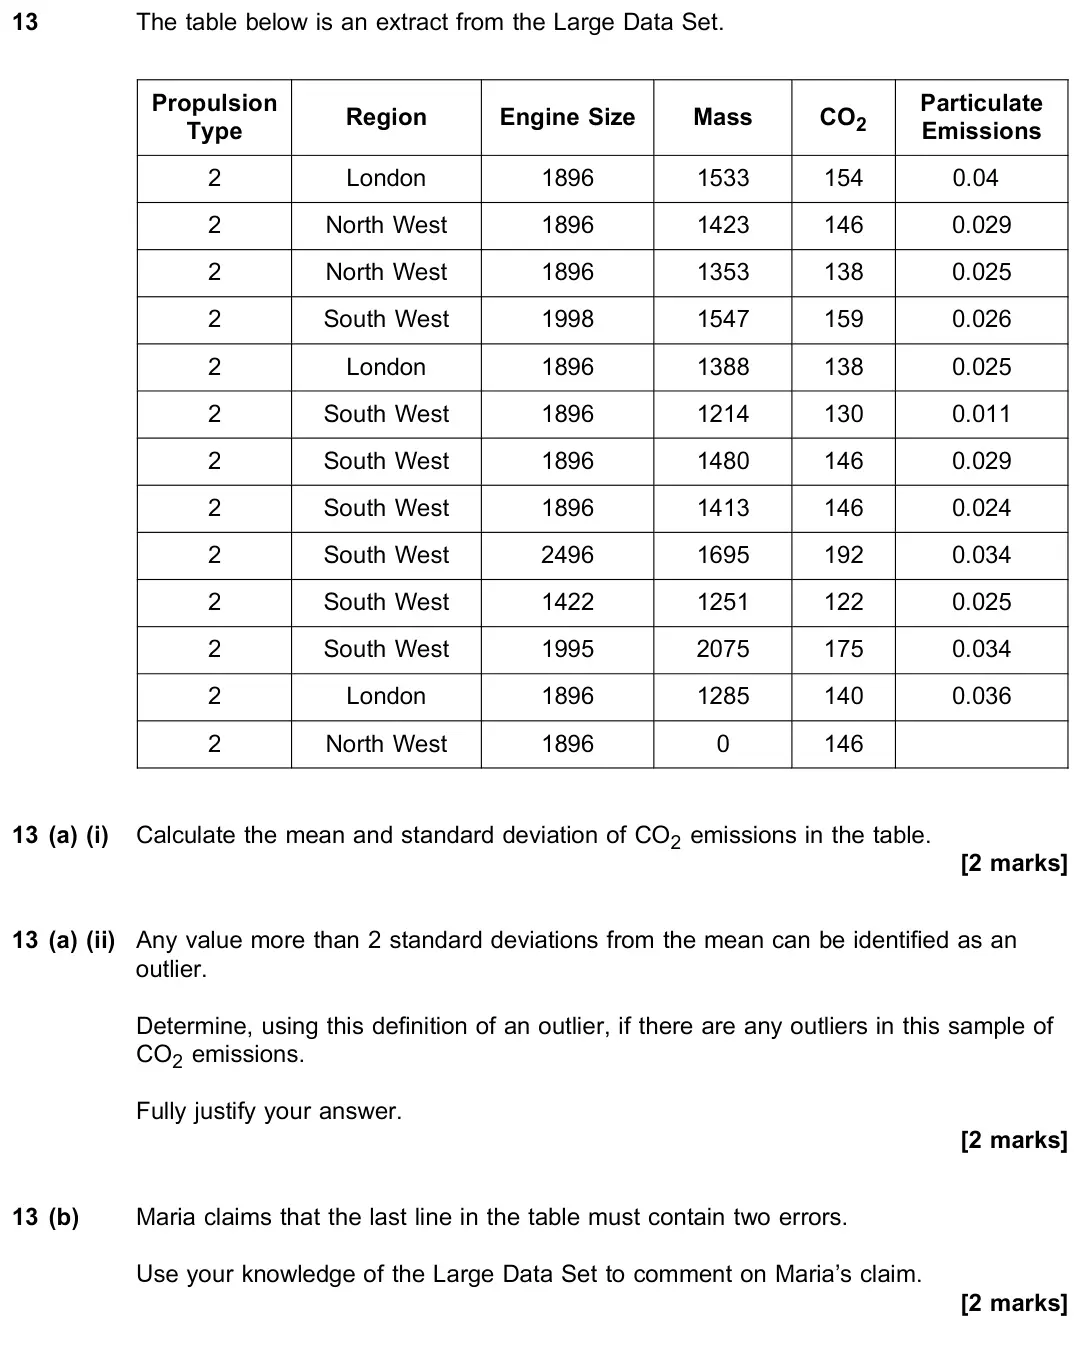
    November 2021 Paper 3, question 13: The table below is an extract from the Large Data Set. Propulsion Type Region Engine Size Mass CO2 Particulate Emissions 2 London 1896 1533 154 0.04 2 North Wes
  14. Q11

    November 2020 · Paper 3

    The whole paper ↗
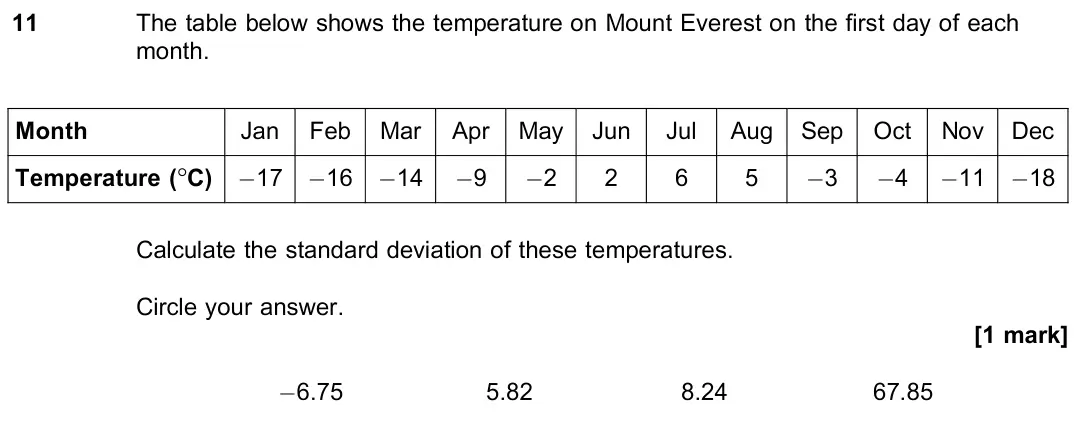
    November 2020 Paper 3, question 11: The table below shows the temperature on Mount Everest on the first day of each month. Month Jan Feb Mar Apr May Jun Jul Aug Sep Oct Nov Dec Temperature (°C) −1
  15. Q12

    November 2020 · Paper 3

    The whole paper ↗
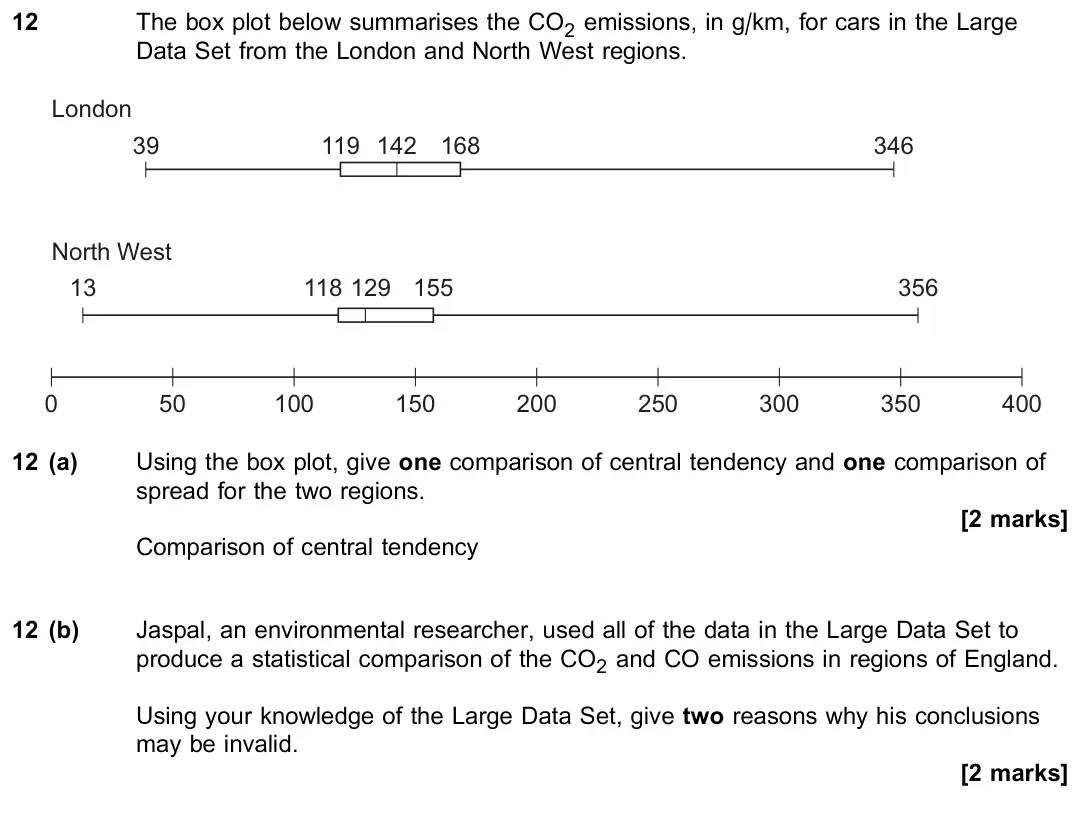
    November 2020 Paper 3, question 12: The box plot below summarises the CO2 emissions, in g/km, for cars in the Large Data Set from the London and North West regions. London 346 168 142 119 39 13 0
  16. Q10

    June 2019 · Paper 3

    The whole paper ↗
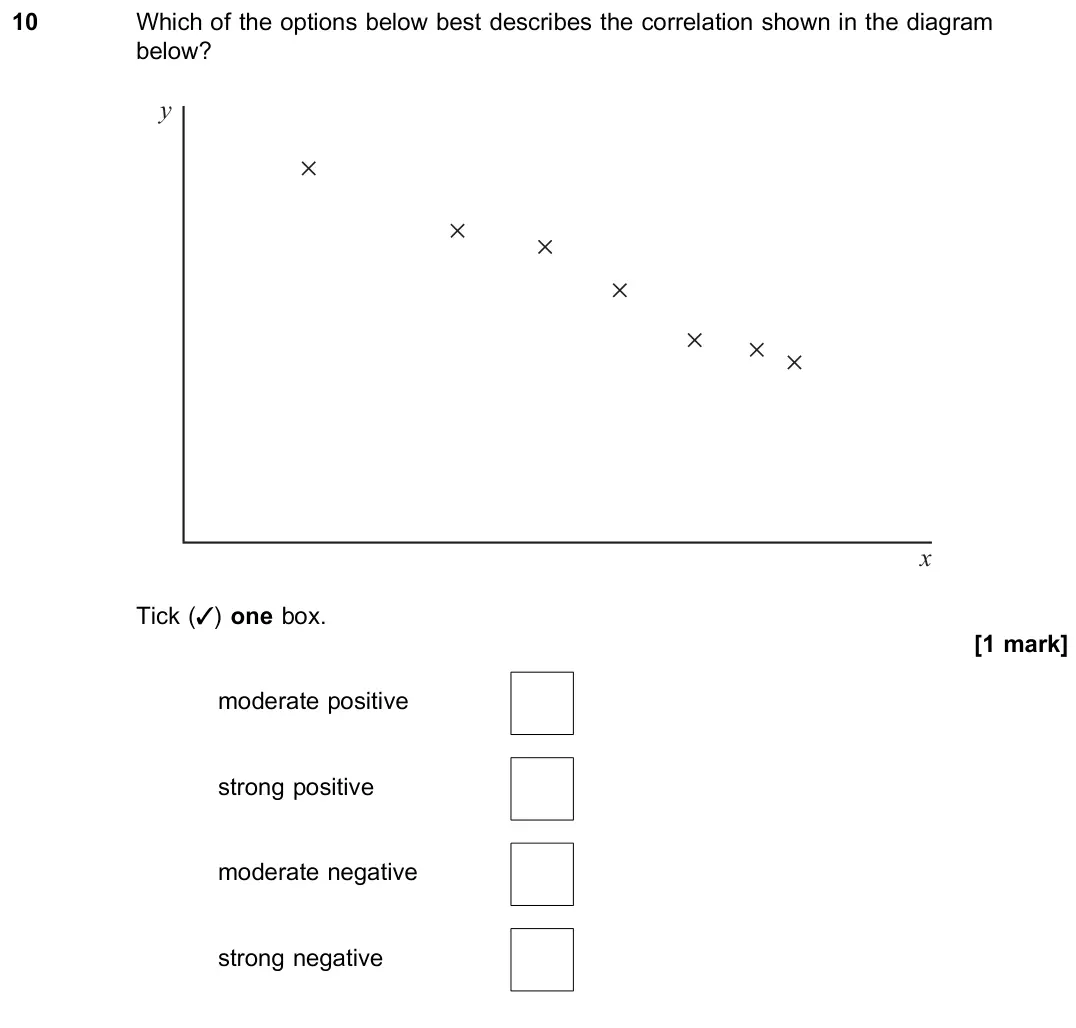
    June 2019 Paper 3, question 10: Which of the options below best describes the correlation shown in the diagram below? x y Tick (3) one box. [1 mark] moderate positive strong positive moderate
  17. Q12

    June 2019 · Paper 3

    The whole paper ↗
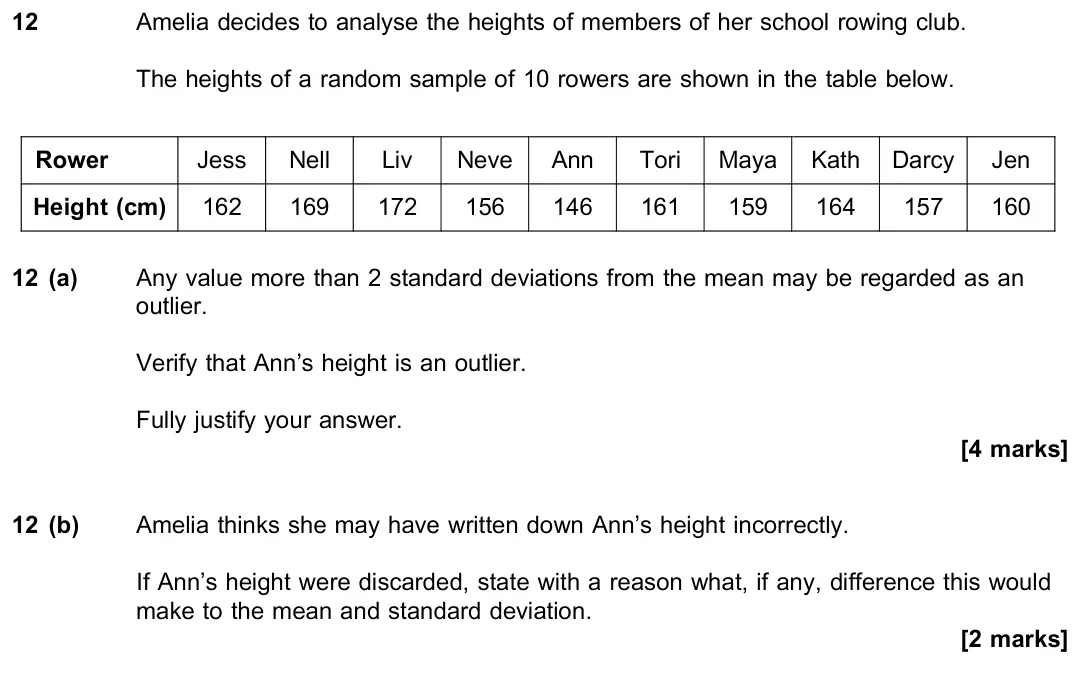
    June 2019 Paper 3, question 12: Amelia decides to analyse the heights of members of her school rowing club. The heights of a random sample of 10 rowers are shown in the table below. Rower Jess
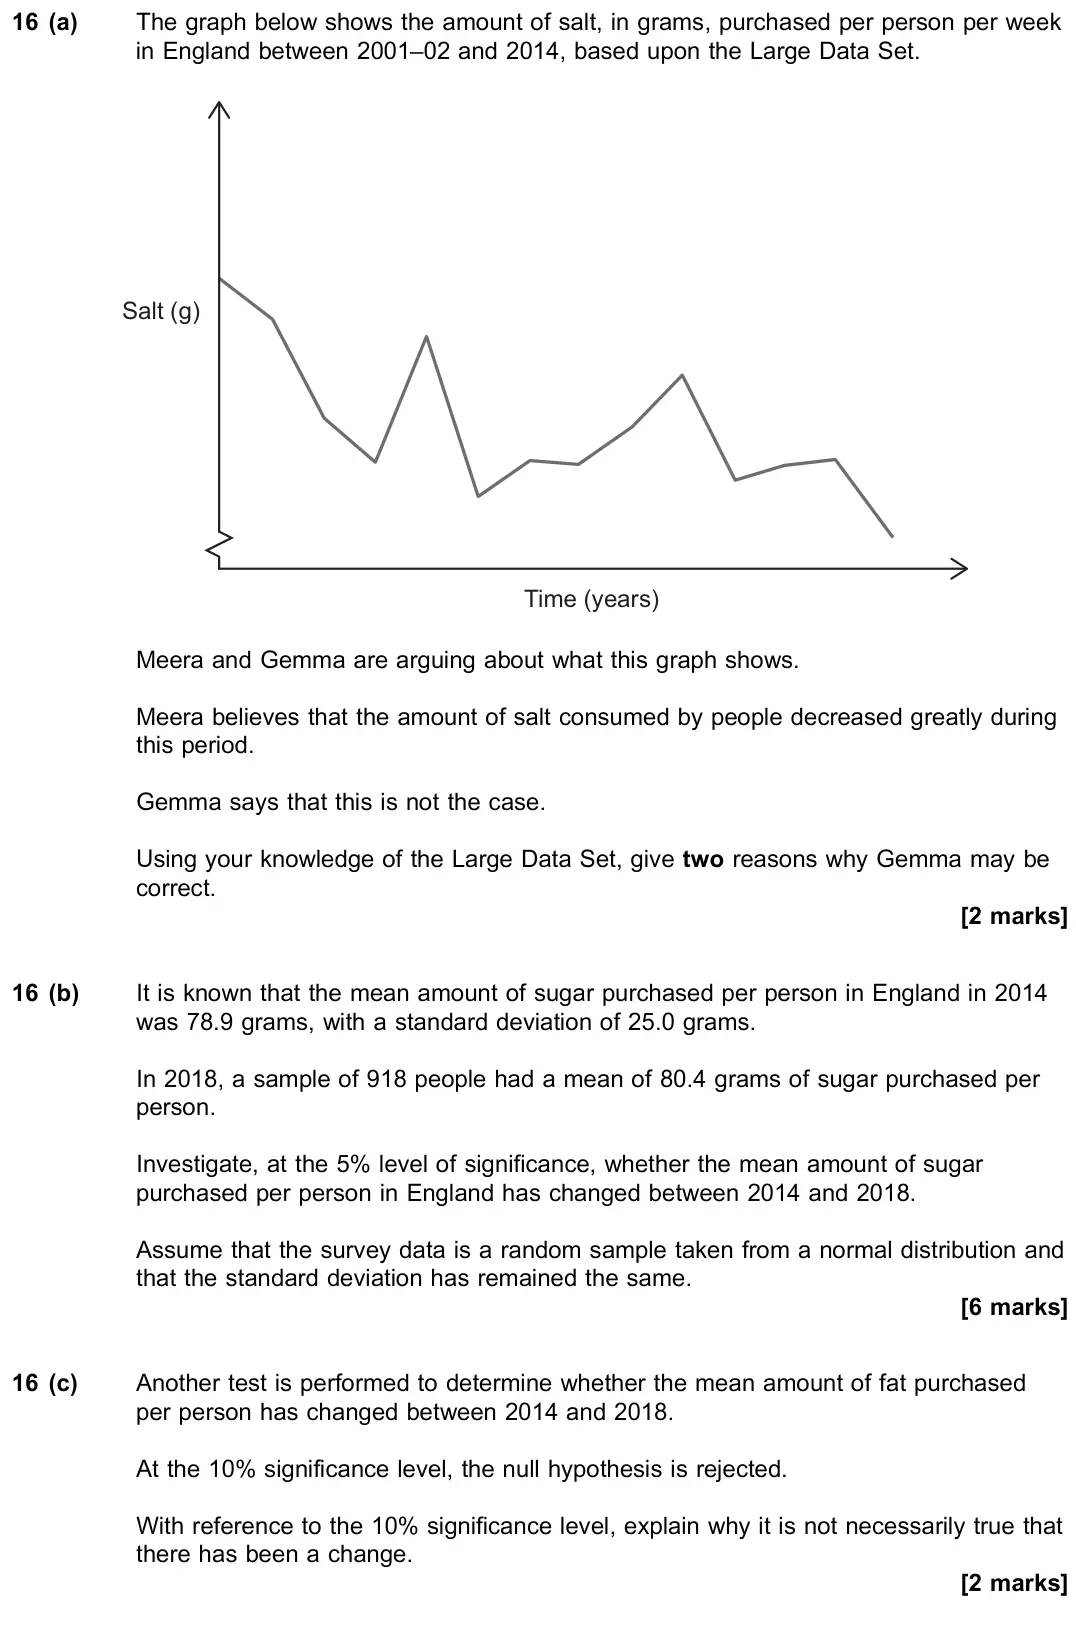
  18. June 2019 Paper 3, question 16: (a) The graph below shows the amount of salt, in grams, purchased per person per week in England between 2001–02 and 2014, based upon the Large Data Set. Salt (
  19. Q12

    June 2018 · Paper 3

    The whole paper ↗
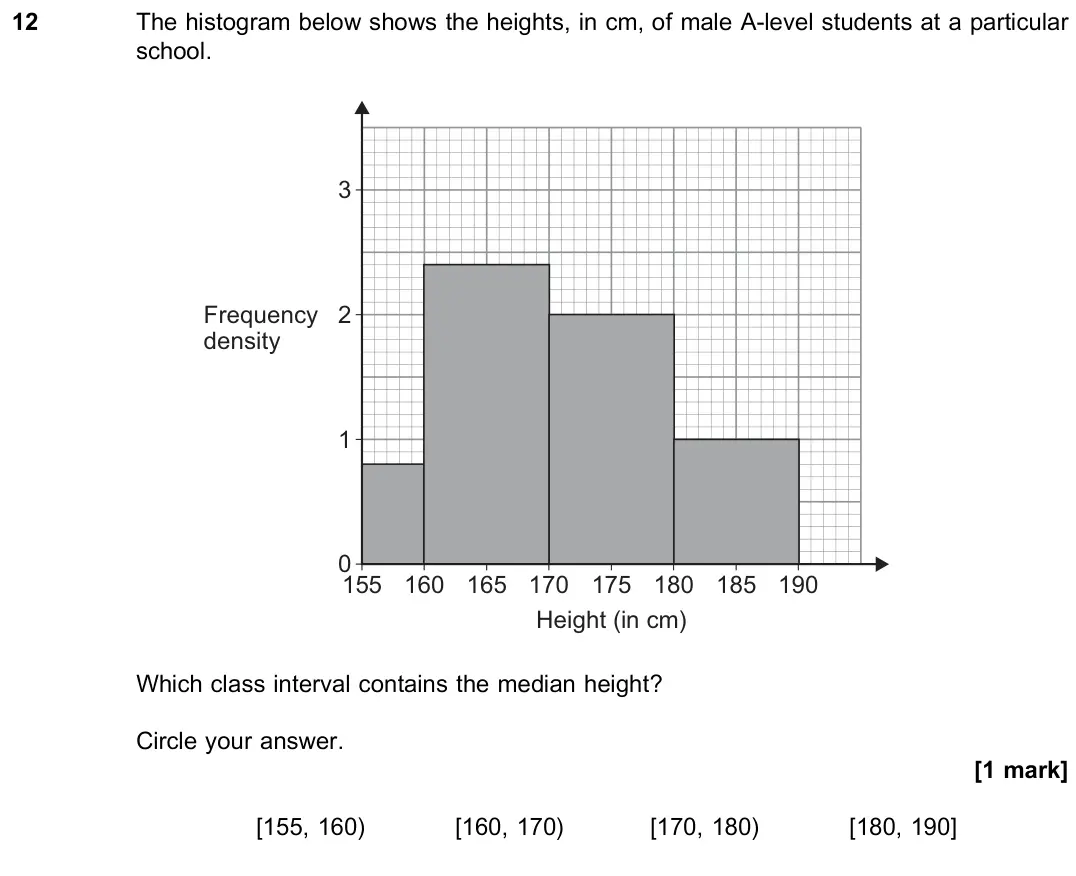
    June 2018 Paper 3, question 12: The histogram below shows the heights, in cm, of male A-level students at a particular school. 175 185 155 0 1 2 3 165 170 180 190 160 Height (in cm) Frequency
  20. Q13

    June 2018 · Paper 3

    The whole paper ↗
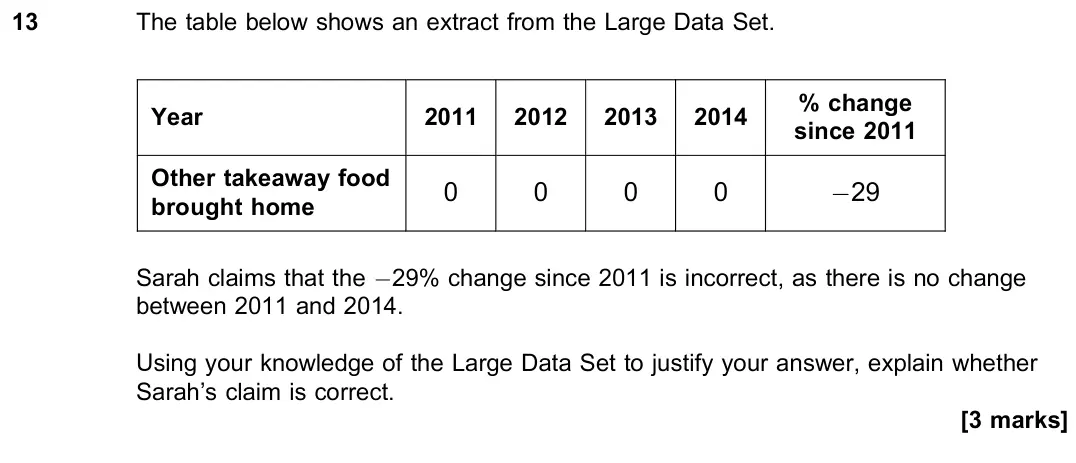
    June 2018 Paper 3, question 13: The table below shows an extract from the Large Data Set. Year 2011 2012 2013 2014 % change since 2011 Other takeaway food brought home 0 0 0 0 −29 Sarah claims
All 21 questions on Data presentation and interpretation, as a list
  1. June 2025, Paper 3, Q13 (1 mark): The variables A and B have a product moment correlation coefficient of 0.47 Identify which one of the scatter diagrams shows the relationship between A and B. T
  2. June 2025, Paper 3, Q16 (7 marks): The distance, in kilometres, travelled from home to work by 340 individuals is shown in the histogram. 1 2 3 4 5 6 Distance (km) Frequency density 0 16 (a) (i)
  3. June 2025, Paper 3, Q17 (7 marks): A maths teacher holds a revision session every Wednesday. In a random sample of eight Wednesdays, the number of students who attended is listed below. 2 4 3 1 4
  4. June 2025, Paper 3, Q20 (9 marks): The oxides of nitrogen emissions, F g/km, of a car registered in 2000 can be modelled by a normal distribution with mean 0.41 and standard deviation 0.07 20 (a)
  5. June 2024, Paper 3, Q12 (1 mark): A random sample of 84 students was asked how many revision websites they had visited in the past month. The data is summarised in the table below. _ Number of w
  6. June 2024, Paper 3, Q14 (5 marks): The annual cost of energy in 2021 for each of the 350 households in Village A can be modelled by a random variable £X It is given that ∑ x = 945 000 ∑ x2 = 2 60
  7. June 2023, Paper 3, Q10 (1 mark): Which of the following is not a possible value for a product moment correlation coefficient? Circle your answer. [1 mark] − 6 5 − 3 5 0 1
  8. June 2023, Paper 3, Q15 (11 marks): (a) A random sample of eight cars was selected from the Large Data Set. The masses of these cars, in kilograms, were as follows. 950 989 1247 1415 1506 1680 183
  9. June 2022, Paper 3, Q12 (1 mark): The box plot below shows summary data for the number of minutes late that buses arrived at a rural bus stop. 24 0 1 1 2 3 4 4 5 6 6 7 8 9 10 11 12 Minutes late
  10. June 2022, Paper 3, Q13 (2 marks): A reporter is writing an article on the CO2 emissions from vehicles using the Large Data Set. The reporter claims that the Large Data Set shows that the CO2 emi
  11. June 2022, Paper 3, Q18 (11 marks): In a particular year, the height of a male athlete at the Summer Olympics has a mean 1.78 metres and standard deviation 0.23 metres. The heights of 95% of male
  12. November 2021, Paper 3, Q10 (1 mark): Anke has collected data from 30 similar-sized cars to investigate any correlation between the age of the car and the current market value. She calculates the co
  13. November 2021, Paper 3, Q13 (6 marks): The table below is an extract from the Large Data Set. Propulsion Type Region Engine Size Mass CO2 Particulate Emissions 2 London 1896 1533 154 0.04 2 North Wes
  14. November 2020, Paper 3, Q11 (1 mark): The table below shows the temperature on Mount Everest on the first day of each month. Month Jan Feb Mar Apr May Jun Jul Aug Sep Oct Nov Dec Temperature (°C) −1
  15. November 2020, Paper 3, Q12 (4 marks): The box plot below summarises the CO2 emissions, in g/km, for cars in the Large Data Set from the London and North West regions. London 346 168 142 119 39 13 0
  16. June 2019, Paper 3, Q10 (1 mark): Which of the options below best describes the correlation shown in the diagram below? x y Tick (3) one box. [1 mark] moderate positive strong positive moderate
  17. June 2019, Paper 3, Q12 (6 marks): Amelia decides to analyse the heights of members of her school rowing club. The heights of a random sample of 10 rowers are shown in the table below. Rower Jess
  18. June 2019, Paper 3, Q16 (10 marks): (a) The graph below shows the amount of salt, in grams, purchased per person per week in England between 2001–02 and 2014, based upon the Large Data Set. Salt (
  19. June 2018, Paper 3, Q12 (1 mark): The histogram below shows the heights, in cm, of male A-level students at a particular school. 175 185 155 0 1 2 3 165 170 180 190 160 Height (in cm) Frequency
  20. June 2018, Paper 3, Q13 (3 marks): The table below shows an extract from the Large Data Set. Year 2011 2012 2013 2014 % change since 2011 Other takeaway food brought home 0 0 0 0 −29 Sarah claims
  21. June 2018, Paper 3, Q16 (12 marks): A survey of 120 adults found that the volume, X litres per person, of carbonated drinks they consumed in a week had the following results: X x = 165:6 X x2 = 26

Questions, mark schemes and examiner’s reports are © AQA, from their published past papers. Plumi isn’t affiliated with any exam board. Want whole papers? Every AQA A-Level Maths paper.

Rather write your answers by hand on iPad? Plumi marks them against the same mark schemes.