 plumi
The determinants of the demand for goods and services: AQA A‑Level Economics questions
Every AQA A-Level Economics exam question on 4.1.3.1 The determinants of the demand for goods and services, 2020–2025, with its mark scheme and examiner’s report.
Find questions686
Calculations









All 13 questions on The determinants of the demand for goods and services, as a list
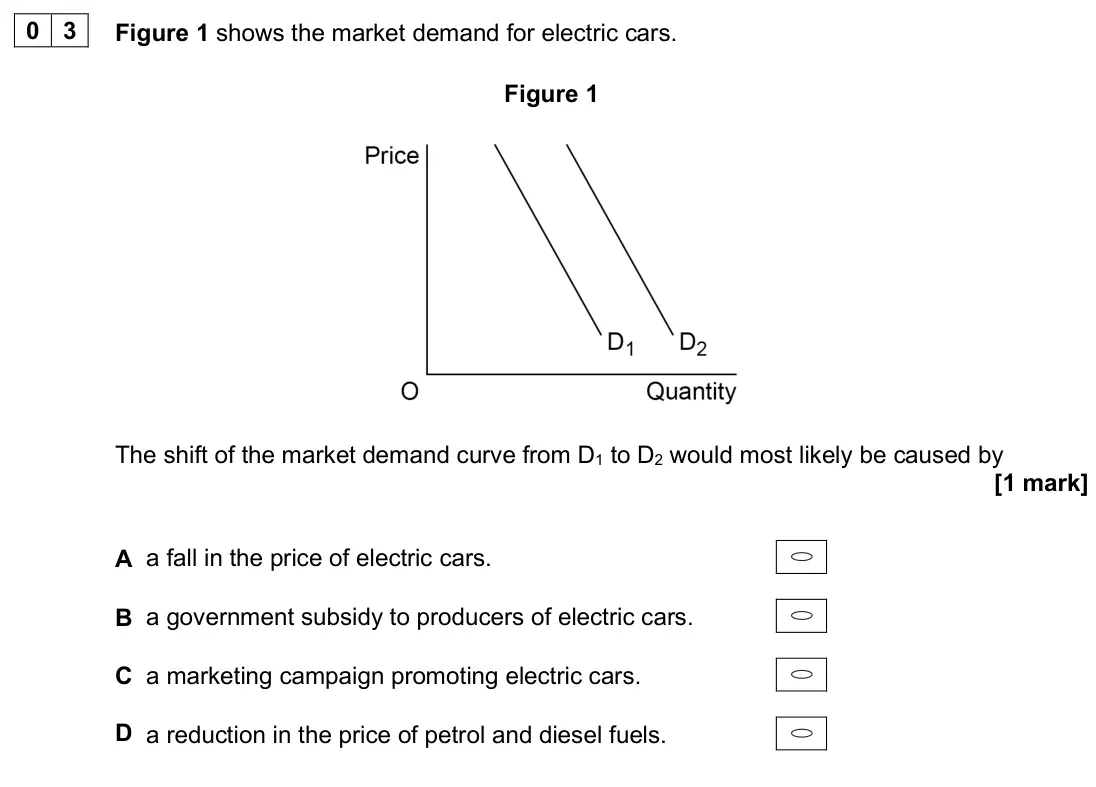
- June 2025, AS Paper 1, Q03 (1 mark): Figure 1 shows the market demand for electric cars. Figure 1 The shift of the market demand curve from D1 to D2 would most likely be caused by [1 mark] A a fall
- June 2025, AS Paper 1, Q25 (10 marks): Extract C (lines 14–15) states: ‘The UK House Price Index was 152.6 in August 2023, up 52.6% since January 2015.’ Explain possible reasons why the price of hous
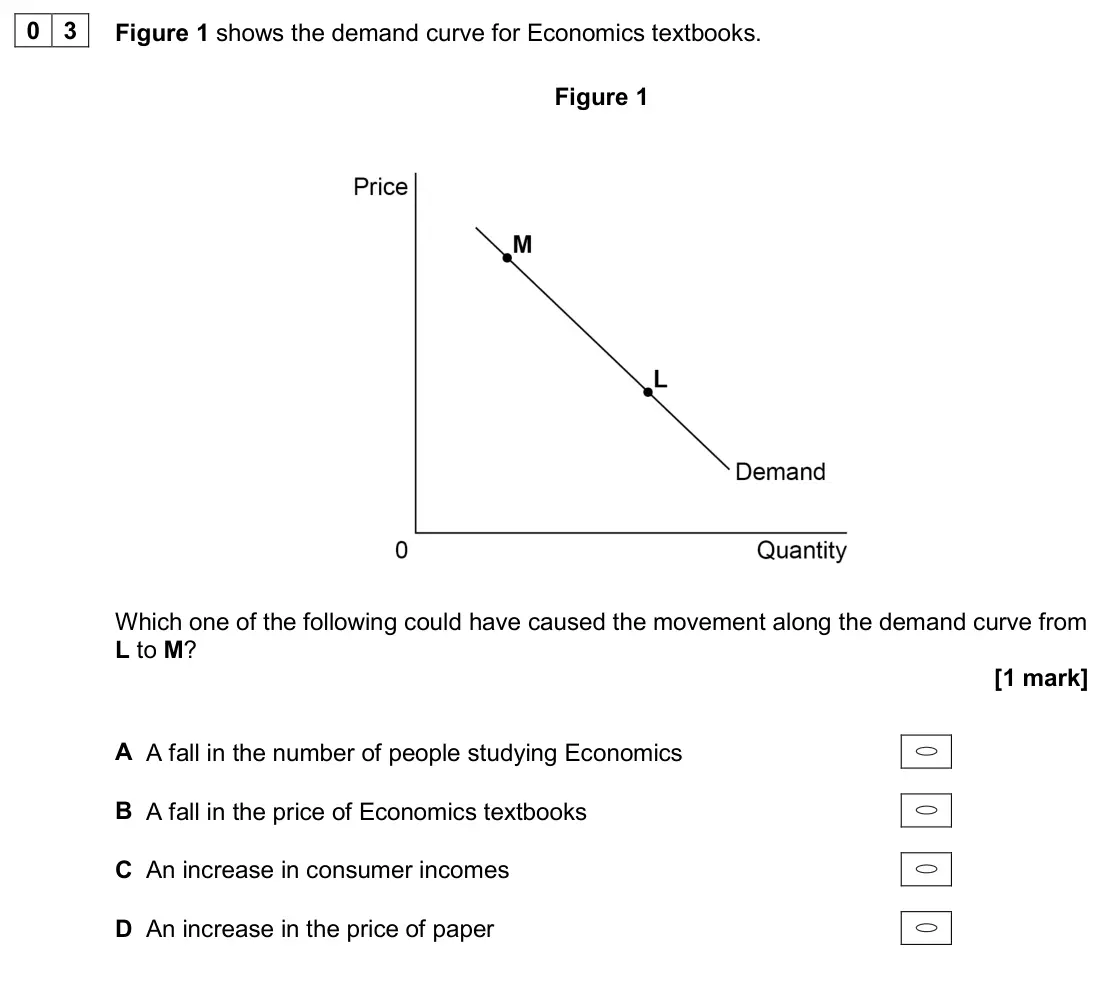
- June 2024, AS Paper 1, Q03 (1 mark): Figure 1 shows the demand curve for Economics textbooks. Figure 1 Which one of the following could have caused the movement along the demand curve from L to M?
- June 2024, AS Paper 1, Q25 (10 marks): Extract B (lines 1–2) states: ‘As the world recovered from the recession of 2008, there was more demand for travel and tourism.’ Explain possible reasons for an
- June 2024, AS Paper 1, Q31 (10 marks): Extract E (lines 15–17) states: ‘Increased competition and easier access to the internet have helped to bring down the price of some basic glasses to £25 or les
- June 2023, AS Paper 1, Q25 (10 marks): Extract C (lines 13–14) states: ‘Concerns about the impact of oil on the environment have led to the encouragement of renewable energy, such as solar, wind and
- June 2023, AS Paper 1, Q31 (10 marks): Extract E (lines 8–9) states: ‘Drones can reach remote areas quickly and easily, saving on labour and other costs.’ Explain how the increasing use of drones is
- June 2022, Paper 3, Q32 (15 marks): Explain the factors that a commercial aircraft manufacturer, such as Boeing or Airbus, should consider when forecasting the future sales of its aircraft. [15 ma
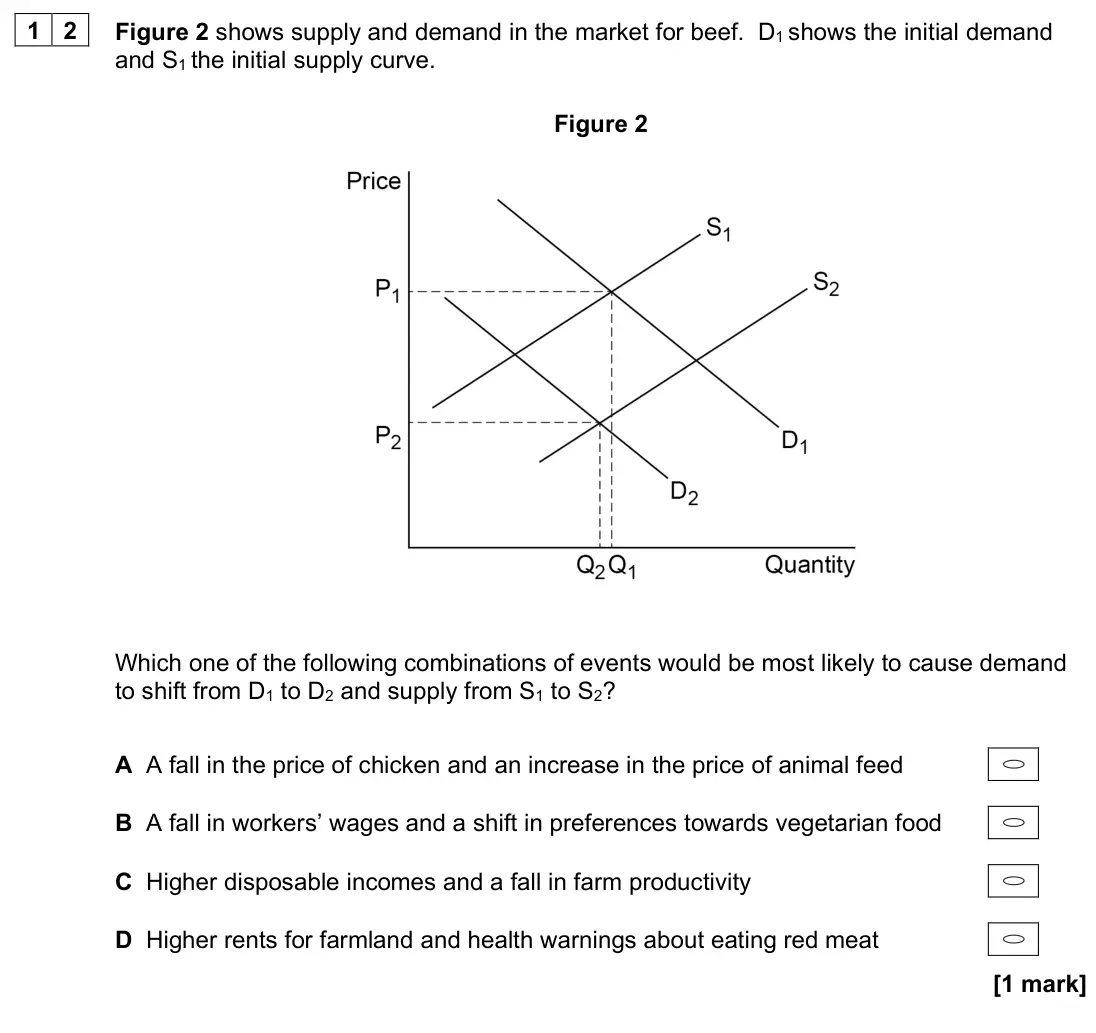
- June 2022, AS Paper 1, Q12 (1 mark): Figure 2 shows supply and demand in the market for beef. D1 shows the initial demand and S1 the initial supply curve. Figure 2 Which one of the following combin
- June 2022, AS Paper 1, Q30 (4 marks): Extract E (lines 2–3) states: ‘The minimum age for buying alcohol is 18, although in some countries, such as the US, the minimum age is 21’. Draw a diagram to s
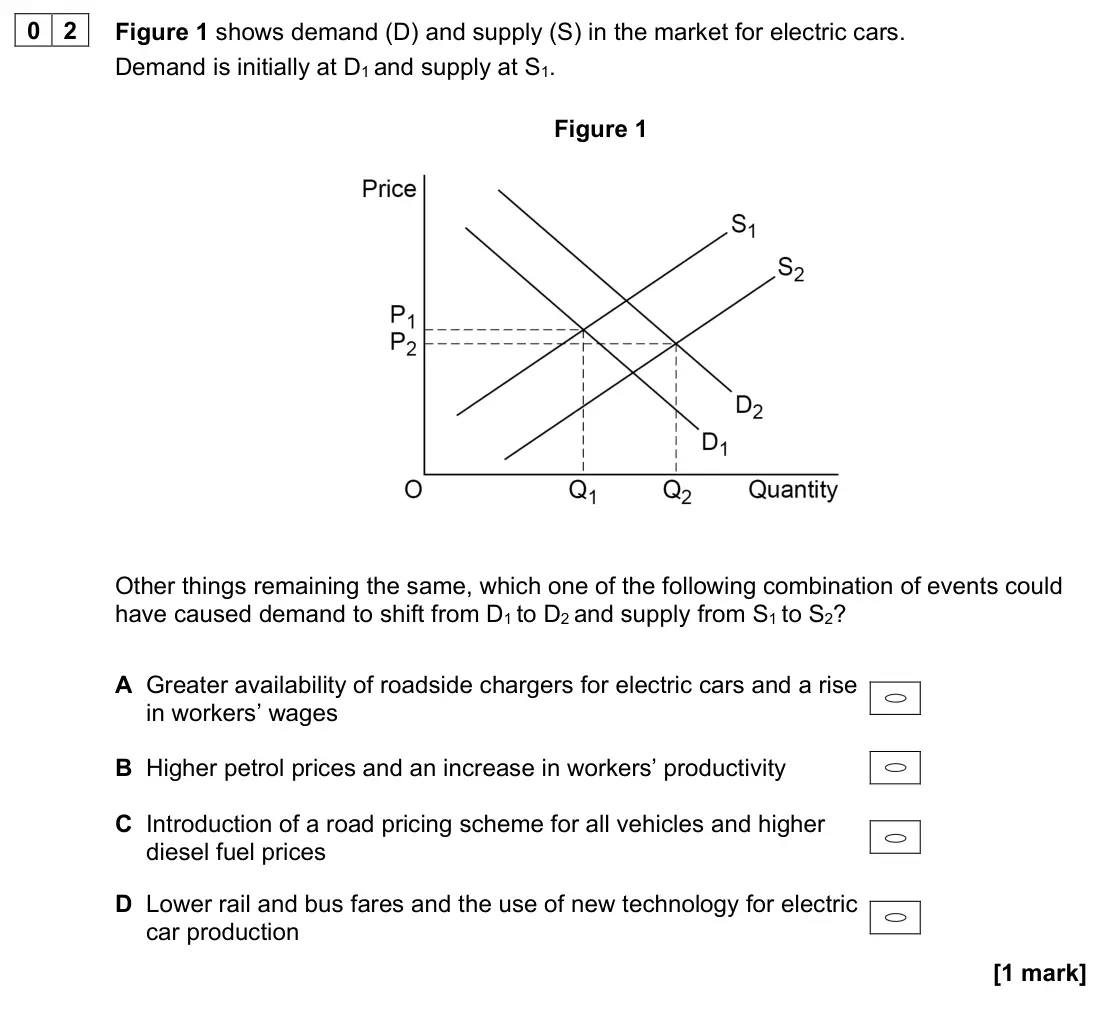
- November 2020, AS Paper 1, Q02 (1 mark): Figure 1 shows demand (D) and supply (S) in the market for electric cars. Demand is initially at D1 and supply at S1. Figure 1 Other things remaining the same,
- November 2020, AS Paper 1, Q25 (10 marks): Extract C (line 13) states: ‘Both the take-up rate and number of journeys per bus pass have been falling in recent years.’ Explain two factors which could lead
- November 2020, AS Paper 1, Q31 (10 marks): Extract E (lines 18–19) states: ‘the growth of e-cigarettes has fallen since, with some smokers switching back to conventional cigarettes.’ Explain two factors
Questions, mark schemes and examiner’s reports are © AQA, from their published past papers. Plumi isn’t affiliated with any exam board. Want whole papers? Full past papers.
Rather write your answers by hand on iPad? Plumi marks them against the same mark schemes.