 plumi
Non-linear graphs and functions: WJEC GCSE Maths questions
WJEC GCSE Maths past-paper questions on A9 Non-linear graphs and functions, November 2016 to June 2025, with mark schemes and examiner’s reports where available.
Past paper difficulty
Paper
All papers
Exam
All years
Calculator
Loading the full question list…




All 67 questions on Non-linear graphs and functions, as a list
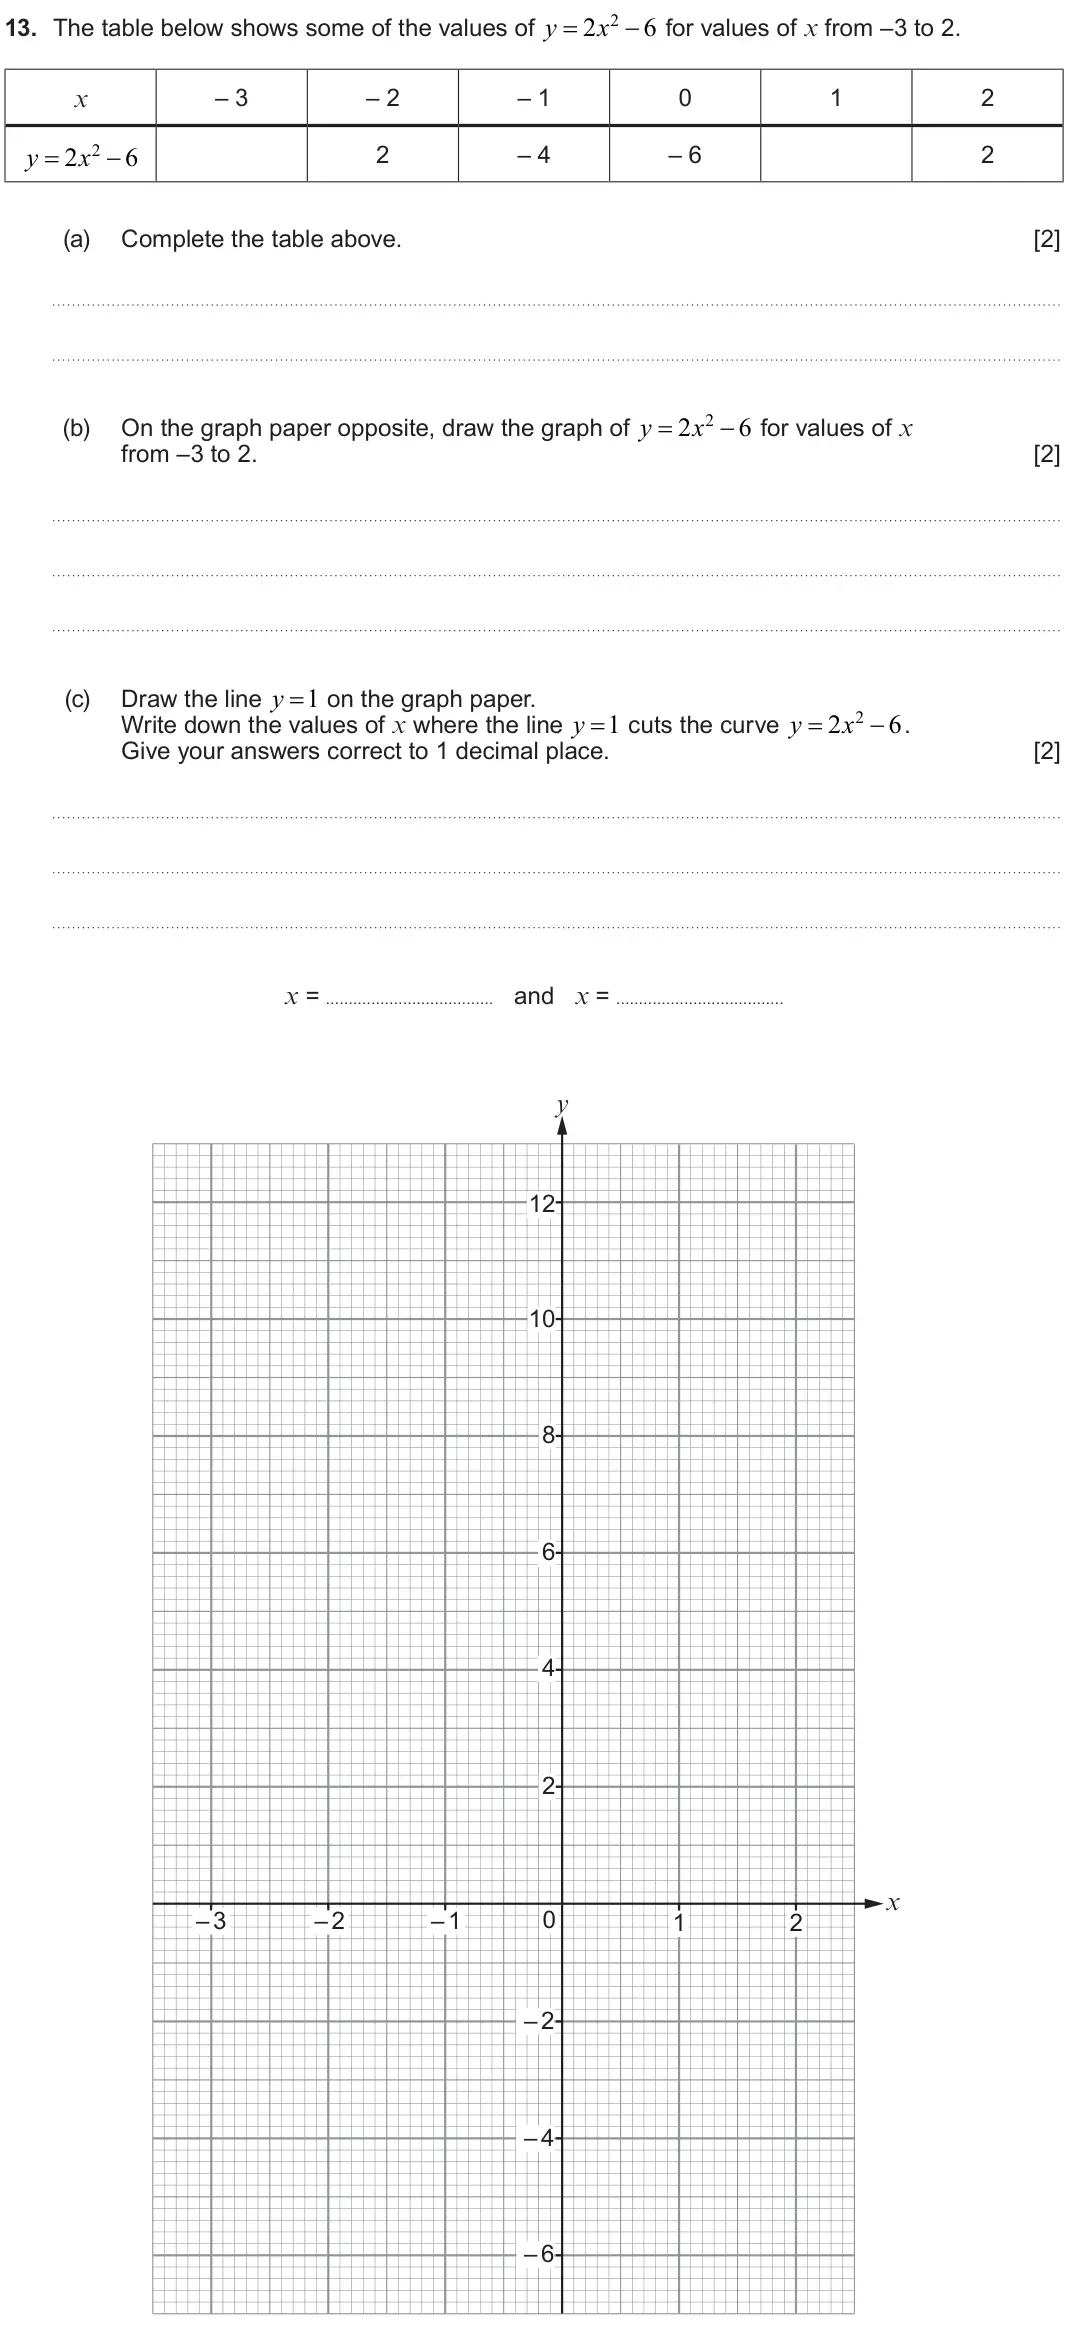
- June 2025, Unit 1 Intermediate, Q13 (6 marks): 2 6 y x for values of x from –3 to 2. 13. The table below shows some of the values of x – 3 – 2 – 1 0 1 2 2 y 2 x 6 2 – 4 – 6 2 (a) Complete the table a
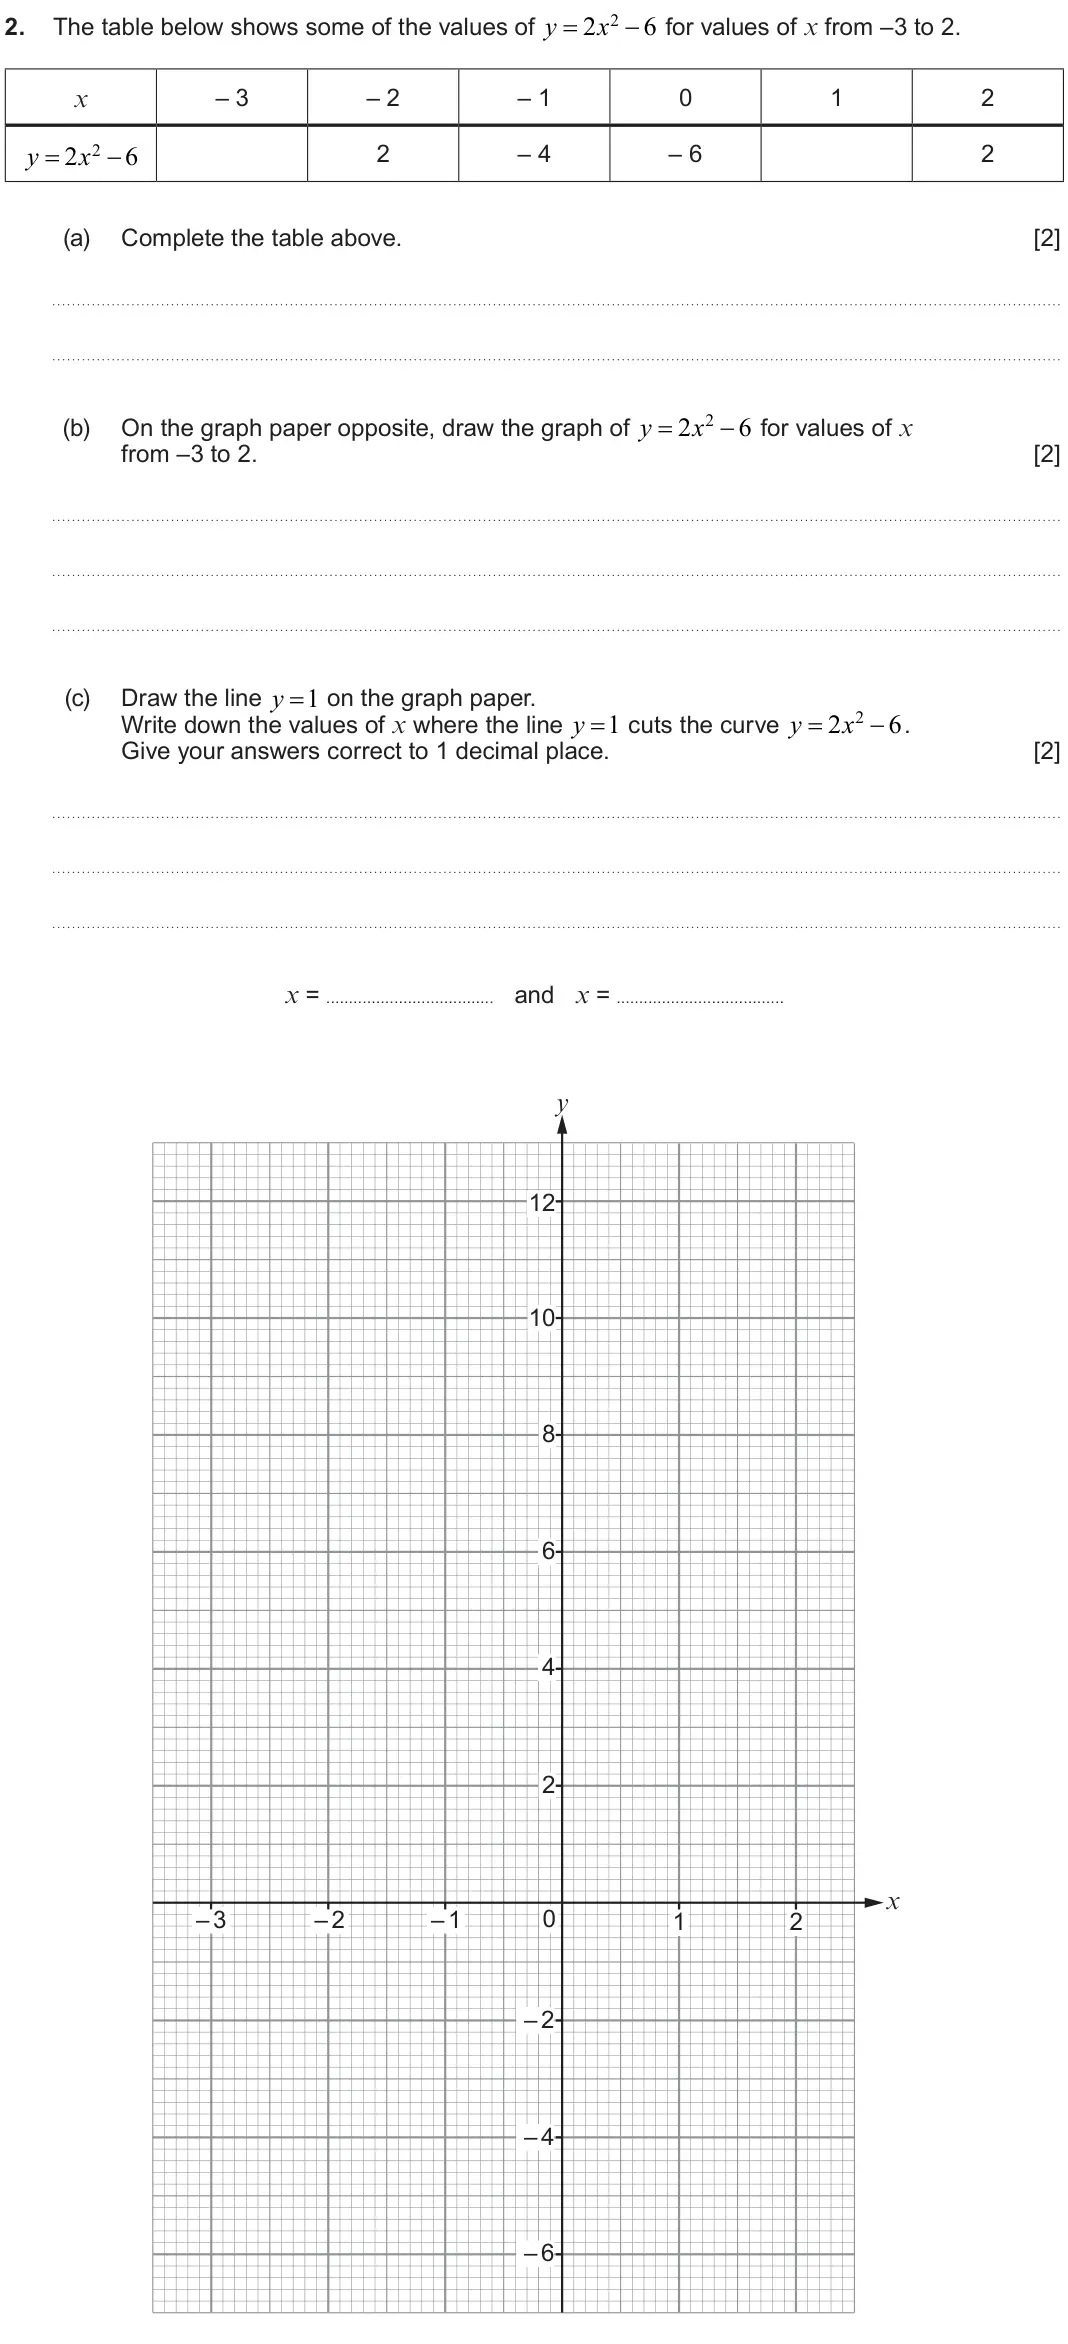
- June 2025, Unit 1 Higher, Q2 (6 marks): y 2 x 2 6 for values of x from –3 to 2. 2. The table below shows some of the values of x – 3 – 2 – 1 0 1 2 2 2 6 2 – 4 – 6 2 y x (a) Complete the table
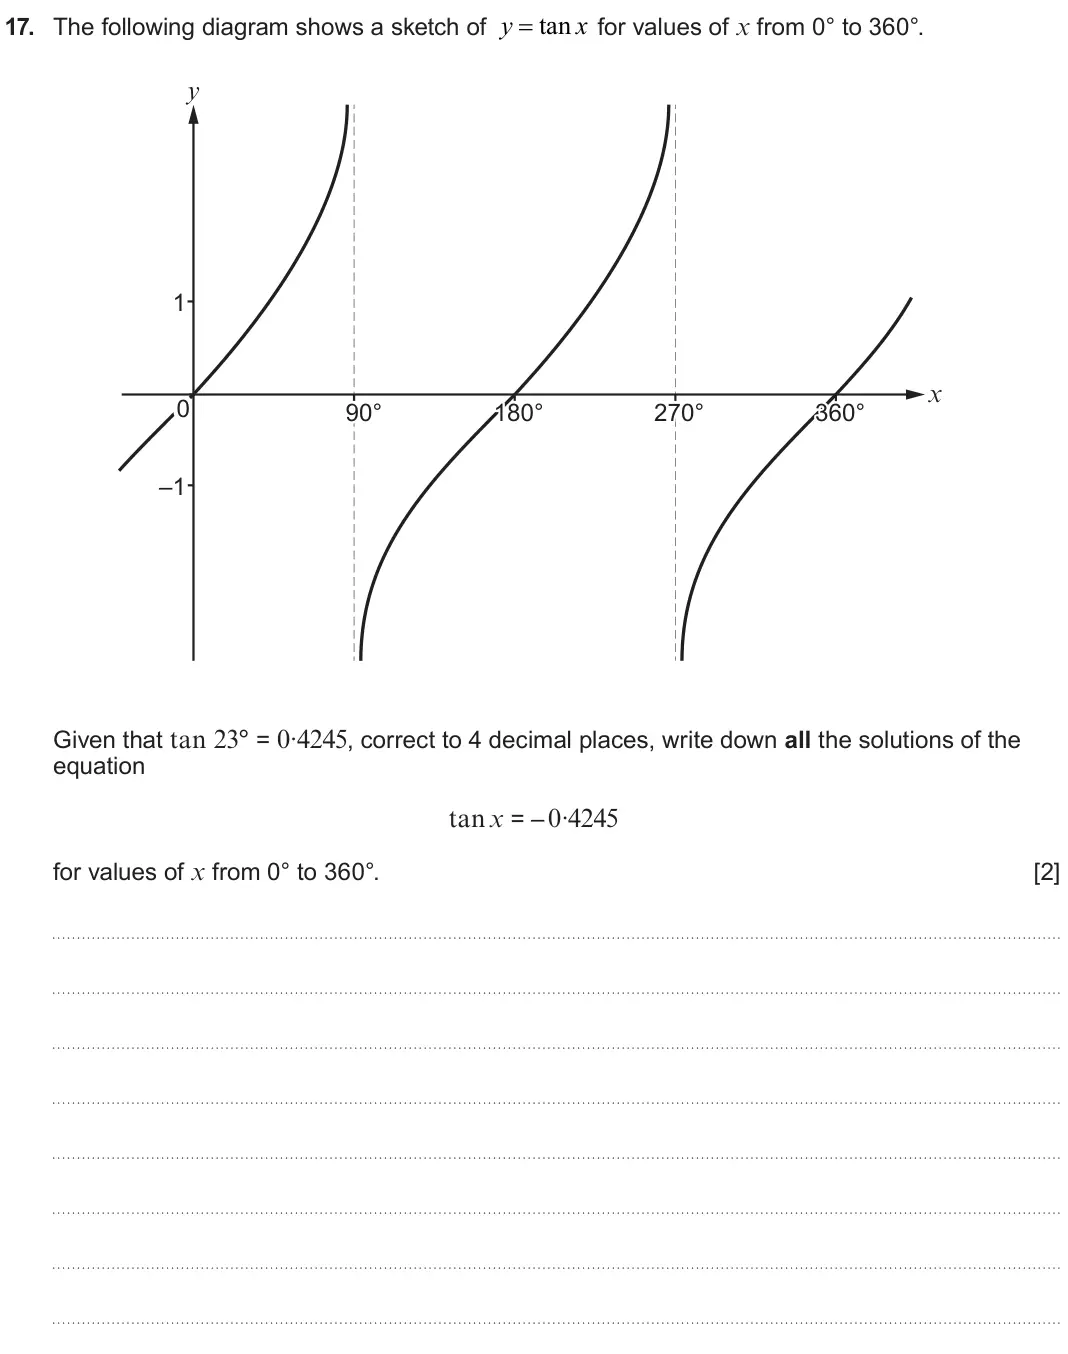
- June 2025, Unit 1 Higher, Q17 (2 marks): y tan x 17. The following diagram shows a sketch of for values of x from 0° to 360°. y 1 x 0 90° 90° 180° 180° 270° 270° 360° 360° –1 Given that tan 23° = 0·4
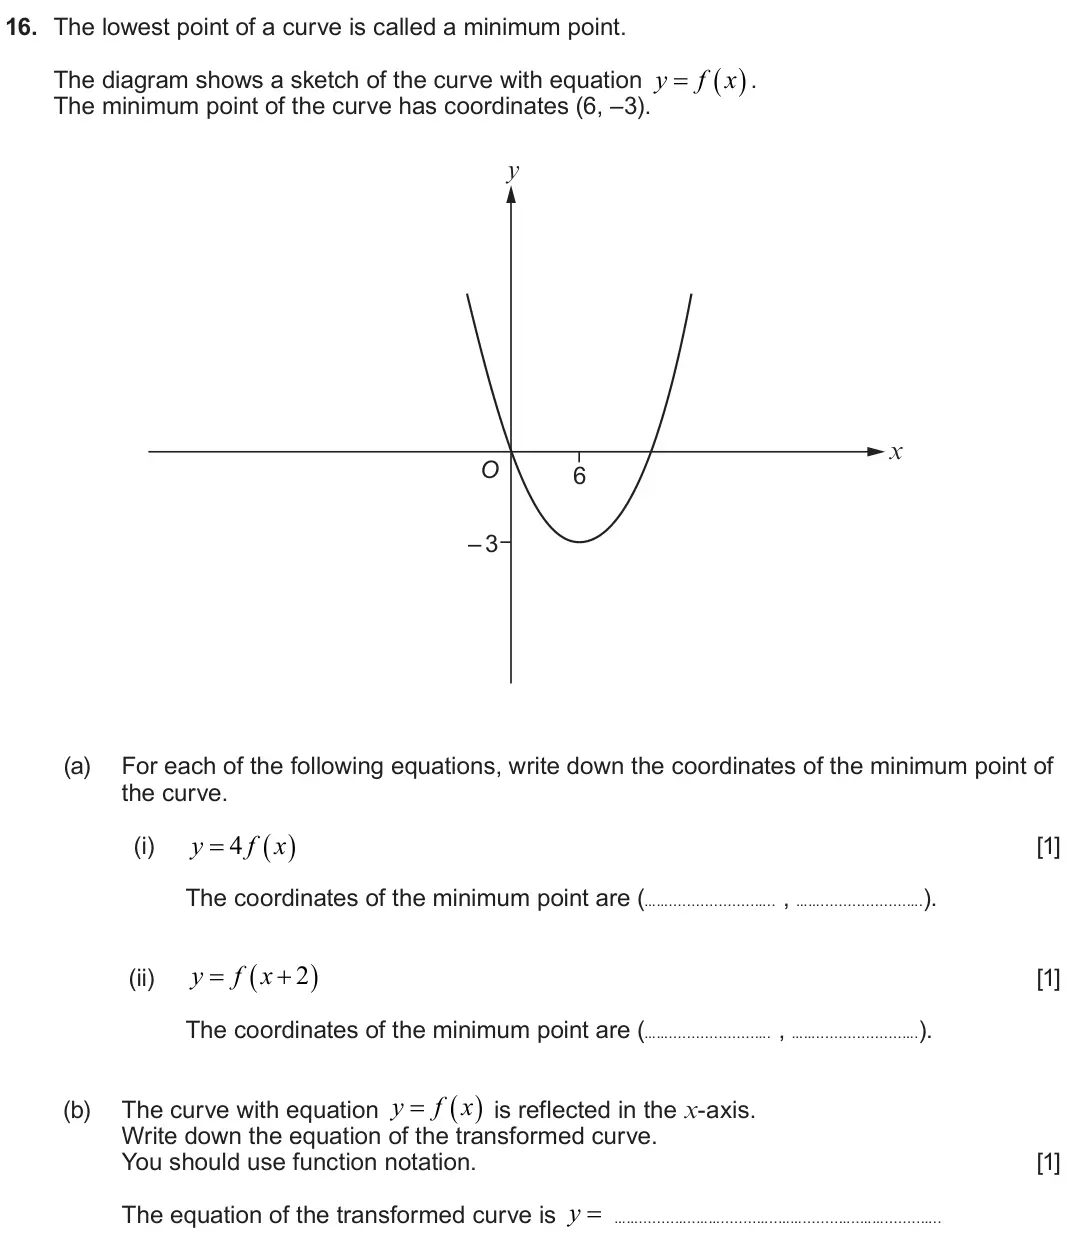
- June 2025, Unit 2 Higher, Q16 (3 marks): The lowest point of a curve is called a minimum point. y f x The diagram shows a sketch of the curve with equation . The minimum point of the curve has coo
- November 2024, Unit 1 Foundation, Q11 (5 marks): A number machine is shown below. ADD MULTIPLY INPUT OUTPUT 4 BY 5 Complete the table below. [5] INPUT OUTPUT –7 –100 2·5 n Space for working:
- November 2024, Unit 1 Intermediate, Q1 (5 marks): A number machine is shown below. ADD MULTIPLY INPUT OUTPUT 4 BY 5 Complete the table below. [5] INPUT OUTPUT –7 –100 2·5 n Space for working:
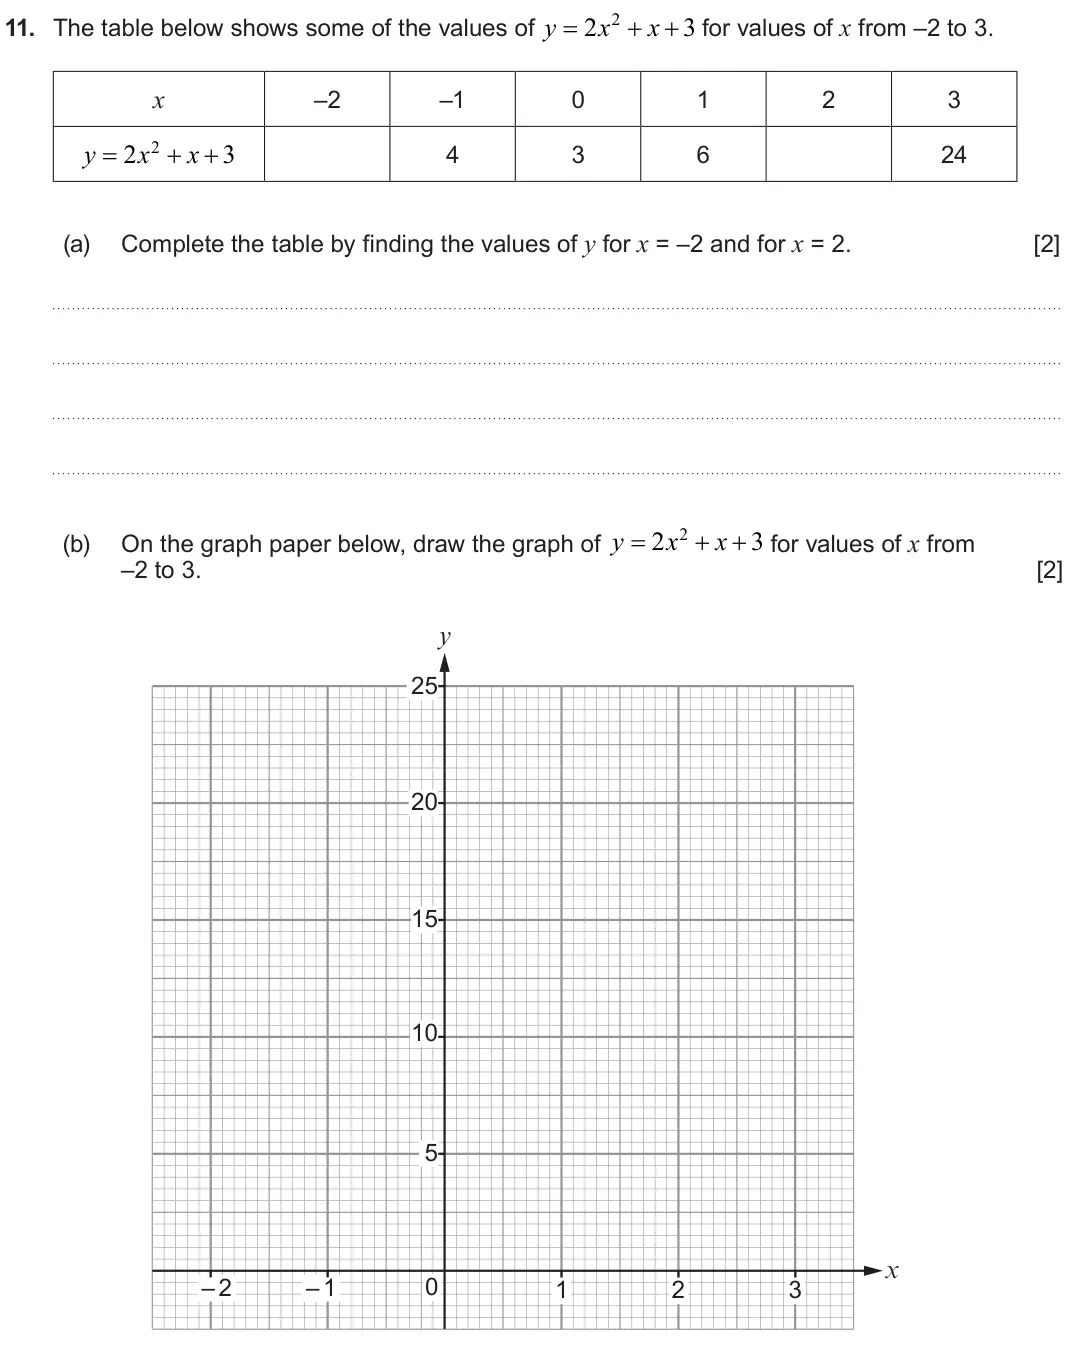
- November 2024, Unit 1 Intermediate, Q11 (4 marks): y 2 x x for values of x from –2 to 3. 3 11. The table below shows some of the values of x –2 –1 0 1 2 3 y 2 x 2 x 3 4 3 6 24 (a) Complete the table
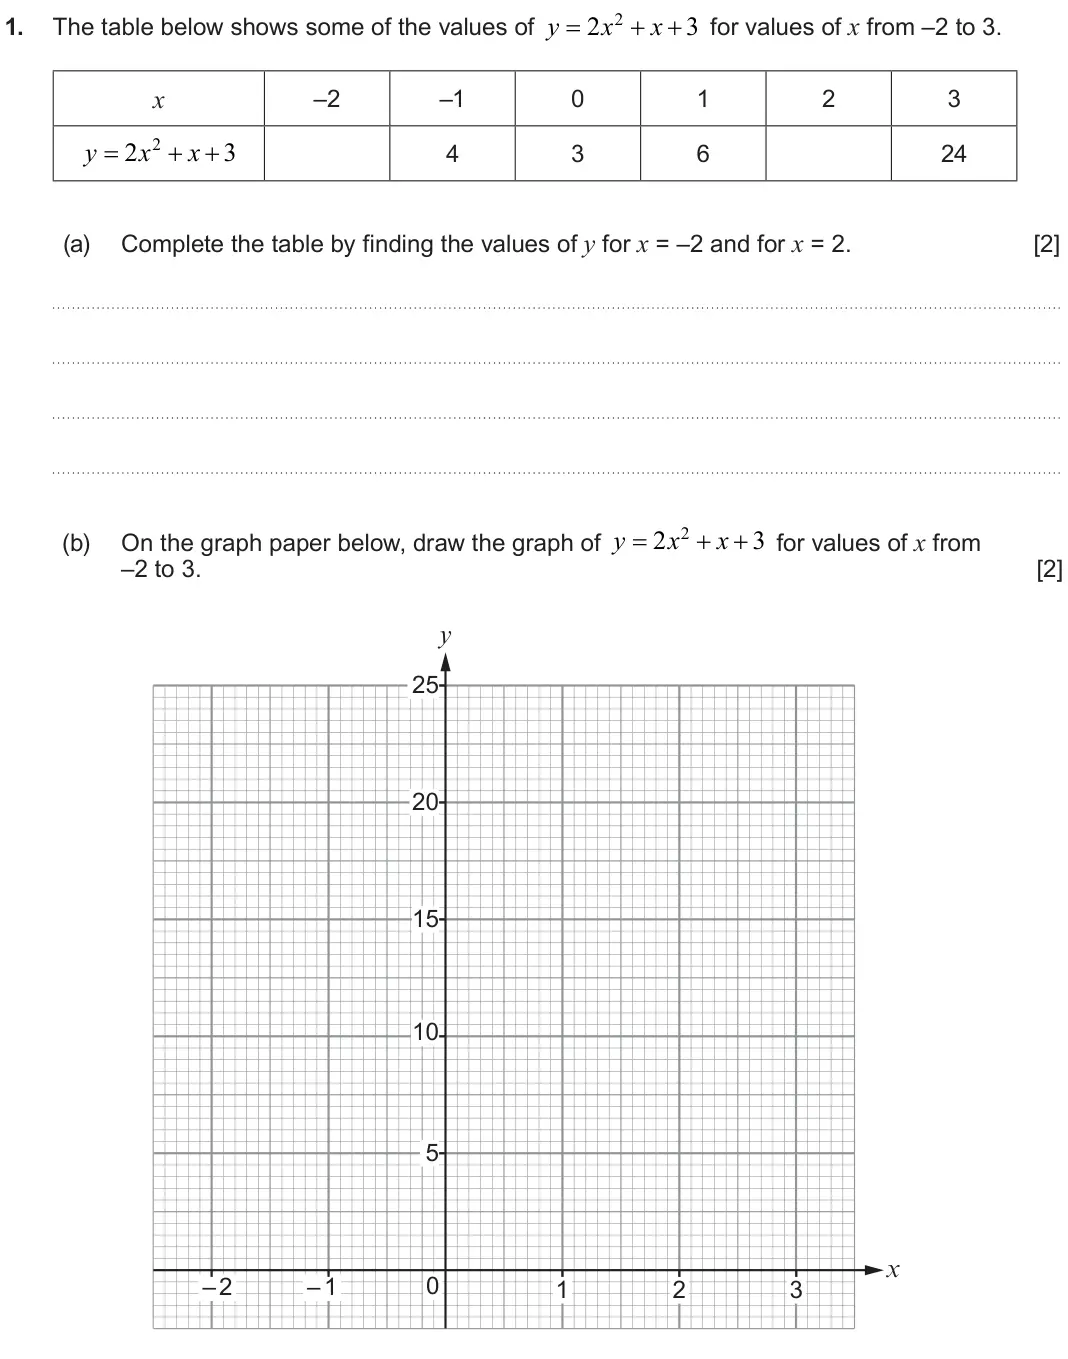
- November 2024, Unit 1 Higher, Q1 (4 marks): y 2 x 2 x 3 for values of x from –2 to 3. 1. The table below shows some of the values of x –2 –1 0 1 2 3 2 2 3 y x x 4 3 6 24 (a) Complete the table
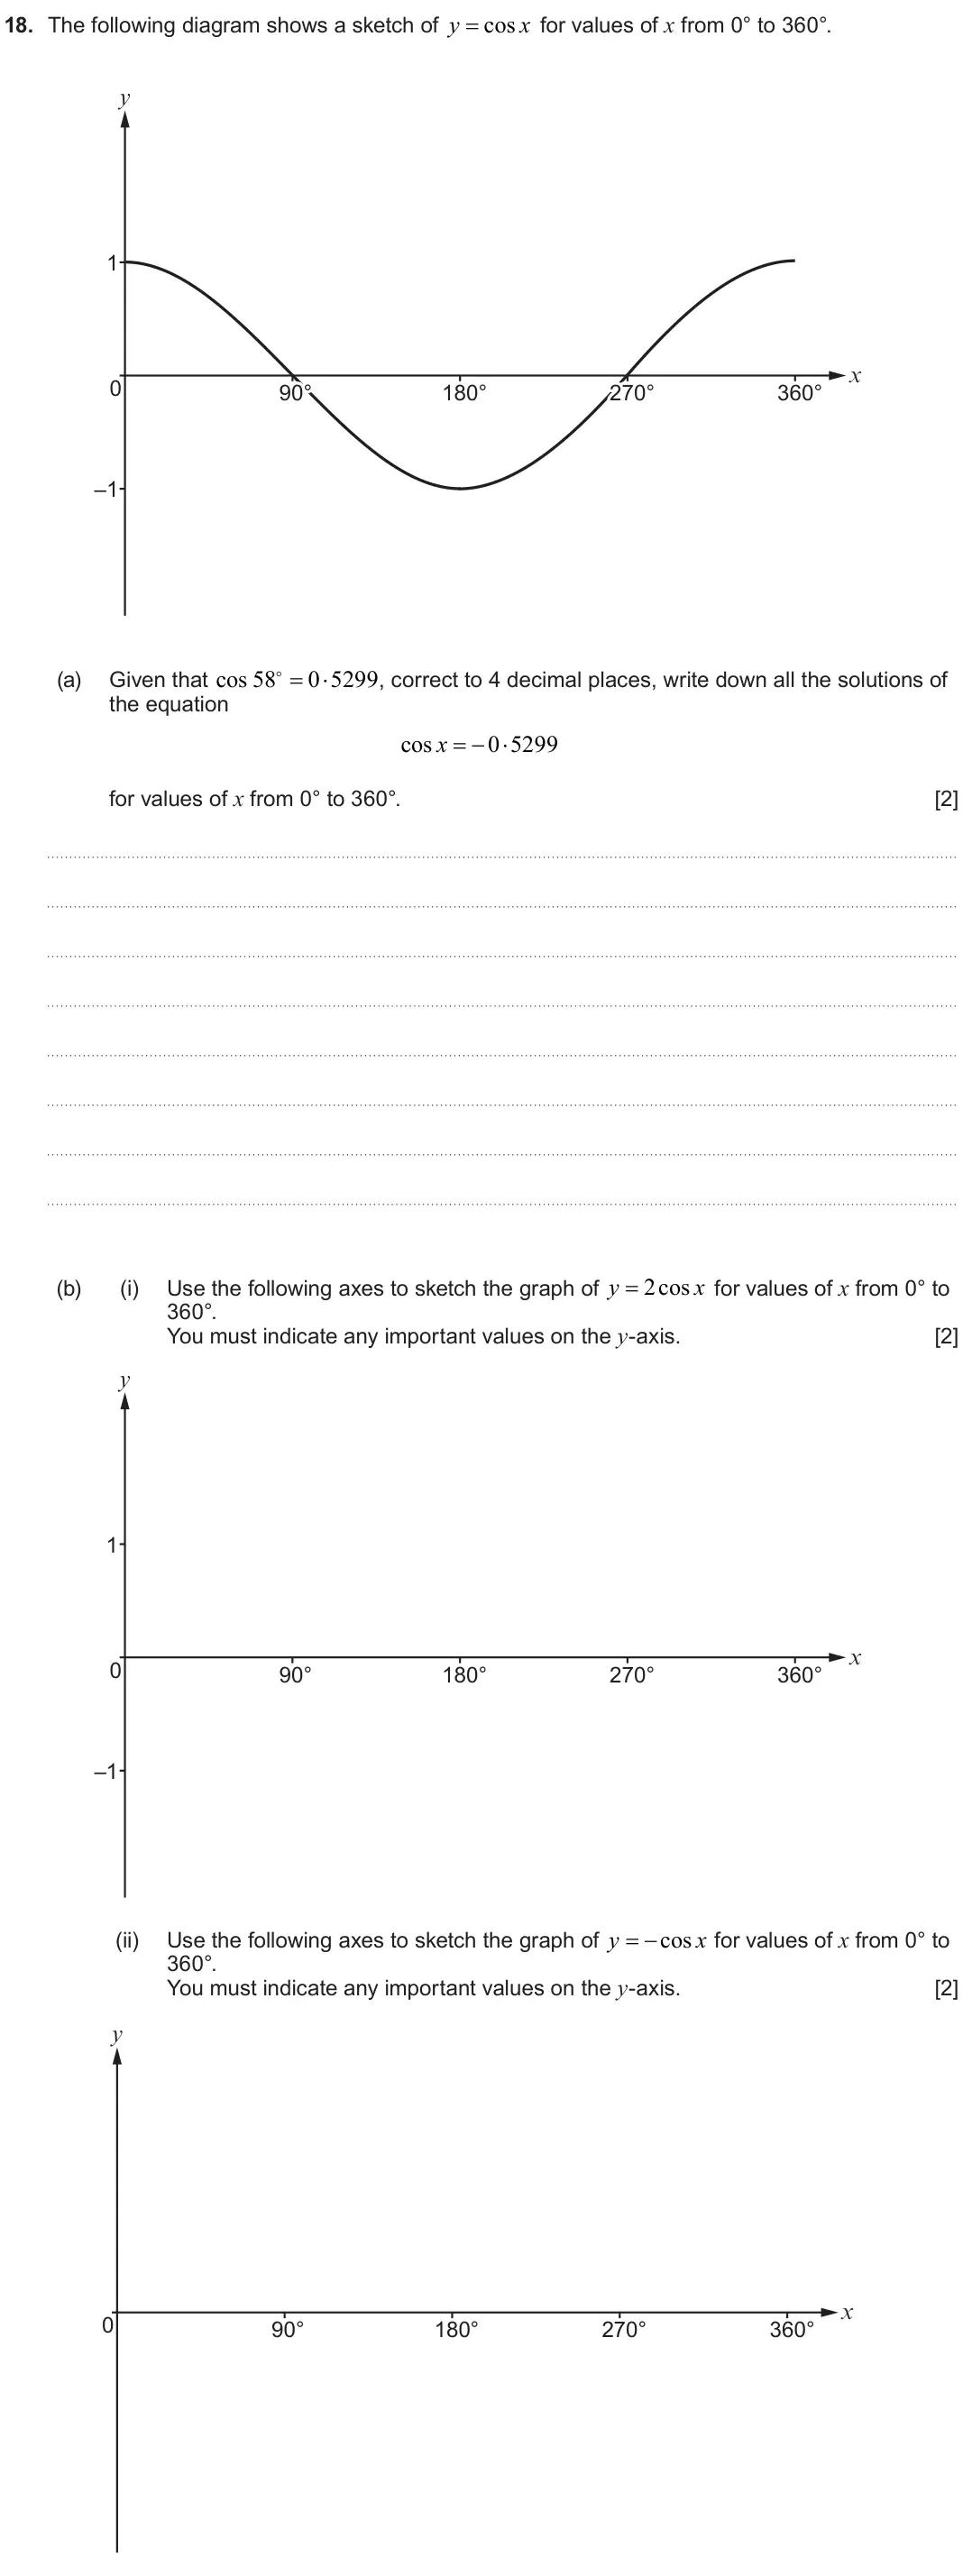
- November 2024, Unit 1 Higher, Q18 (6 marks): y cos x for values of x from 0° to 360°. 18. The following diagram shows a sketch of y 1 x 0 90° 90° 90° 180° 270° 270° 360° –1 Given that cos 58 0 5299
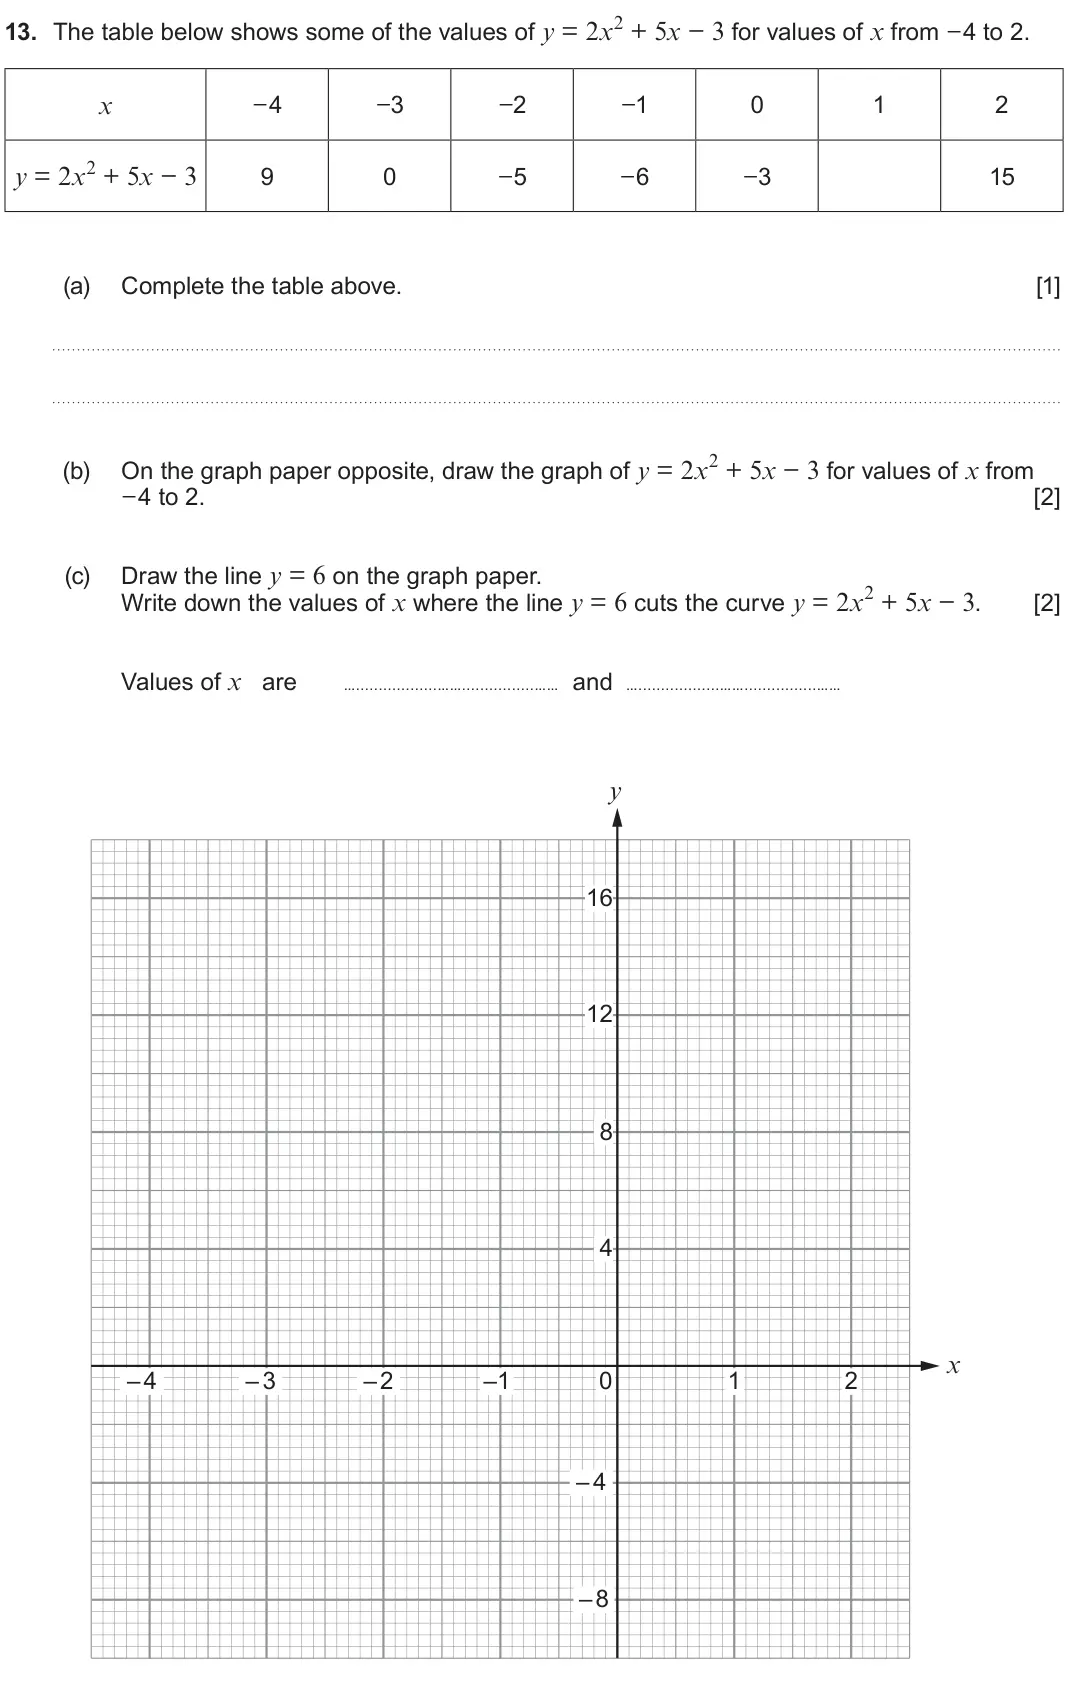
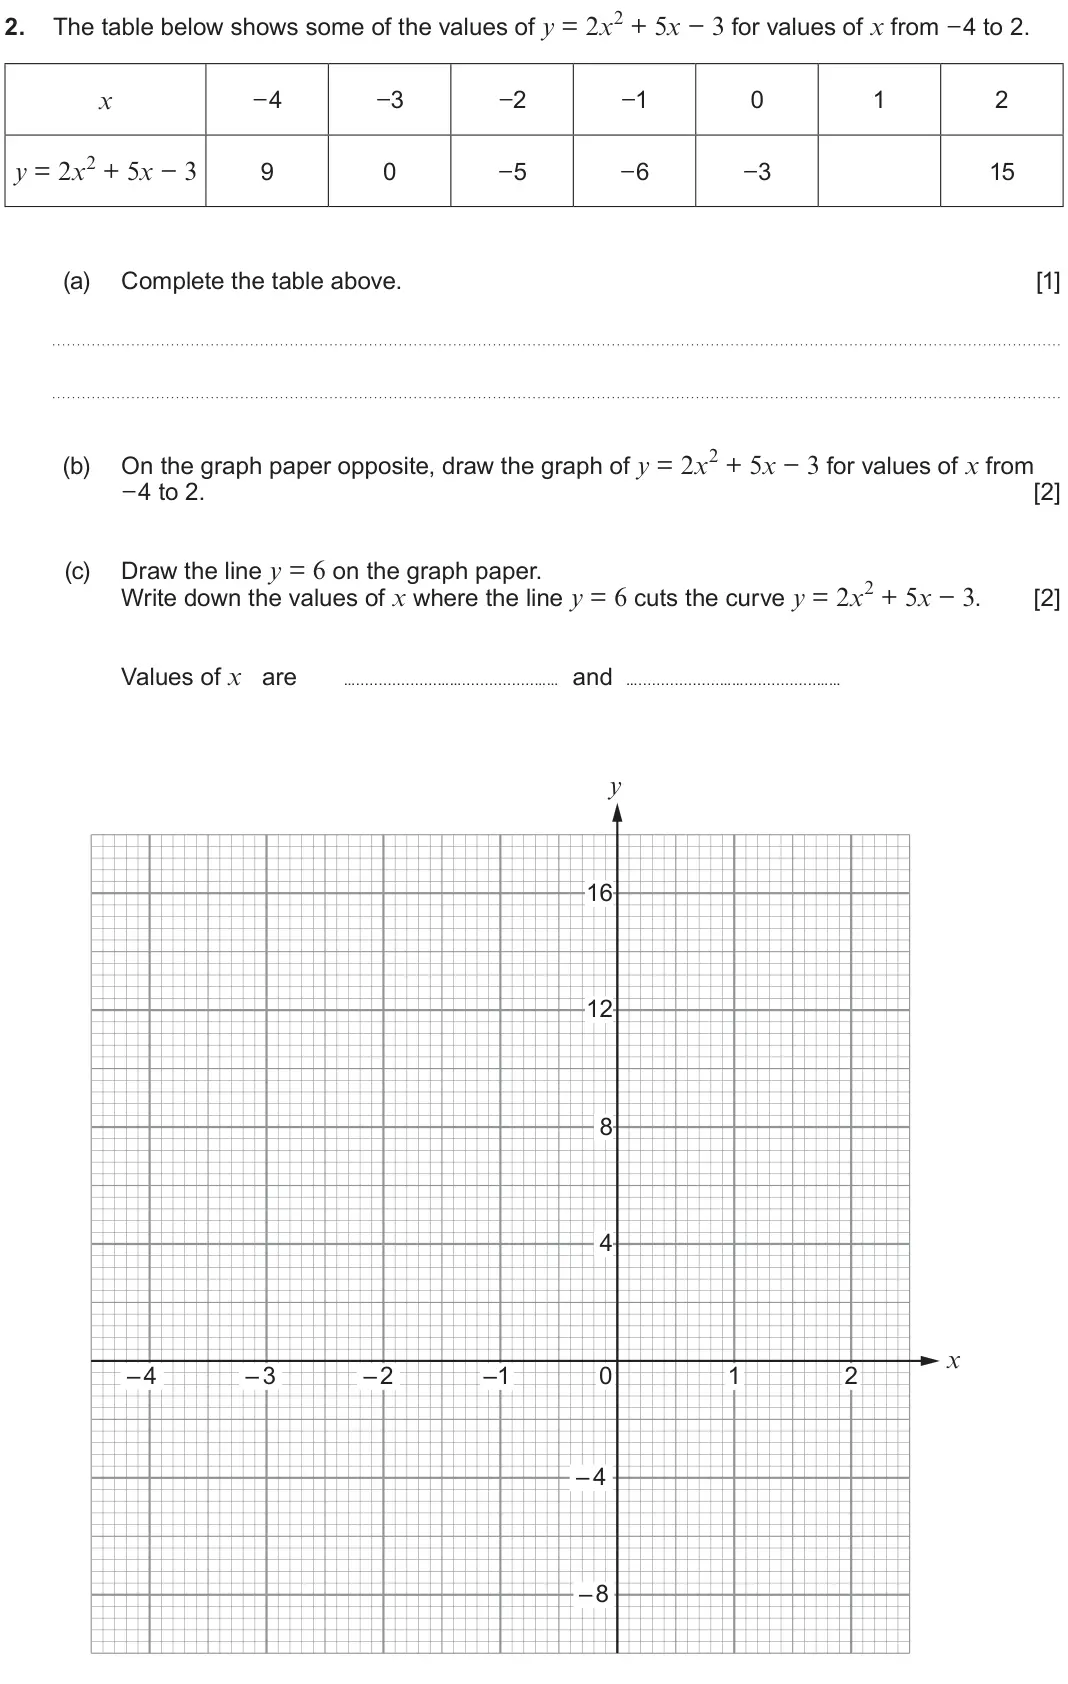
- June 2024, Unit 2 Intermediate, Q13 (5 marks): The table below shows some of the values of y = 2x2 + 5x − 3 for values of x from − 4 to 2. − 4 −3 −2 −1 0 1 2 x y = 2x2 + 5x − 3 9 0 −5 −6 −3 15 (a) Complete t
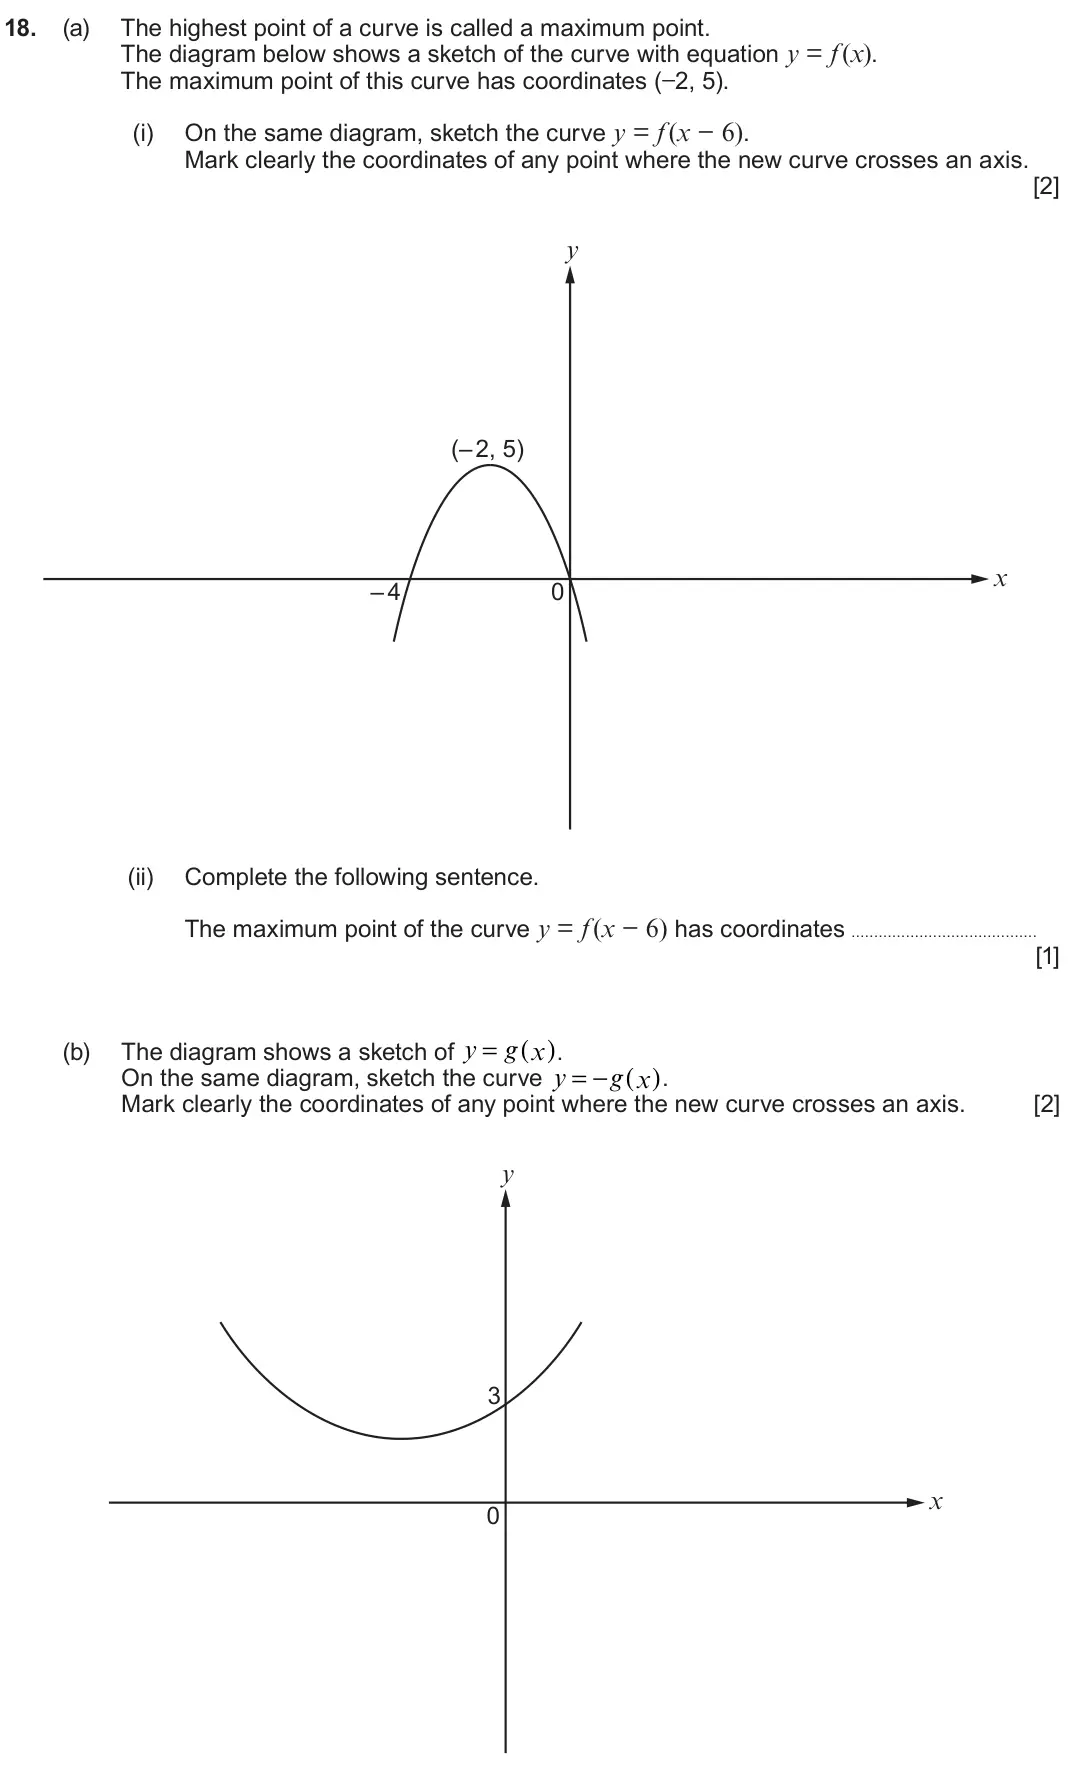
- June 2024, Unit 1 Higher, Q18 (5 marks): (a) The highest point of a curve is called a maximum point. The diagram below shows a sketch of the curve with equation y = f (x). The maximum point of this cur
- June 2024, Unit 2 Higher, Q2 (5 marks): The table below shows some of the values of y = 2x2 + 5x − 3 for values of x from − 4 to 2. 2. − 4 −3 −2 −1 0 1 2 x y = 2x2 + 5x − 3 9 0 −5 −6 −3 15 (a) Complet
- June 2024, Unit 2 Higher, Q16 (4 marks): y = cosx 16. (a) Sketch the curve on the axes below, for values of x from 0° to 360°. You must indicate any important values on both axes. [2] y x O 2cosx = 1 (
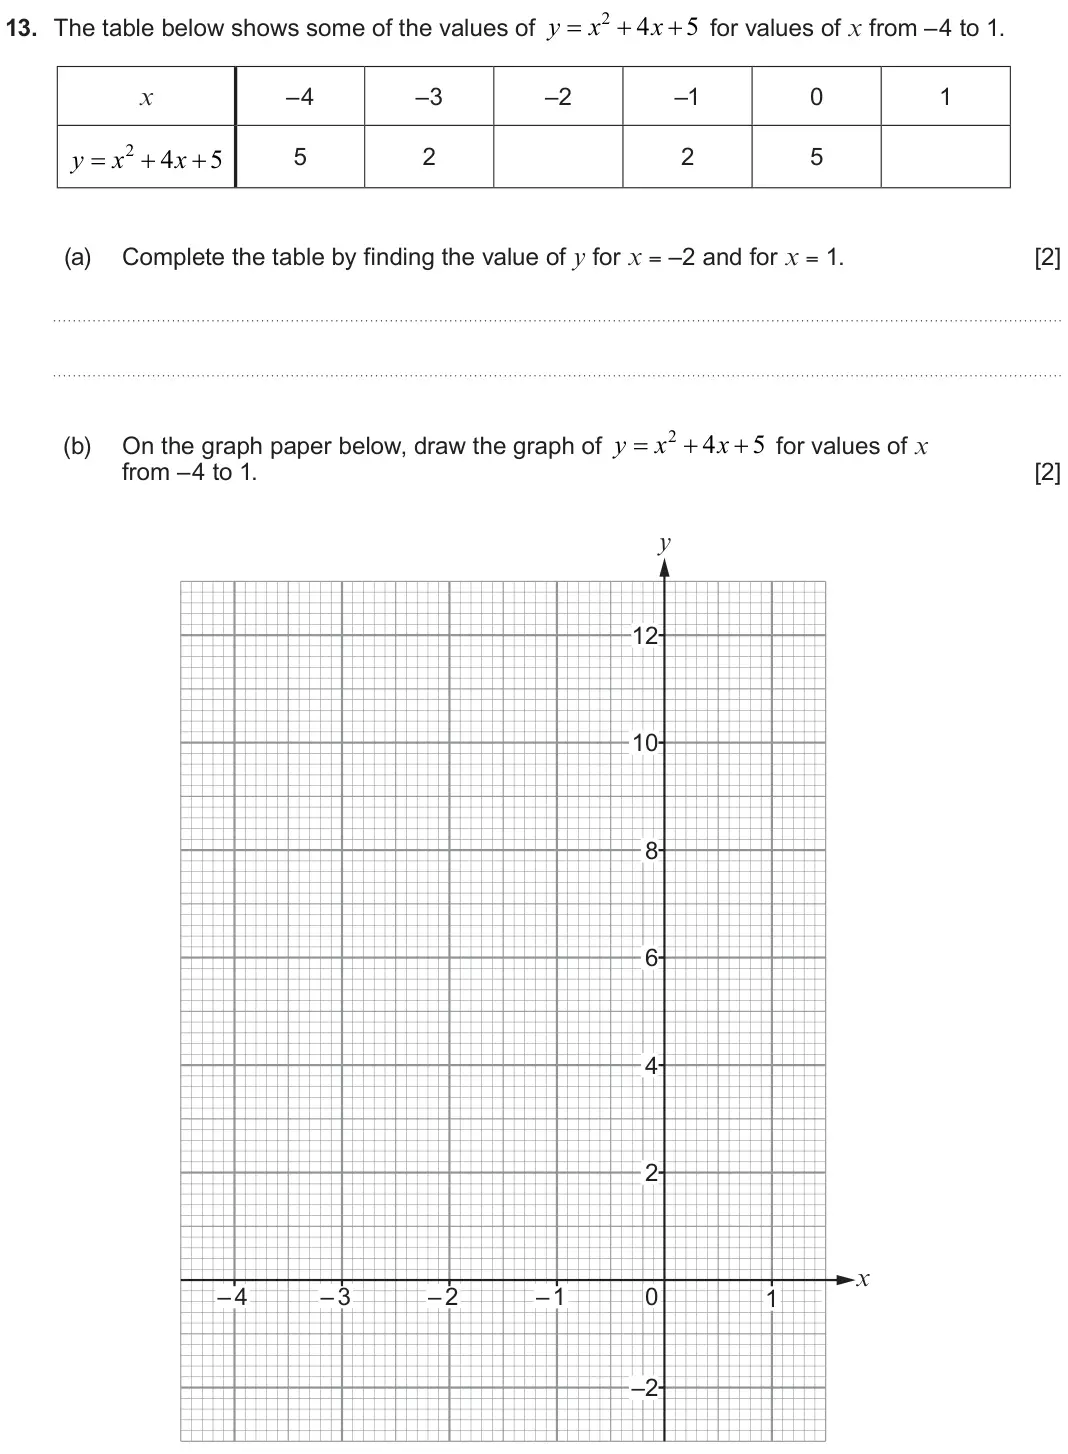
- November 2023, Unit 2 Intermediate, Q13 (4 marks): y x 4 x 5 13. The table below shows some of the values of for values of x from –4 to 1. x –4 –3 –2 –1 0 1 2 y x 4 x 5 5 2 2 5 (a) Complete the table
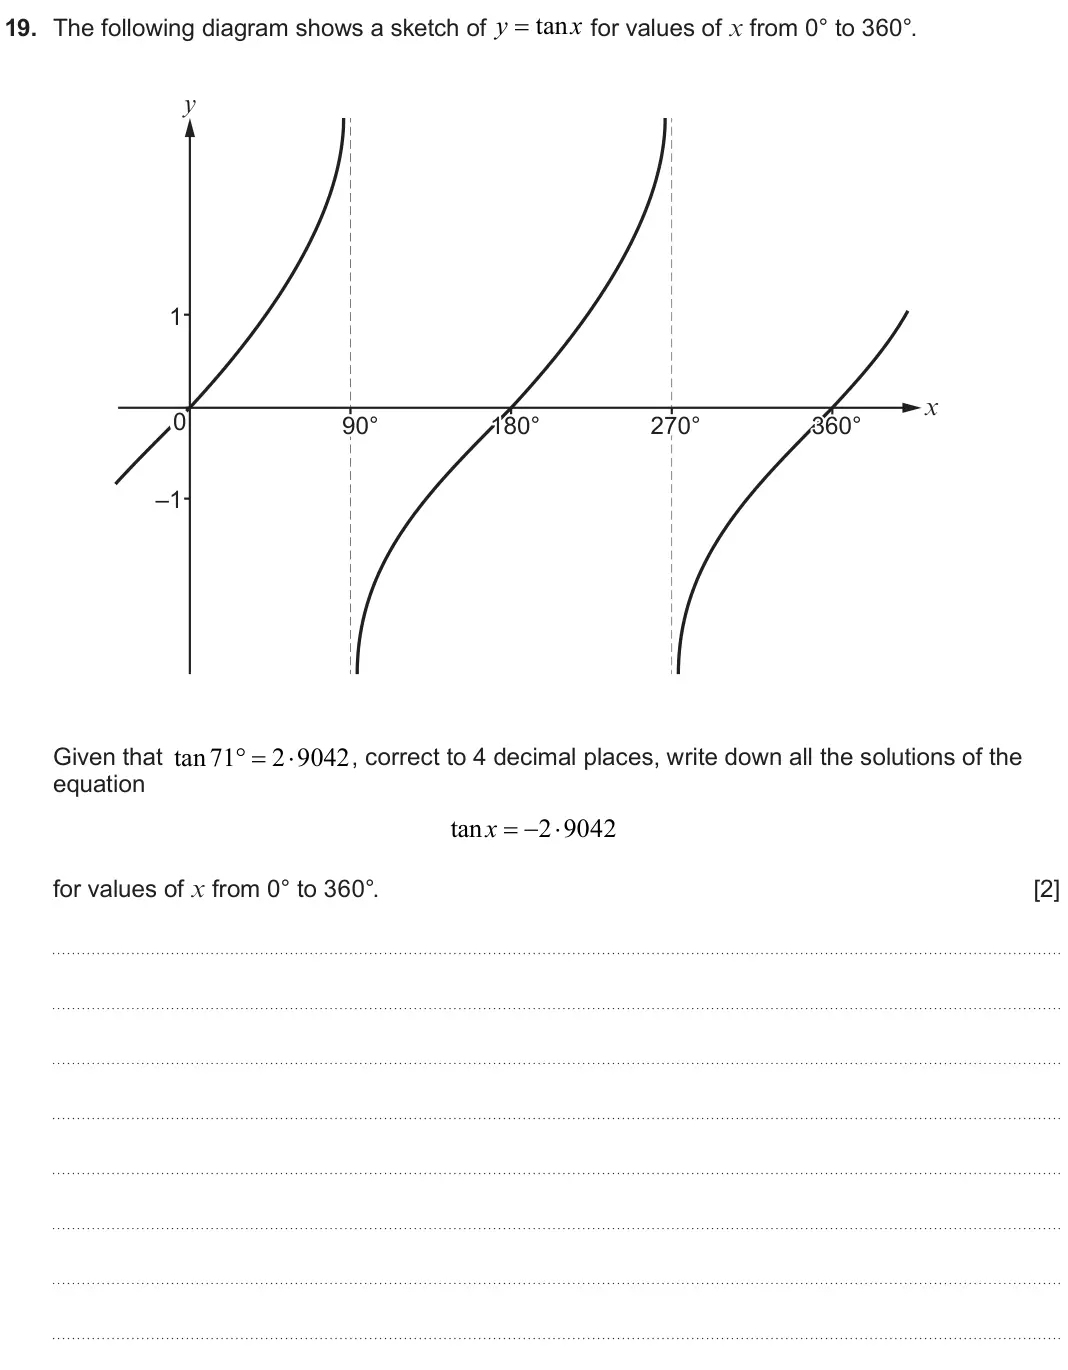
- November 2023, Unit 1 Higher, Q19 (2 marks): y tan x 19. The following diagram shows a sketch of for values of x from 0° to 360°. y 1 x 0 90° 90° 180° 180° 270° 270° 360° 360° –1 Given that tan71 2 90
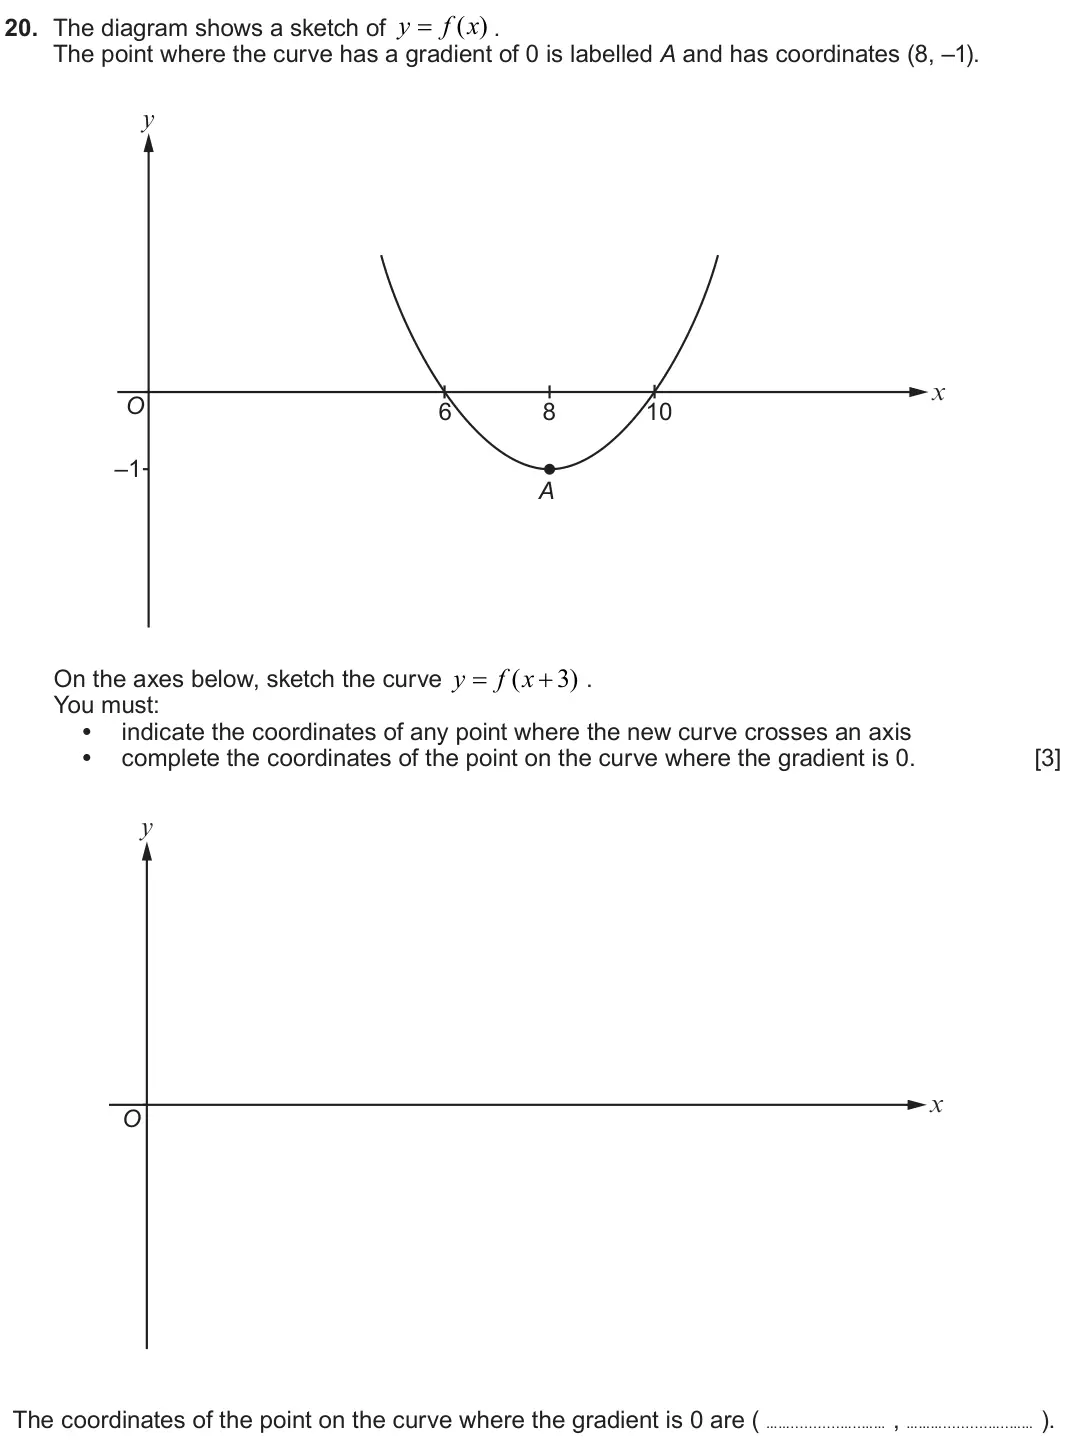
- November 2023, Unit 1 Higher, Q20 (3 marks): y f x ( ) 20. The diagram shows a sketch of . The point where the curve has a gradient of 0 is labelled A and has coordinates (8, –1). y x O 6 8 10 –1 A y f
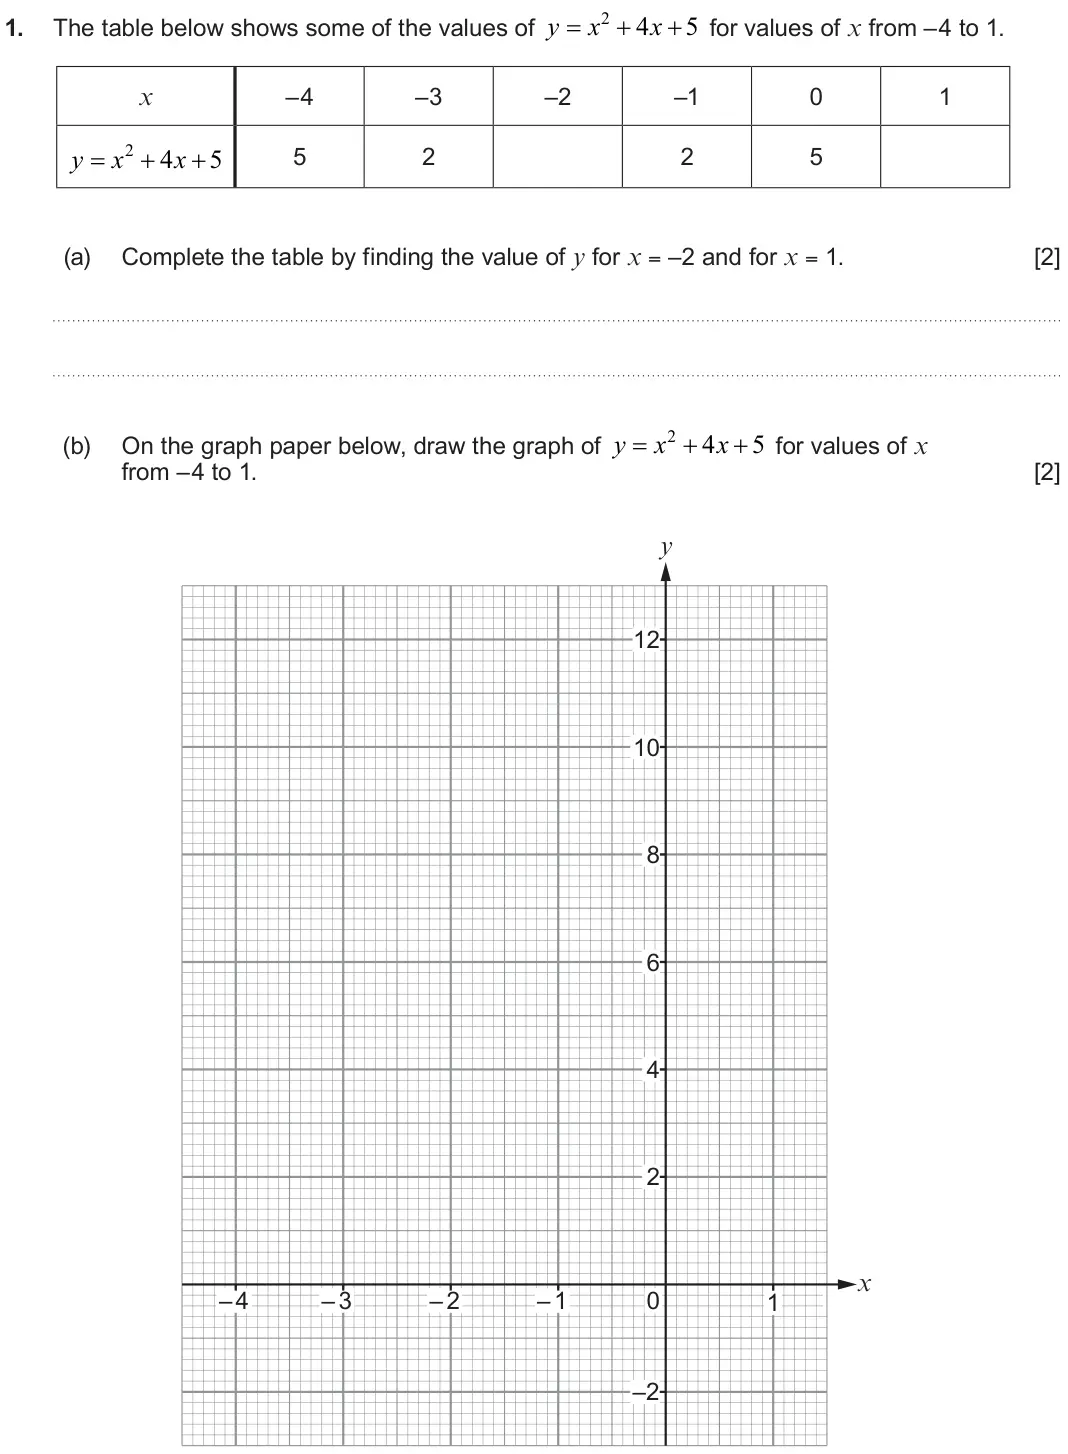
- November 2023, Unit 2 Higher, Q1 (4 marks): y x 4 x 5 1. The table below shows some of the values of for values of x from –4 to 1. x –4 –3 –2 –1 0 1 2 y x 4 x 5 5 2 2 5 (a) Complete the table
- November 2023, Unit 2 Higher, Q16 (3 marks): y x 16. (a) Put a tick next to the graph that represents the equation . [1] y x O y x O y x O y x O y x O 1 y (b) Use the axes below to sketch the graph o
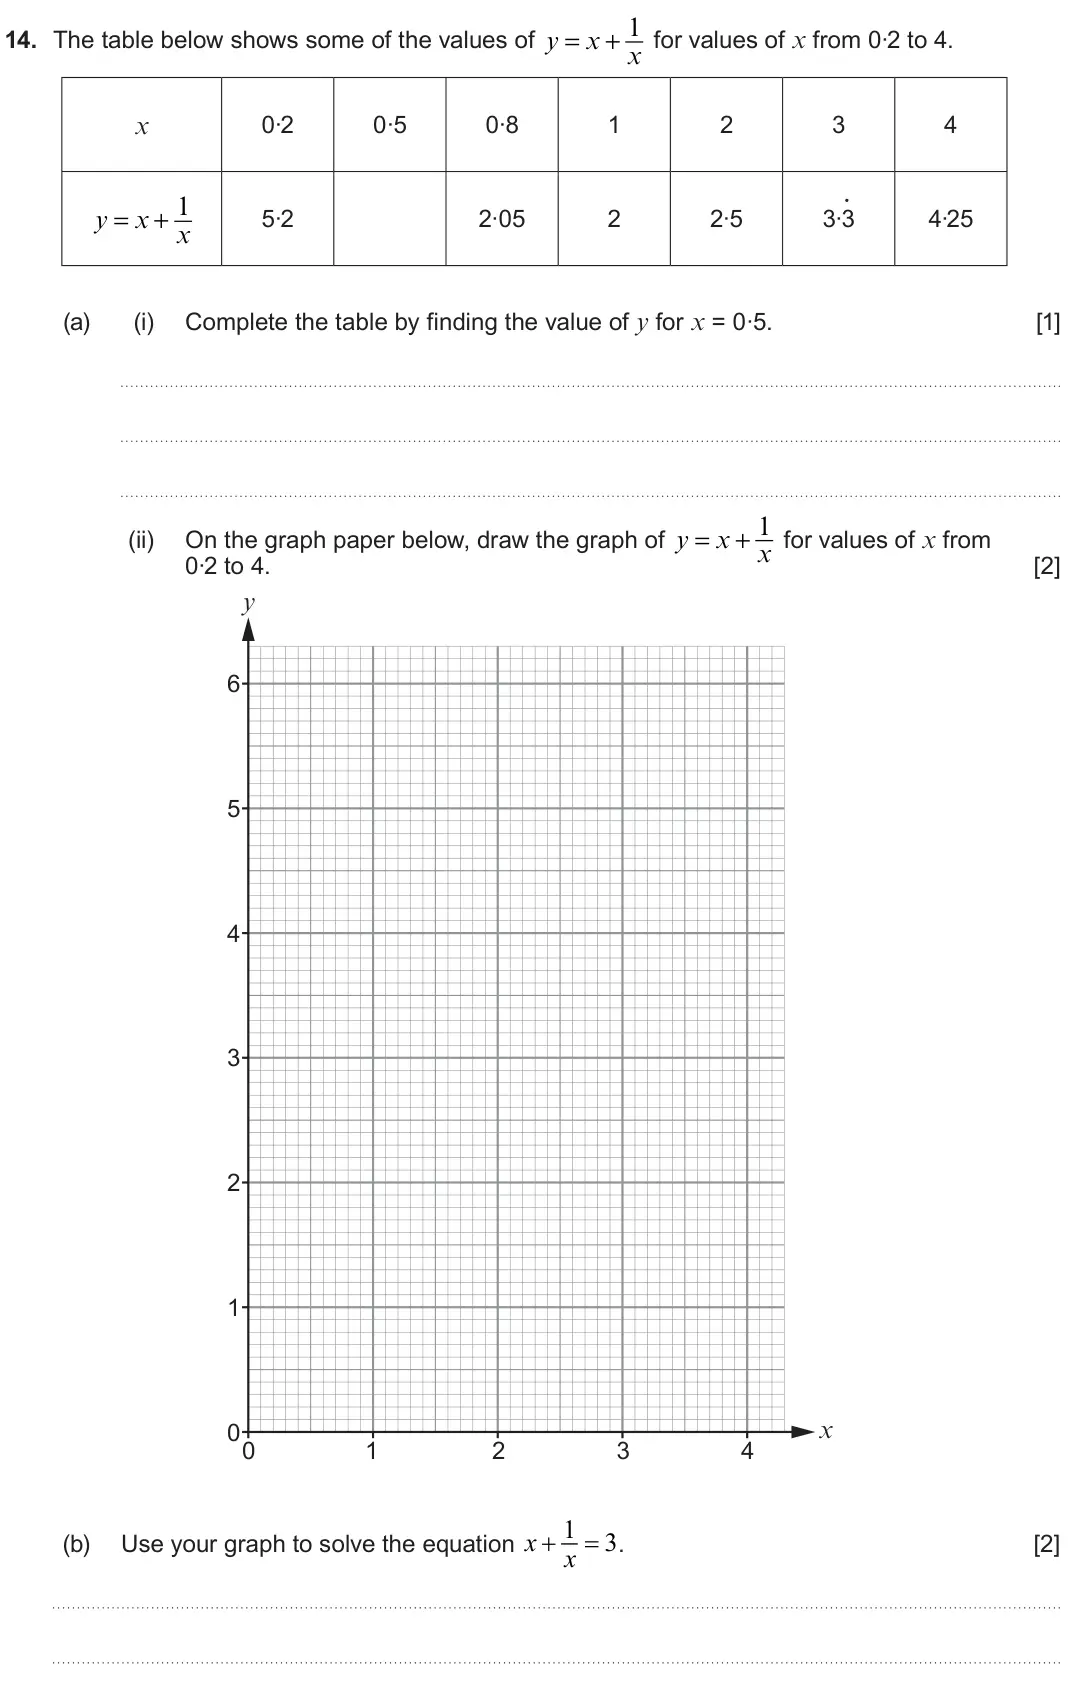
- June 2023, Unit 1 Higher, Q14 (5 marks): The table below shows some of the values of y = x + 1 x for values of x from 0·2 to 4. 0·2 0·5 0·8 1 2 3 4 x y = x + 1 • 5·2 2·05 2 2·5 3·3 4·25 x (a) (i) Compl
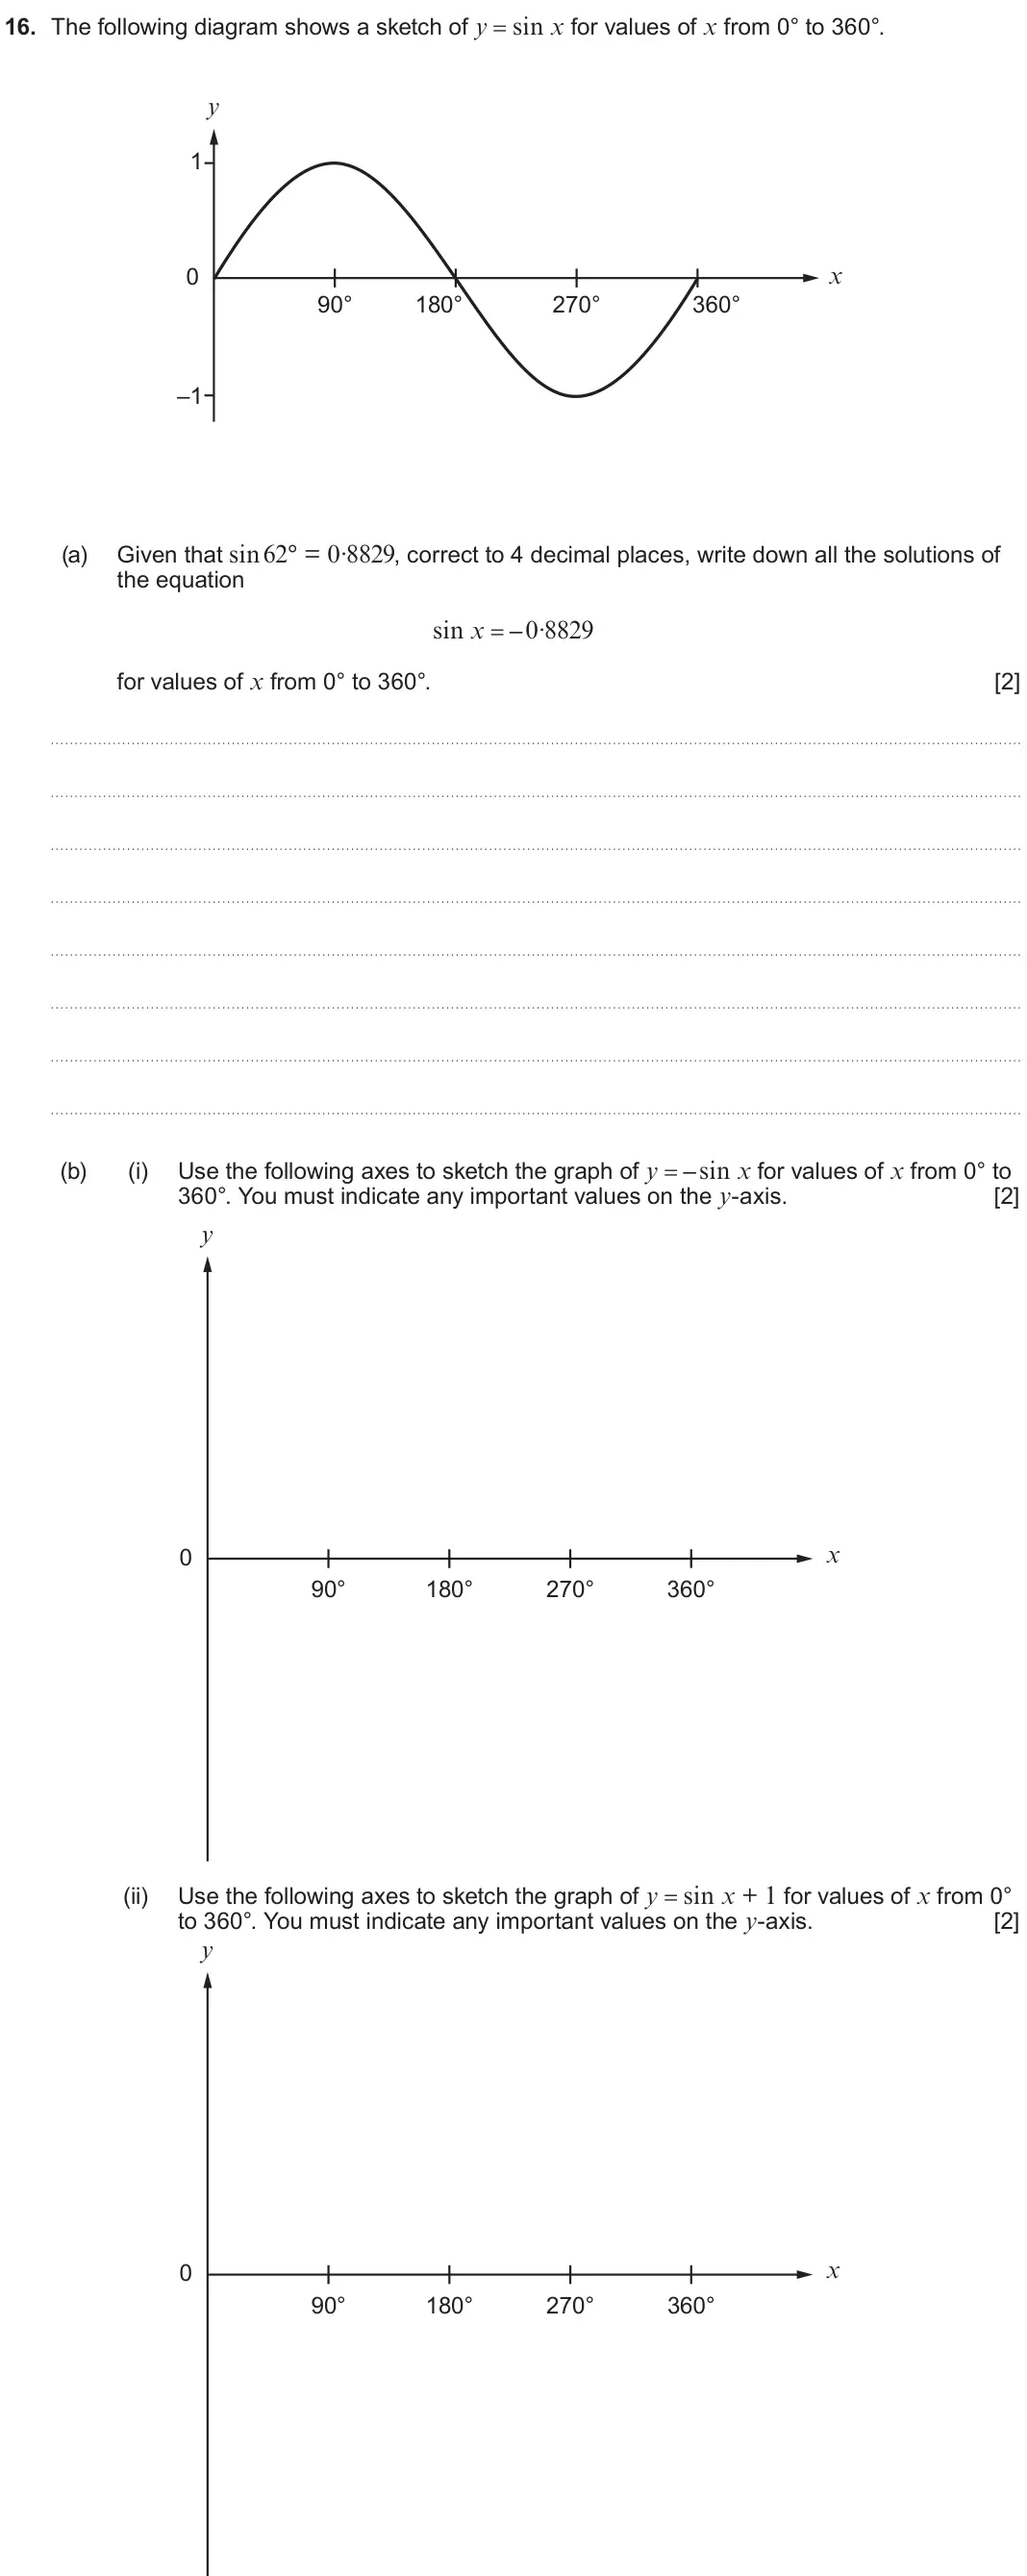
- June 2023, Unit 1 Higher, Q16 (6 marks): The following diagram shows a sketch of y = sin x for values of x from 0° to 360°. y 1 x 0 90° 180° 270° 360° –1 (a) Given that sin62° = 0·8829, correct to 4 de
- June 2023, Unit 2 Higher, Q12 (6 marks): Factorise 8x2 −18 . 12. (a) [3] Hence solve 8x2 −18 = 0 . (b) [1] Hence, sketch the graph of y = 8x2 −18 on the axes below. (c) Mark clearly the coordinates of
- November 2022, Unit 1 Higher, Q19 (3 marks): The highest point of a curve is called a maximum point. ( ). The diagram below shows a sketch of the curve with equation y = f x The maximum point of this curve
- November 2022, Unit 1 Higher, Q20 (2 marks): The following diagram shows a sketch of y = cosx for values of x from 0° to 360°. y 1 x 0 90° 90° 180° 180° 270° 270° 360° 360° – 1 Given that cos25! = 0 ⋅9063
- November 2022, Unit 2 Higher, Q17 (1 mark): ( ) x − 7 ( ) describes only one of the graphs below. 17. The equation y = x − 3 Put a tick (√) in the box next to the graph that correctly shows this equation.
- June 2022, Unit 1 Intermediate, Q11 (5 marks): The table below shows some of the values of y = x2 + x − 4 for values of x from –3 to 3. x –3 –2 –1 0 1 2 3 y = x2 + x − 4 2 –2 – 4 2 8 (a) Complete the table b
- June 2022, Unit 1 Higher, Q2 (5 marks): The table below shows some of the values of y = x2 + x − 4 for values of x from –3 to 3. 2. x –3 –2 –1 0 1 2 3 y = x2 + x − 4 2 –2 – 4 2 8 Complete the table by
- June 2022, Unit 1 Higher, Q9 (2 marks): Sketch the curve y = sinx, for values of x in the range x = 0° to x = 360° . 9. (a) [1] y 1 x 0 0 90° 180° 270° 360° –1 (b) Sketch the curve y = tanx, for value
- June 2022, Unit 1 Higher, Q16 (2 marks): ( ). The following diagram shows a sketch of the curve y = f x 16. (a) y 4 2 x – 4 – 2 0 2 4 – 2 – 4 The curve is transformed, as shown below. y 4 2 x 0 – 4 – 2
- June 2022, Unit 2 Higher, Q14 (3 marks): The graph of y = 12 + x – x2, for values of x from x = 0 to x = 4, is drawn below. y 12 10 8 6 4 2 x 0 0 1 2 3 4 5 Use the trapezium rule, with the ordinates x
- November 2021, Unit 1 Intermediate, Q12 (4 marks): Complete the table below. Draw the graph of y = 7 − x2 for values of x between −2 and 4. Use the graph paper below. [4] −2 −1 0 1 2 3 4 x 3 7 6 3 −9 y = 7 − x2
- November 2021, Unit 1 Higher, Q3 (4 marks): Complete the table below. Draw the graph of y = 7 − x2 for values of x between −2 and 4. Use the graph paper below. [4] −2 −1 0 1 2 3 4 x 3 7 6 3 −9 y = 7 − x2
- November 2021, Unit 1 Higher, Q17 (2 marks): The following diagram shows a sketch of y = sin x for values of x from 0° to 360°. y 1 x 0 90° 180° 270° 360° –1 Given that sin 38° = 0·6157, correct to 4 decim
- November 2021, Unit 2 Higher, Q15 (3 marks): The following diagram shows a sketch of the curve y = f (x). y 3 x 0 – 8 In each of the following questions, the graph of y = f (x) has been transformed. (a) y
- November 2020, Unit 1 Intermediate, Q14 (6 marks): The table below shows some of the values of y = x2 − 4x − 3 for values of x from –2 to 5. x −2 –1 0 1 2 3 4 5 y = x2 − 4x − 3 2 −3 −6 −6 −3 2 (a) Complete the t
- November 2020, Unit 1 Higher, Q3 (6 marks): The table below shows some of the values of y = x2 − 4x − 3 for values of x from –2 to 5. 3. x −2 –1 0 1 2 3 4 5 y = x2 − 4x − 3 2 −3 −6 −6 −3 2 (a) Complete th
- November 2020, Unit 1 Higher, Q17 (2 marks): (a) The following diagram shows a sketch of the curve y = f (x). y x 0 – 8 8 – 5 The curve is transformed, as shown below. y x 0 – 8 8 Using function notation,
- November 2020, Unit 2 Higher, Q17 (4 marks): Sketch the curve y = cos x, for values of x in the range x = 0° to x = 360°. 17. (a) You must indicate any important values on the axes. [2] y x 0 Solve the equ
- November 2019, Unit 2 Intermediate, Q12 (6 marks): The table below shows some of the values of y = x2 − 2x − 4 for values of x from –3 to 4. x −3 −2 −1 0 1 2 3 4 y = x2 − 2x − 4 11 4 −1 −4 −4 –1 4 (a) Complete t
- November 2019, Unit 2 Higher, Q3 (6 marks): The table below shows some of the values of y = x2 − 2x − 4 for values of x from –3 to 4. x −3 −2 −1 0 1 2 3 4 y = x2 − 2x − 4 11 4 −1 −4 −4 –1 4 (a) Complete t
- November 2019, Unit 2 Higher, Q16 (3 marks): The following graph represents the curve y = f (x). y 2 1 x 0 1 2 3 4 –1 – 2 There are 9 equations and 4 graphs of different transformations of y = f (x) shown
- June 2019, Unit 1 Intermediate, Q11 (4 marks): Complete the table below. Draw the graph of y = 3x2 – 25 for values of x between −3 and 4. Use the graph paper below. You must choose a suitable scale for the y
- June 2019, Unit 1 Higher, Q2 (4 marks): Complete the table below. Draw the graph of y = 3x2 – 25 for values of x between −3 and 4. Use the graph paper below. You must choose a suitable scale for the y
- June 2019, Unit 1 Higher, Q17 (2 marks): The following diagram shows a sketch of the curve y = f (x). 17. (a) y 4 2 x –2 –1 0 1 2 –2 – 4 The curve is transformed, as shown below. y 4 2 x –2 –1 0 1 2 –2
- June 2019, Unit 2 Higher, Q15 (2 marks): Four quadratic graphs are sketched below. Draw a line connecting each graph to its equation. One has been completed for you. [2] Equation Graph y y = (x + 1)(x
- June 2019, Unit 2 Higher, Q16 (4 marks): (a) Sketch the curve y = sin x on the axes below. You must indicate any important values on the y-axis. [2] y x –180° –90° 0 90° 180° Solve the equation sin x =
- November 2018, Unit 2 Intermediate, Q12 (6 marks): The table below shows some of the values of y = x2 + 4x − 1 for values of x from –5 to 2. x –5 – 4 –3 –2 –1 0 1 2 y = x2 + 4x − 1 4 –1 – 4 – 4 –1 4 (a) Complete
- November 2018, Unit 1 Higher, Q18 (2 marks): The graph shows a sketch of the curve with equation y = x2 + 2. The lowest point of the curve has coordinates (0, 2). y (0, 2) x O On the same axes, sketch the
- November 2018, Unit 2 Higher, Q3 (6 marks): The table below shows some of the values of y = x2 + 4x − 1 for values of x from –5 to 2. 3. x –5 – 4 –3 –2 –1 0 1 2 y = x2 + 4x − 1 4 –1 – 4 – 4 –1 4 (a) Compl
- November 2018, Unit 2 Higher, Q11 (2 marks): Sketch the curve y = tan x, for values of x in the range x = – 180° to x = 180°. [2] y x 0 – 180° – 90° 90° 180°
- November 2018, Unit 2 Higher, Q16 (3 marks): The graph of y = 18 + 3x – x2, for values of x from x = 0 to x = 6, is drawn below. y 24 22 20 18 16 14 12 10 8 6 4 2 0 x 0 1 2 3 4 5 6 Use the trapezium rule,
- June 2018, Unit 1 Higher, Q16 (5 marks): Draw the graph of the curve y = 2x for values of x from –2 to 2. 16. (a) Use the graph paper below. [3] y x O Use your graph to find the value of 21.4. [1] (b)
- June 2018, Unit 1 Higher, Q18 (6 marks): y = cos x 18. The following diagram shows a sketch of for values of x from 0° to 360°. y 1 0 x 180° 270° 360° 90° – 1 Given that cos 21° = 0.9336, correct to 4
- November 2017, Unit 1 Intermediate, Q9 (5 marks): (a) Complete the table below. Draw the graph of y = 2x2 – 5 for values of x between –2 and 3. Use the graph paper below. Choose a suitable scale for the y-axis.
- November 2017, Unit 1 Higher, Q2 (5 marks): (a) Complete the table below. Draw the graph of y = 2x2 – 5 for values of x between –2 and 3. Use the graph paper below. Choose a suitable scale for the y-axis.
- November 2017, Unit 1 Higher, Q18 (1 mark): The following diagram shows a sketch of the curve y = f (x). y 2 x 0 – 4 4 – 2 The curve is transformed, as shown below. y 2 x 0 – 4 4 – 2 Using function notati
- November 2017, Unit 2 Higher, Q14 (4 marks): (a) Sketch the curve y = sin x, for values of x in the range x = 0° to x = 360°. [1] y 1 x 0 90 180 270 360 – 1 (b) Solve each of the following equations. Give
- November 2017, Unit 2 Higher, Q16 (2 marks): Each of the two graphs below is described by one of the equations on the right. Put a tick in the box next to the equation which correctly describes each graph.
- June 2017, Unit 2 Foundation, Q15 (2 marks): The diagram below shows a number machine. ADD MULTIPLY INPUT OUTPUT 7 BY 3 Using the number machine, calculate: (a) the OUTPUT when the INPUT is −2, [1] (b) the
- June 2017, Unit 1 Intermediate, Q11 (5 marks): The table below shows some of the values of y = x2 – 5x + 2, for values of x from –1 to 5. x –1 0 1 2 3 4 5 y = x2 – 5x + 2 8 2 –2 – 4 –2 2 (a) Complete the tab
- June 2017, Unit 2 Intermediate, Q4 (3 marks): The diagram below shows a number machine. ADD MULTIPLY INPUT OUTPUT 7 BY 3 Using the number machine, calculate: (a) the INPUT when the OUTPUT is 36, [1] (b) the
- June 2017, Unit 1 Higher, Q2 (5 marks): The table below shows some of the values of y = x2 – 5x + 2, for values of x from –1 to 5. x –1 0 1 2 3 4 5 y = x2 – 5x + 2 8 2 –2 – 4 –2 2 (a) Complete the tab
- June 2017, Unit 1 Higher, Q15 (3 marks): (a) Using the axes below, sketch the graph of y = sin x for values of x from 0° to 360°. You must label any important values on both axes. [2] y x 0 (b) Circle
- June 2017, Unit 2 Higher, Q20 (4 marks): A sketch of the graph y = f (x) is shown below. Two specific points are shown on the graph. They are called a maximum point and a minimum point. The maximum poi
- November 2016, Unit 1 Intermediate, Q11 (7 marks): (a) The table below shows some of the values of y = 2x2 – 5x – 1 for values of x from –2 to 4. Complete the table by finding the value of y for x = −1 and for x
- November 2016, Unit 1 Higher, Q2 (7 marks): (a) The table below shows some of the values of y = 2x2 – 5x – 1 for values of x from –2 to 4. Complete the table by finding the value of y for x = −1 and for x
- November 2016, Unit 1 Higher, Q15 (5 marks): (a) The diagram shows a sketch of the graph y = f (x). The graph passes through the points (–1, 0) and (5, 0) and its highest point is at (2, 7). y (2, 7) x O (
- November 2016, Unit 2 Higher, Q15 (2 marks): Circle either TRUE or FALSE for each statement given below. [2] GRAPH STATEMENT y The equation of this graph could be TRUE FALSE x y = – x3 – 2. O y The equatio
Questions, mark schemes and examiner’s reports are © WJEC CBAC Ltd, from their published past papers. Plumi isn’t affiliated with any exam board. Want whole papers? WJEC GCSE Maths past papers.
The Plumi iPad app also offers exam-style questions with AI feedback on your handwritten working.