 plumi
Charts, frequency tables and diagrams: WJEC GCSE Maths questions
WJEC GCSE Maths past-paper questions on S1 Charts, frequency tables and diagrams, November 2016 to June 2025, with mark schemes and examiner’s reports where available.
Past paper difficulty
Paper
All papers
Exam
All years
Calculator
Loading the full question list…
All 44 questions on Charts, frequency tables and diagrams, as a list
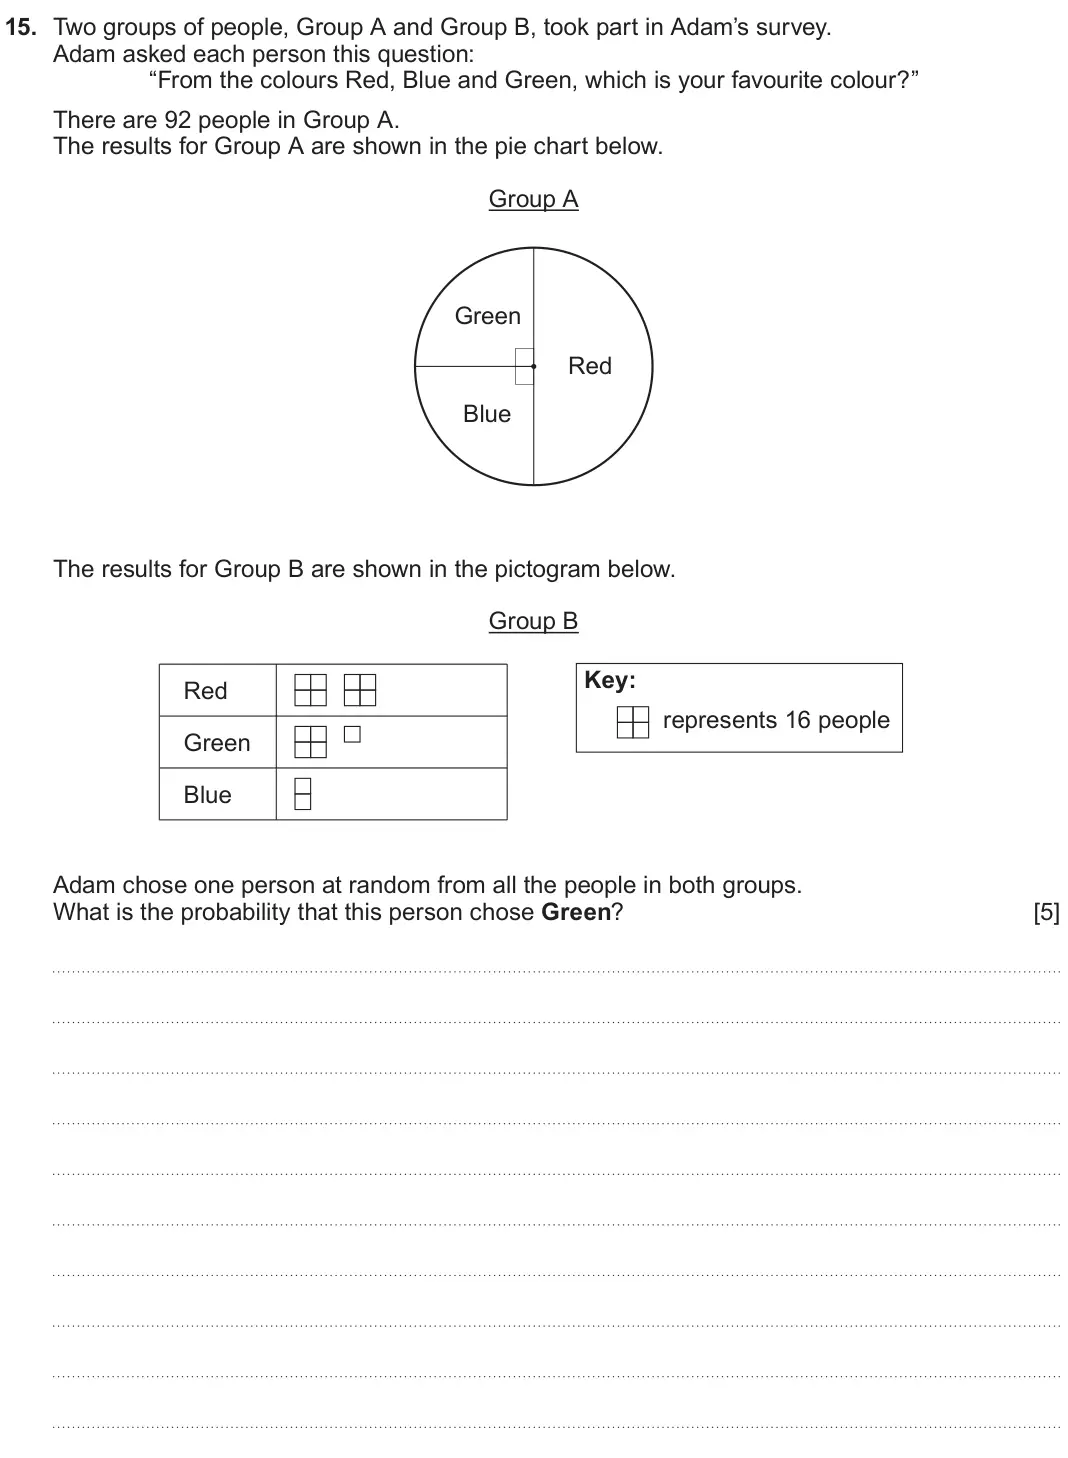
- June 2025, Unit 2 Foundation, Q15 (5 marks): Two groups of people, Group A and Group B, took part in Adam’s survey. Adam asked each person this question: “From the colours Red, Blue and Green, which is you
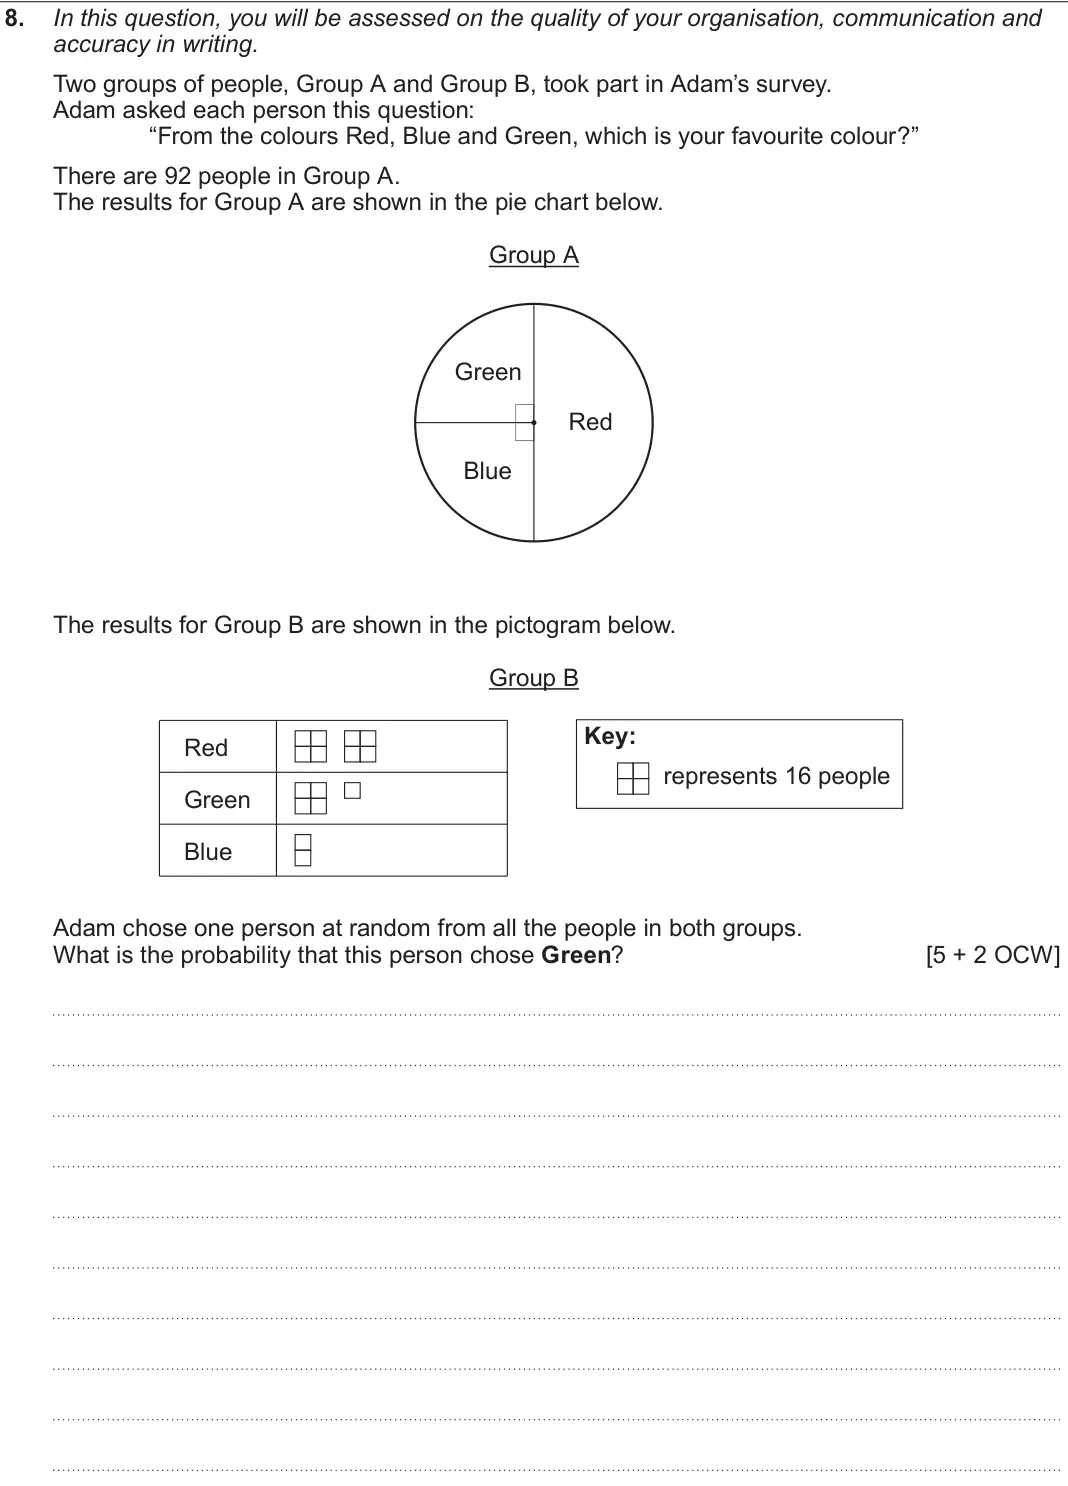
- June 2025, Unit 2 Intermediate, Q8 (7 marks): In this question, you will be assessed on the quality of your organisation, communication and accuracy in writing. Two groups of people, Group A and Group B, to
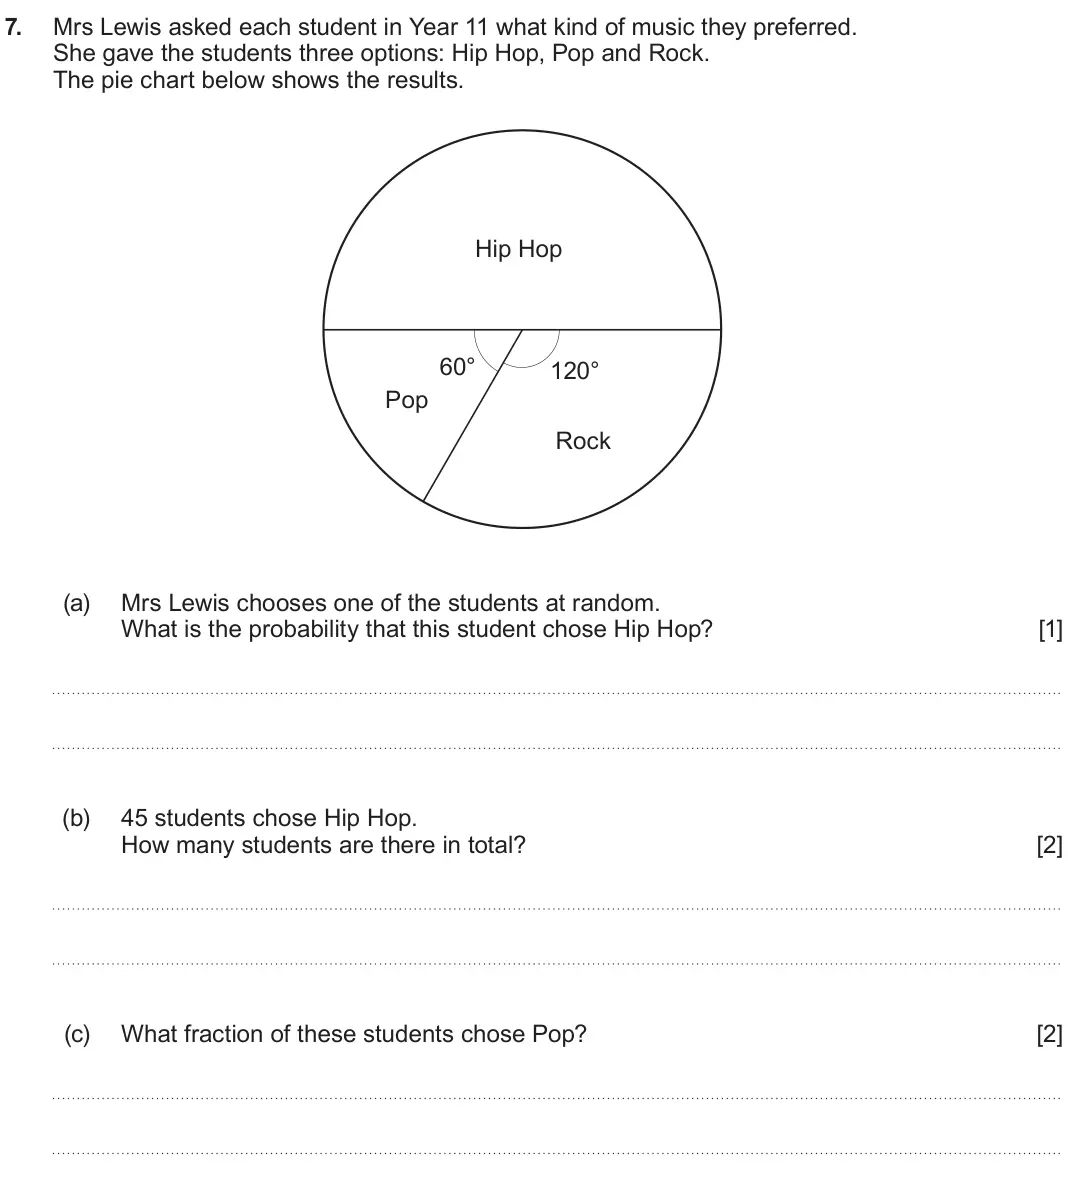
- November 2024, Unit 1 Foundation, Q7 (5 marks): Mrs Lewis asked each student in Year 11 what kind of music they preferred. She gave the students three options: Hip Hop, Pop and Rock. The pie chart below shows
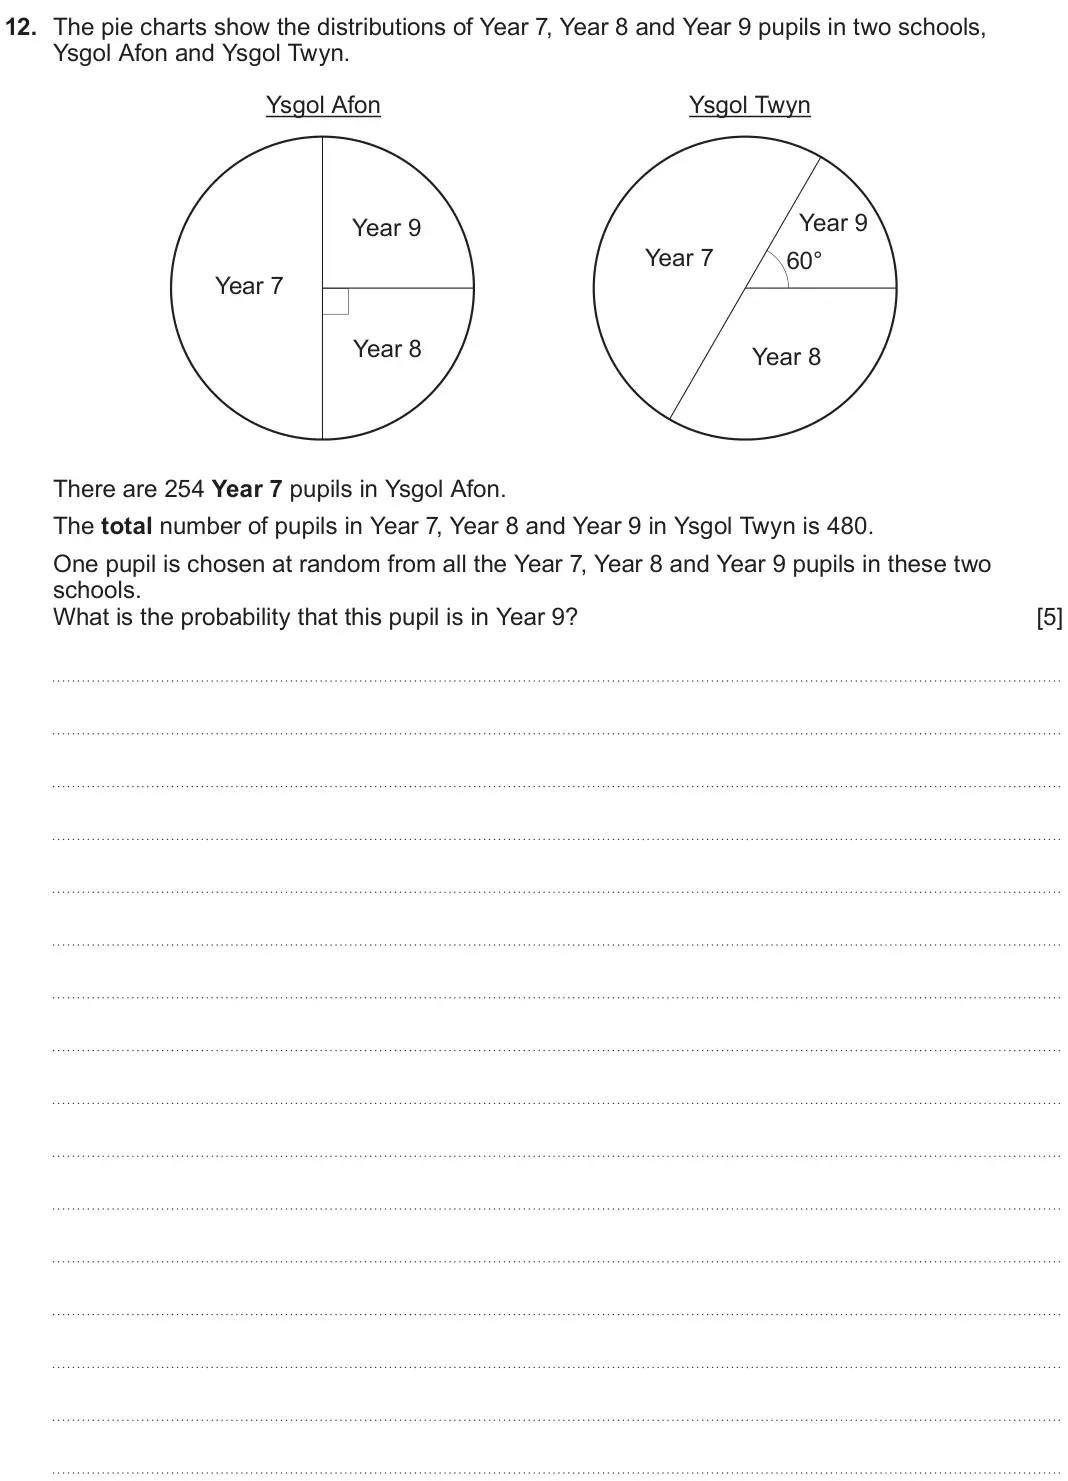
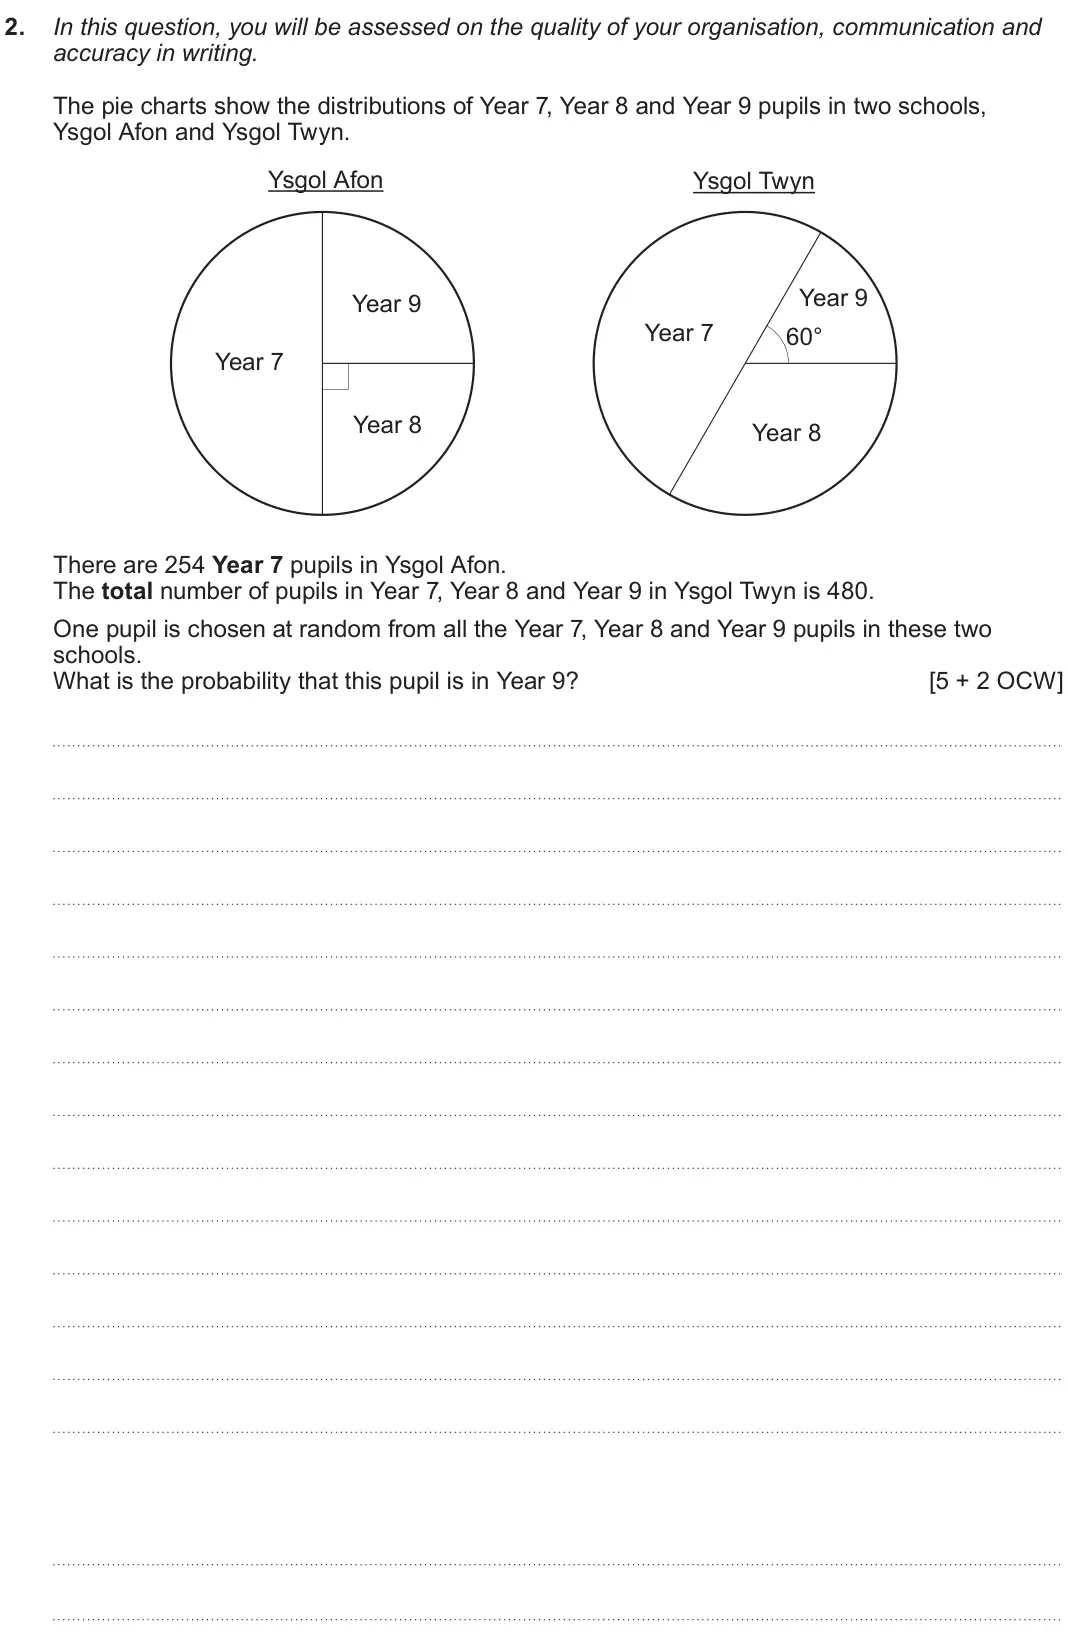
- November 2024, Unit 1 Intermediate, Q12 (5 marks): The pie charts show the distributions of Year 7, Year 8 and Year 9 pupils in two schools, Ysgol Afon and Ysgol Twyn. Ysgol Afon Ysgol Twyn Year 9 Year 9 Year 7
- November 2024, Unit 1 Higher, Q2 (7 marks): In this question, you will be assessed on the quality of your organisation, communication and accuracy in writing. The pie charts show the distributions of Year
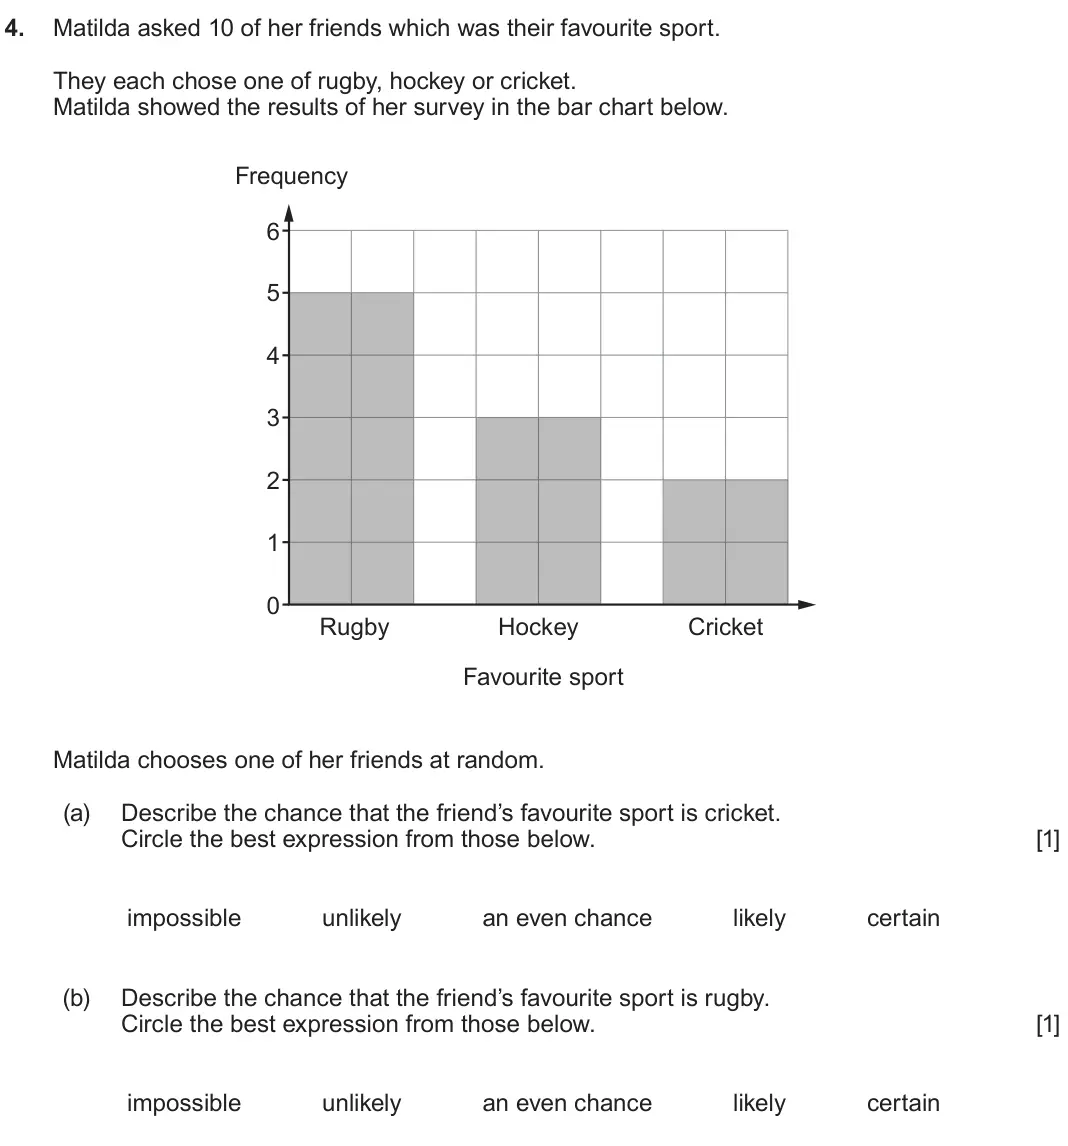
- June 2024, Unit 1 Foundation, Q4 (2 marks): Matilda asked 10 of her friends which was their favourite sport. They each chose one of rugby, hockey or cricket. Matilda showed the results of her survey in th
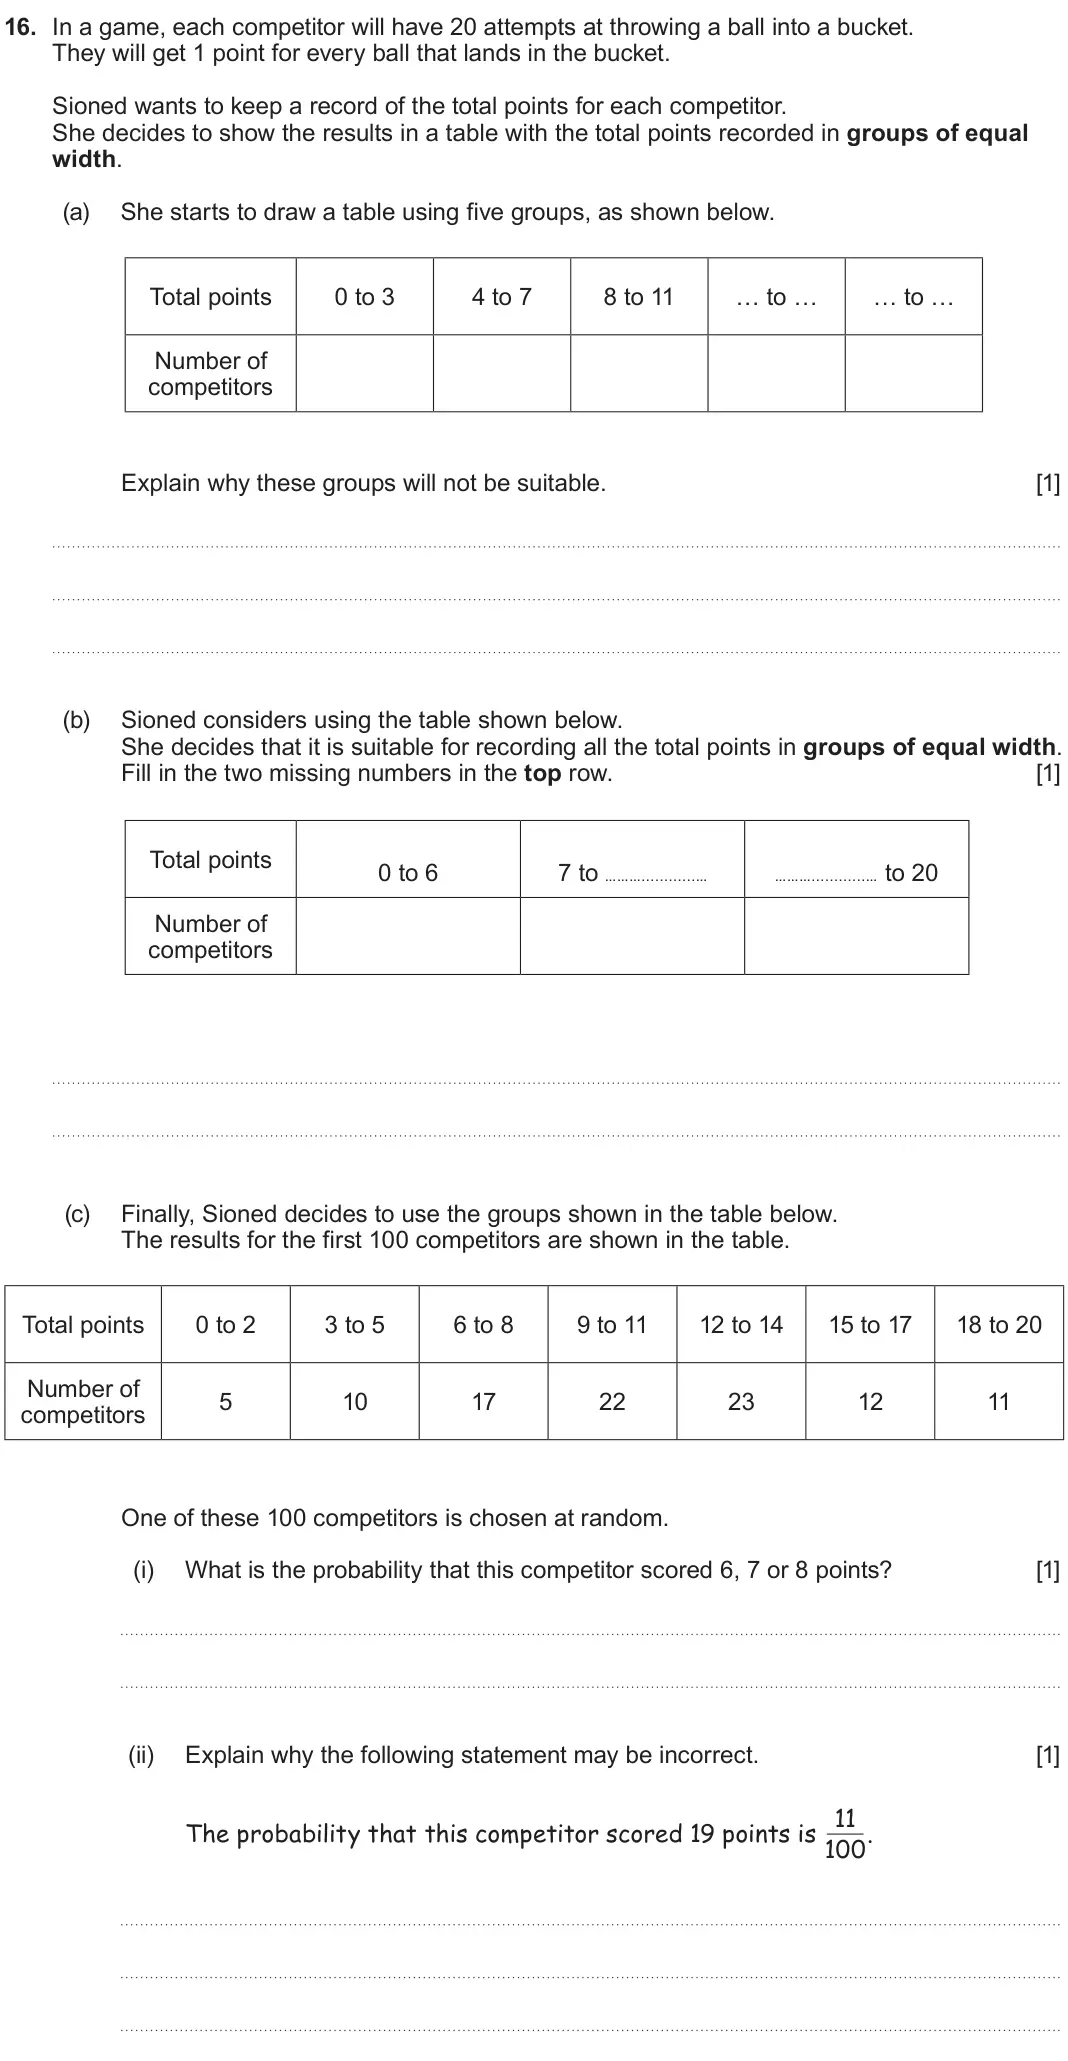
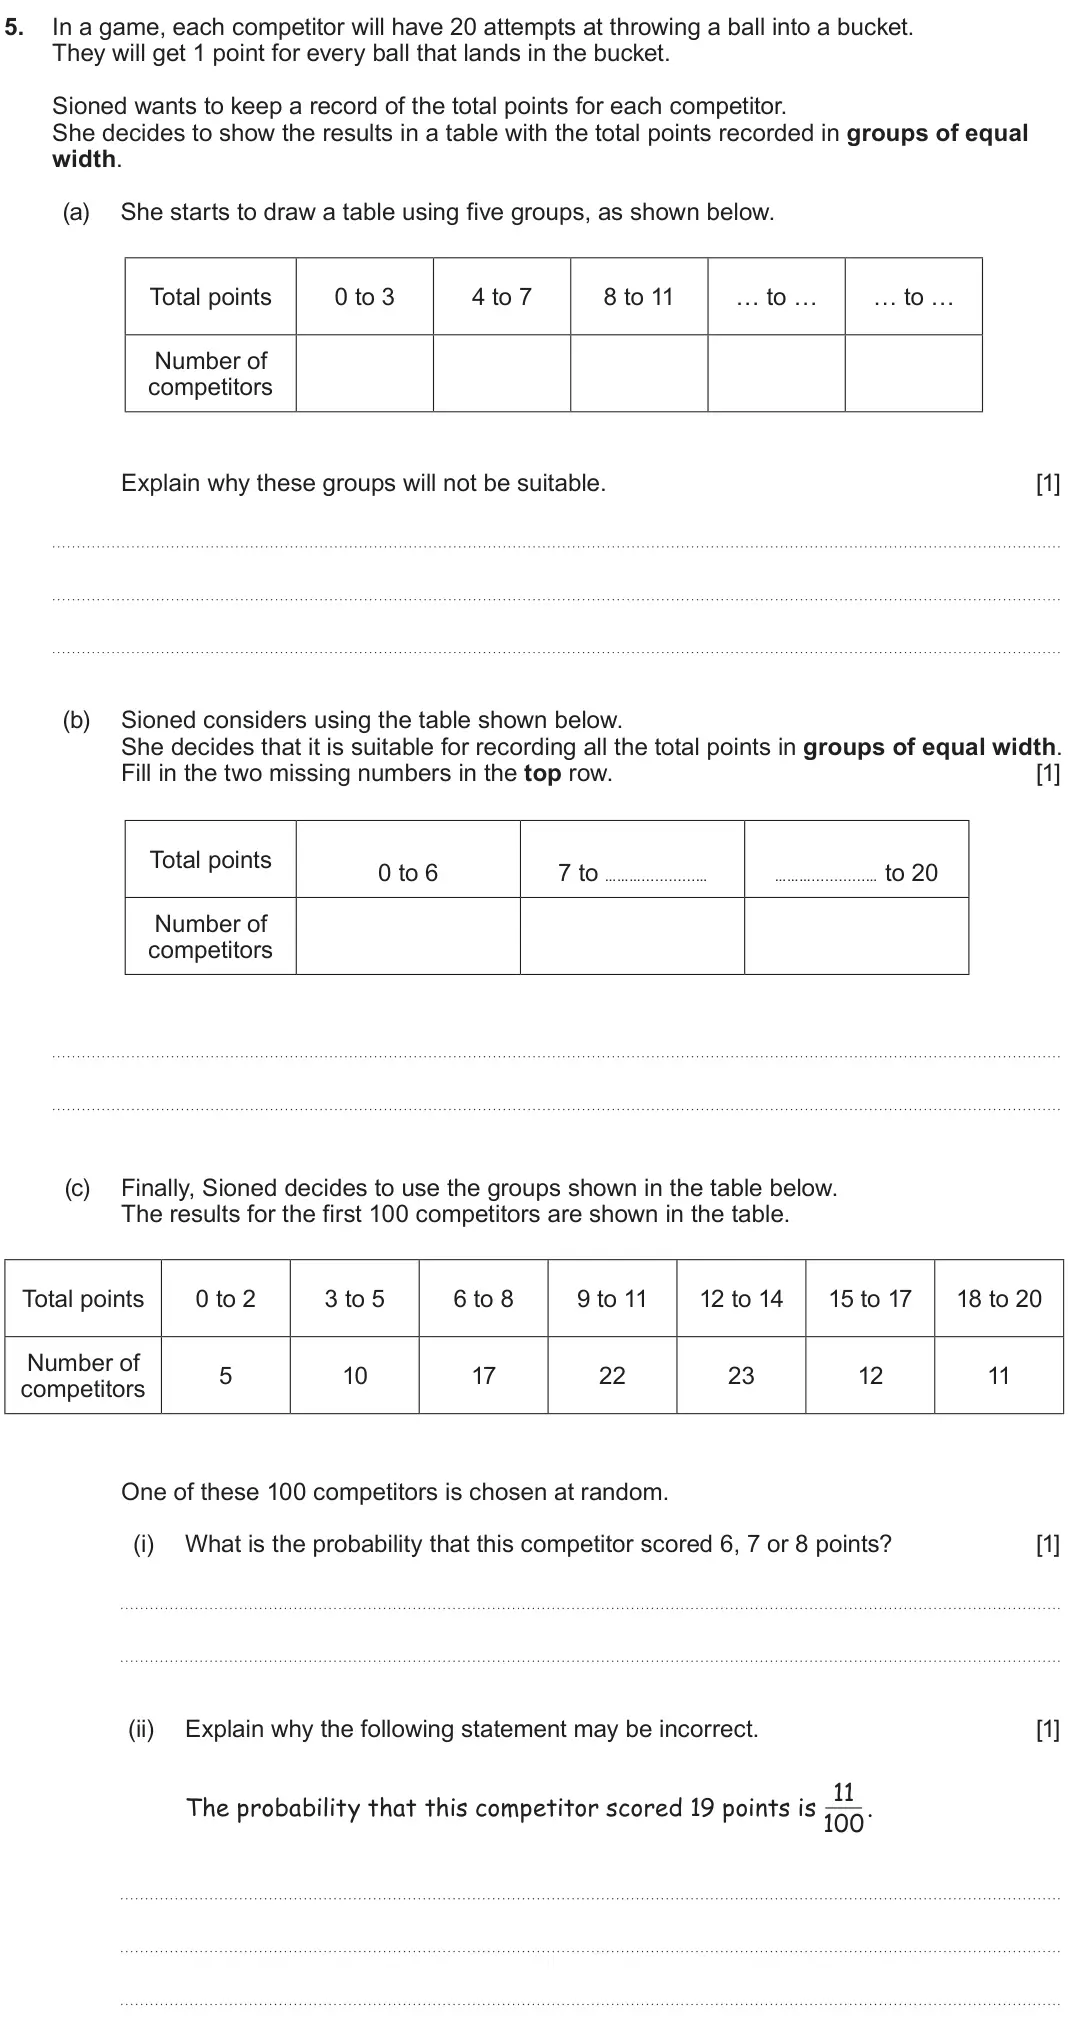
- June 2024, Unit 1 Foundation, Q16 (4 marks): In a game, each competitor will have 20 attempts at throwing a ball into a bucket. They will get 1 point for every ball that lands in the bucket. Sioned wants t
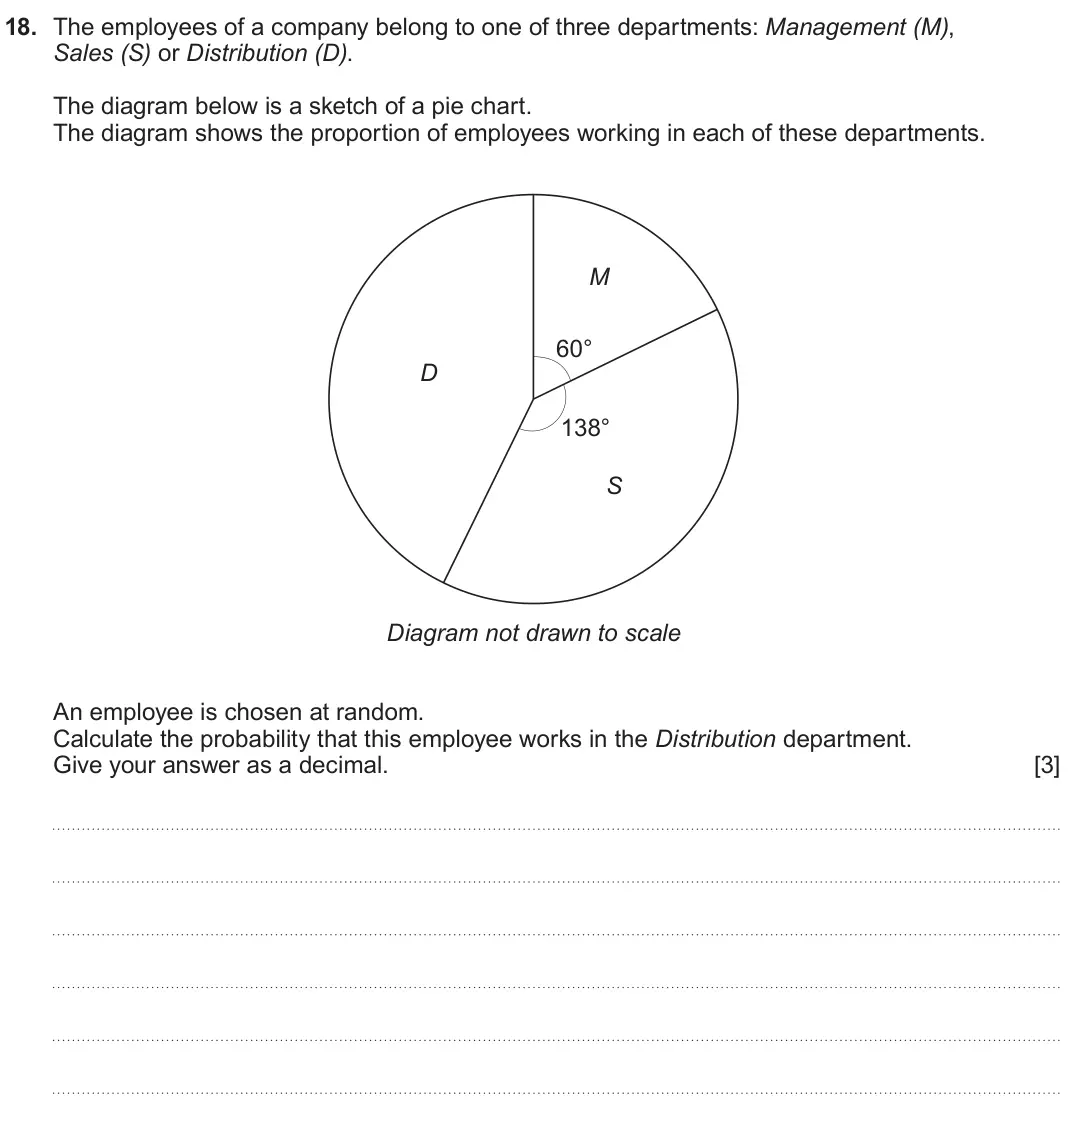
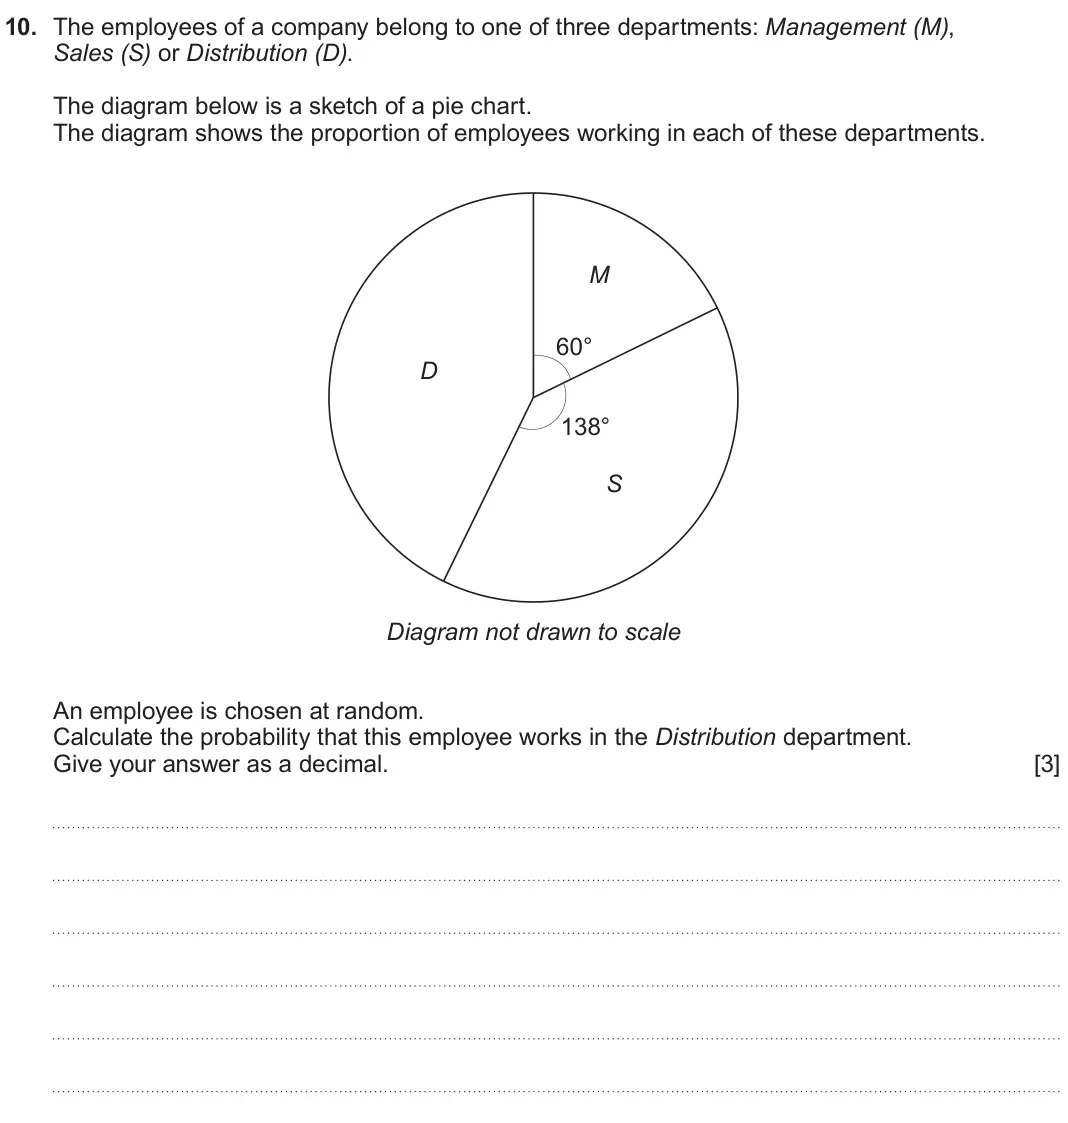
- June 2024, Unit 2 Foundation, Q18 (3 marks): The employees of a company belong to one of three departments: Management (M), Sales (S) or Distribution (D). The diagram below is a sketch of a pie chart. The
- June 2024, Unit 1 Intermediate, Q5 (4 marks): In a game, each competitor will have 20 attempts at throwing a ball into a bucket. They will get 1 point for every ball that lands in the bucket. Sioned wants t
- June 2024, Unit 2 Intermediate, Q10 (3 marks): The employees of a company belong to one of three departments: Management (M), Sales (S) or Distribution (D). The diagram below is a sketch of a pie chart. The
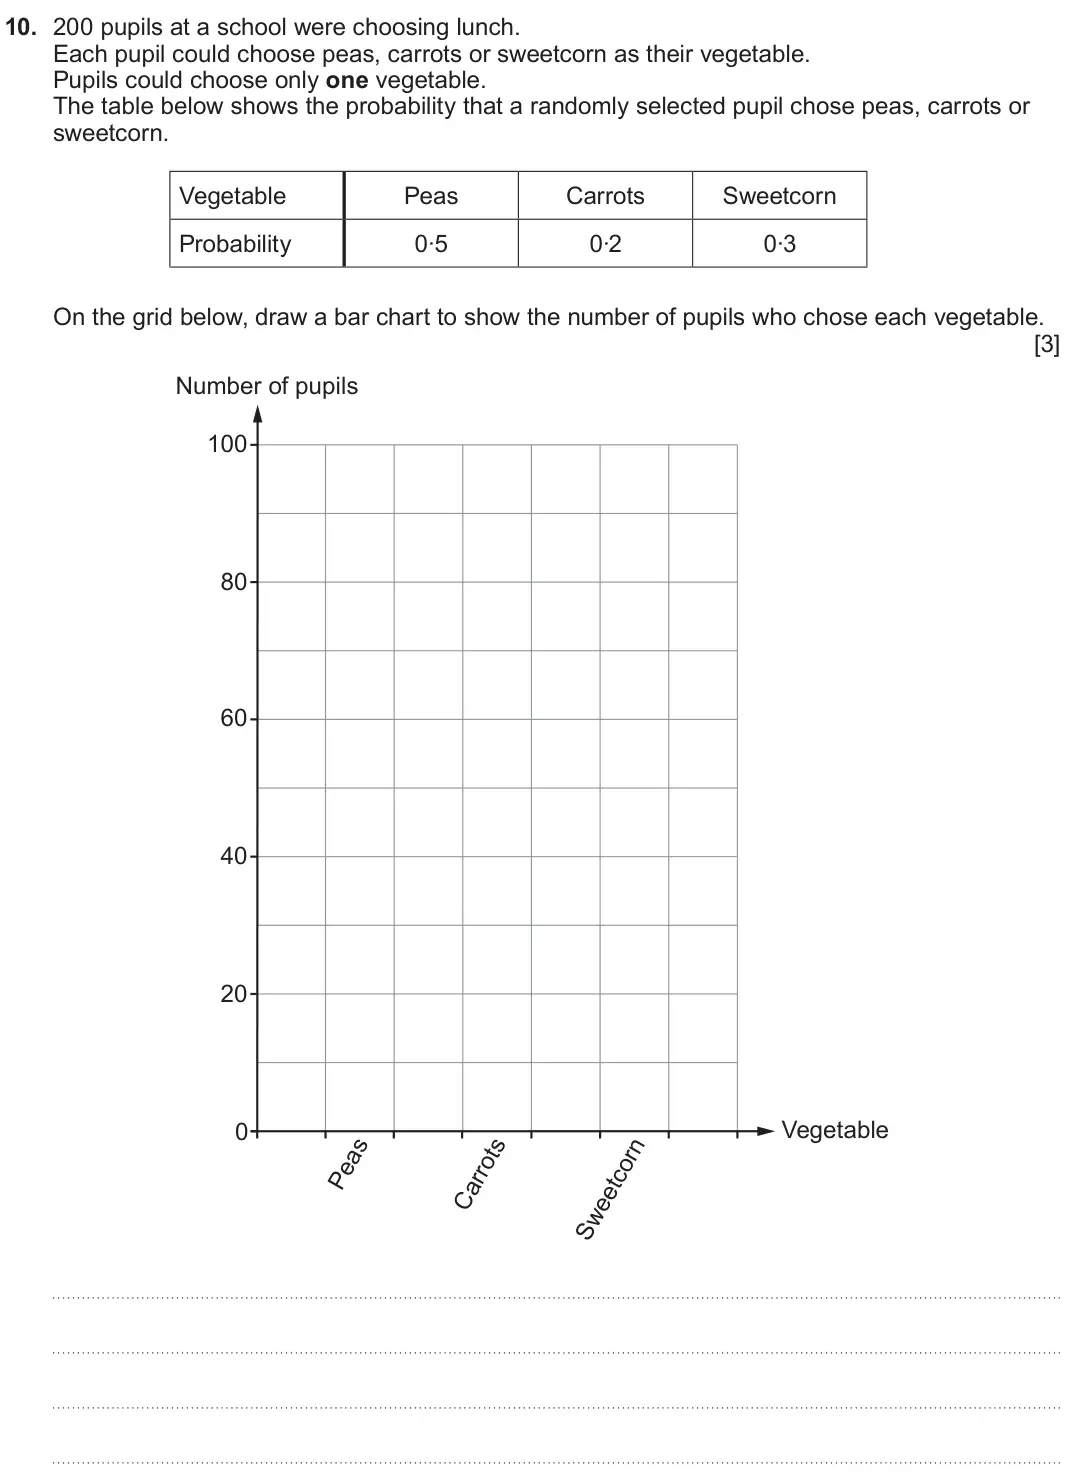
- November 2023, Unit 1 Foundation, Q10 (3 marks): 200 pupils at a school were choosing lunch. Each pupil could choose peas, carrots or sweetcorn as their vegetable. Pupils could choose only one vegetable. The t
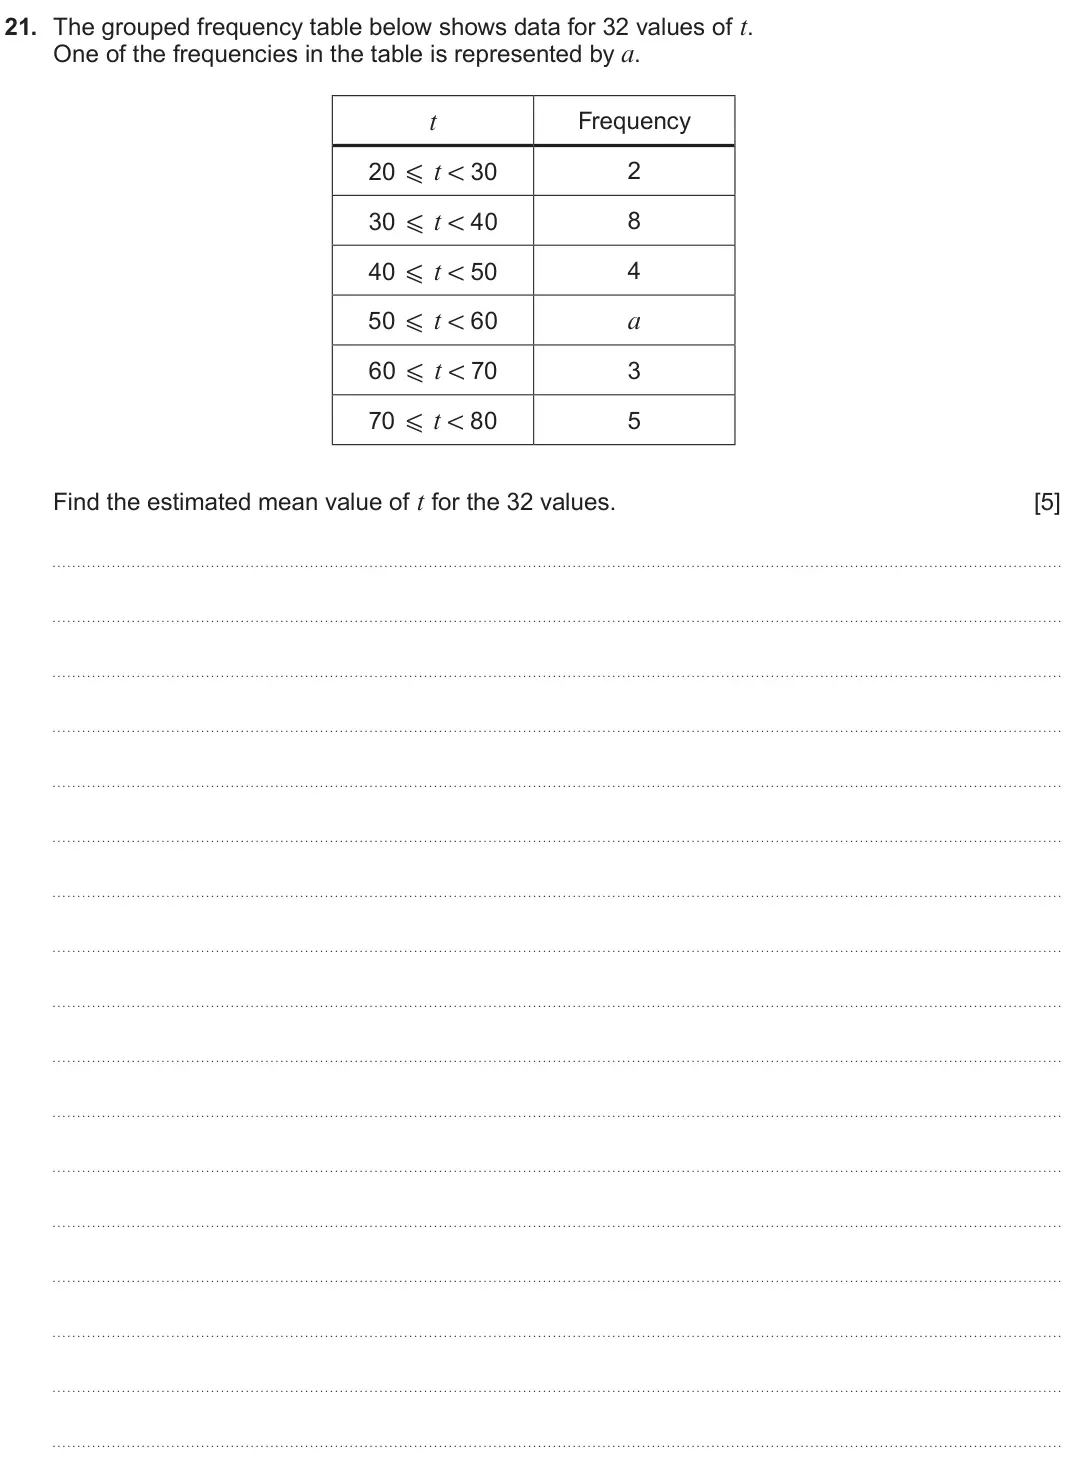
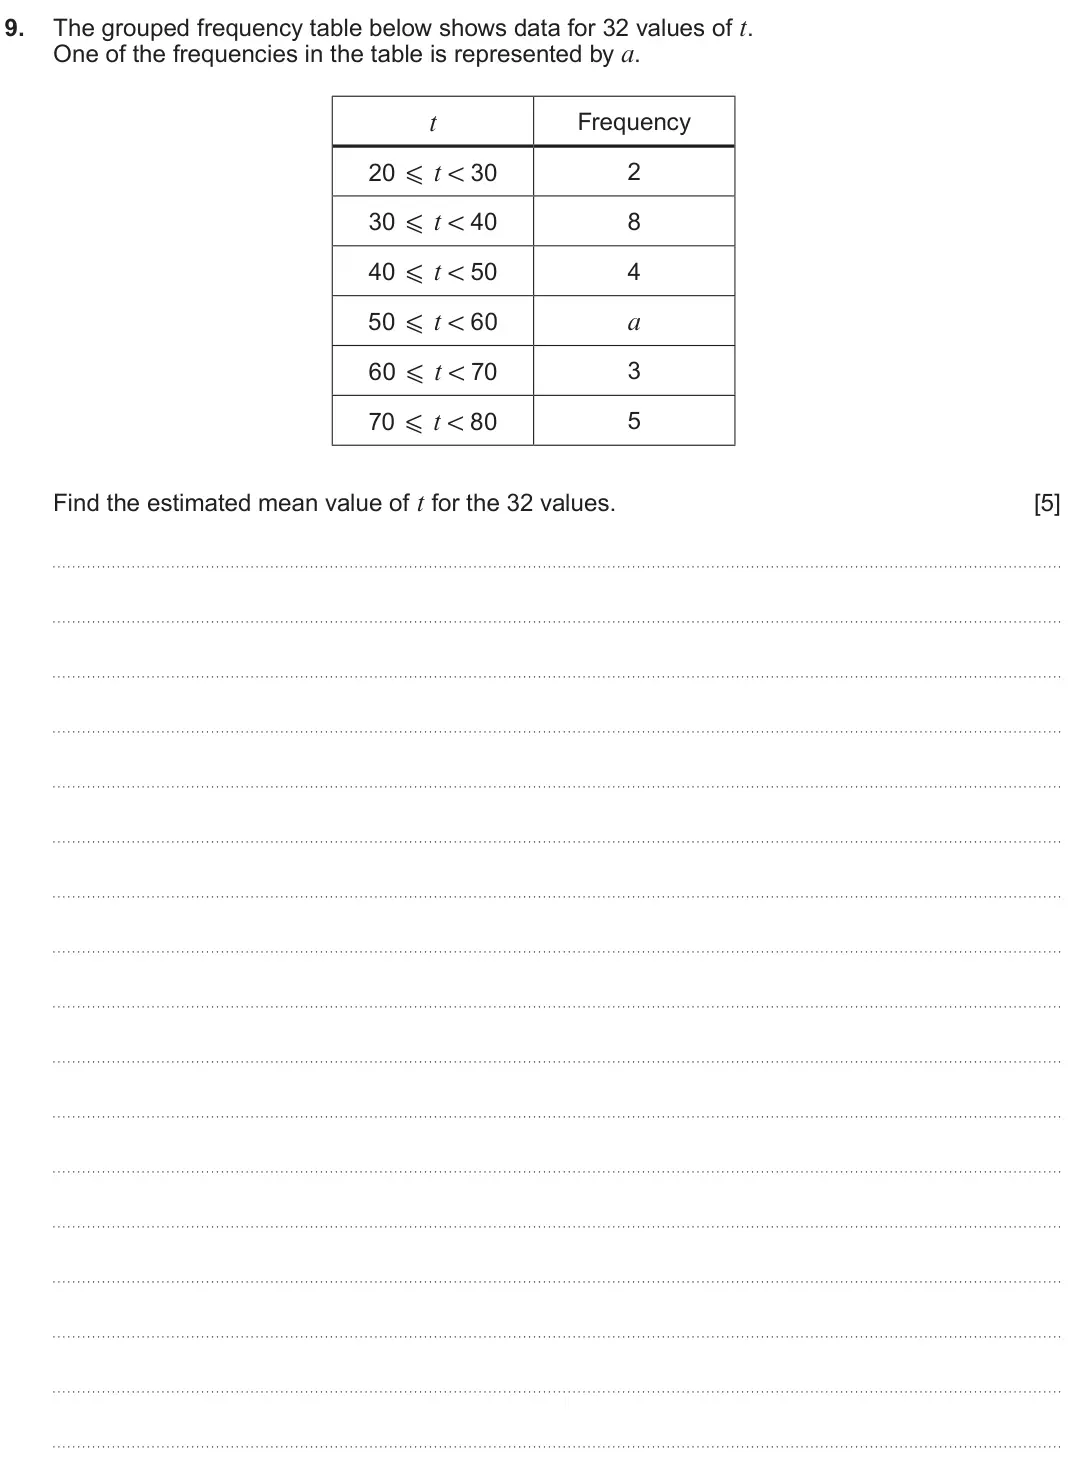
- November 2023, Unit 2 Intermediate, Q21 (5 marks): The grouped frequency table below shows data for 32 values of t. One of the frequencies in the table is represented by a. t Frequency 20 X t ! 30 2 8 30 X t ! 4
- November 2023, Unit 2 Higher, Q9 (5 marks): The grouped frequency table below shows data for 32 values of t. One of the frequencies in the table is represented by a. t Frequency 20 X t ! 30 2 8 30 X t ! 4
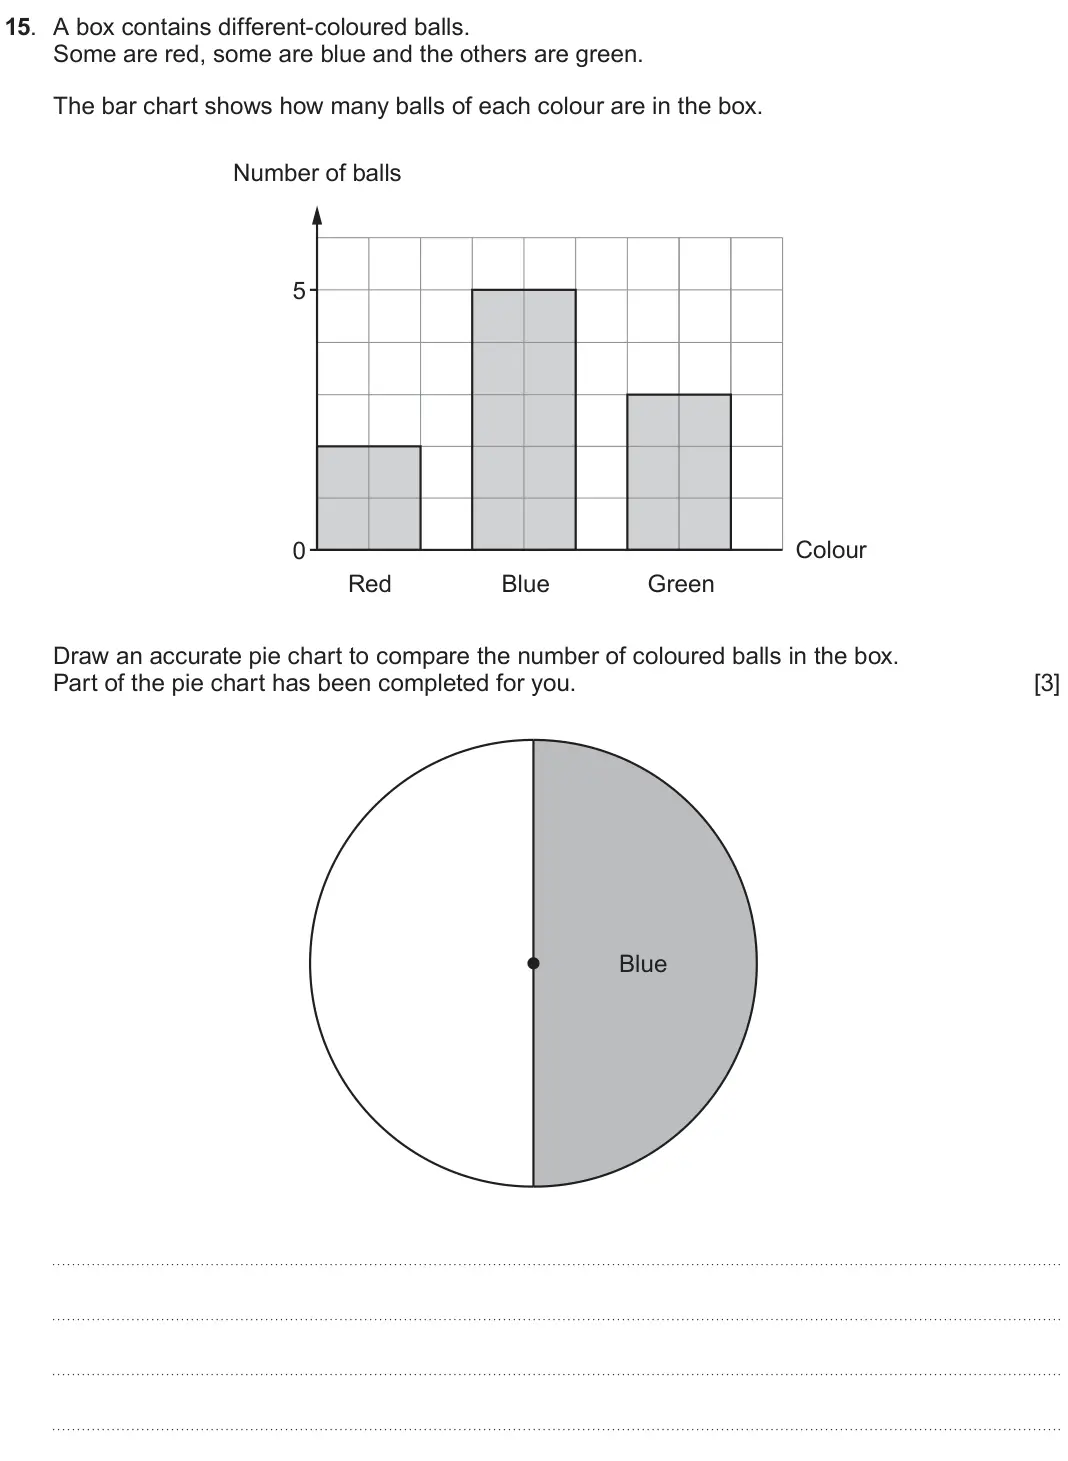
- June 2023, Unit 2 Foundation, Q15 (3 marks): A box contains different-coloured balls. Some are red, some are blue and the others are green. The bar chart shows how many balls of each colour are in the box.
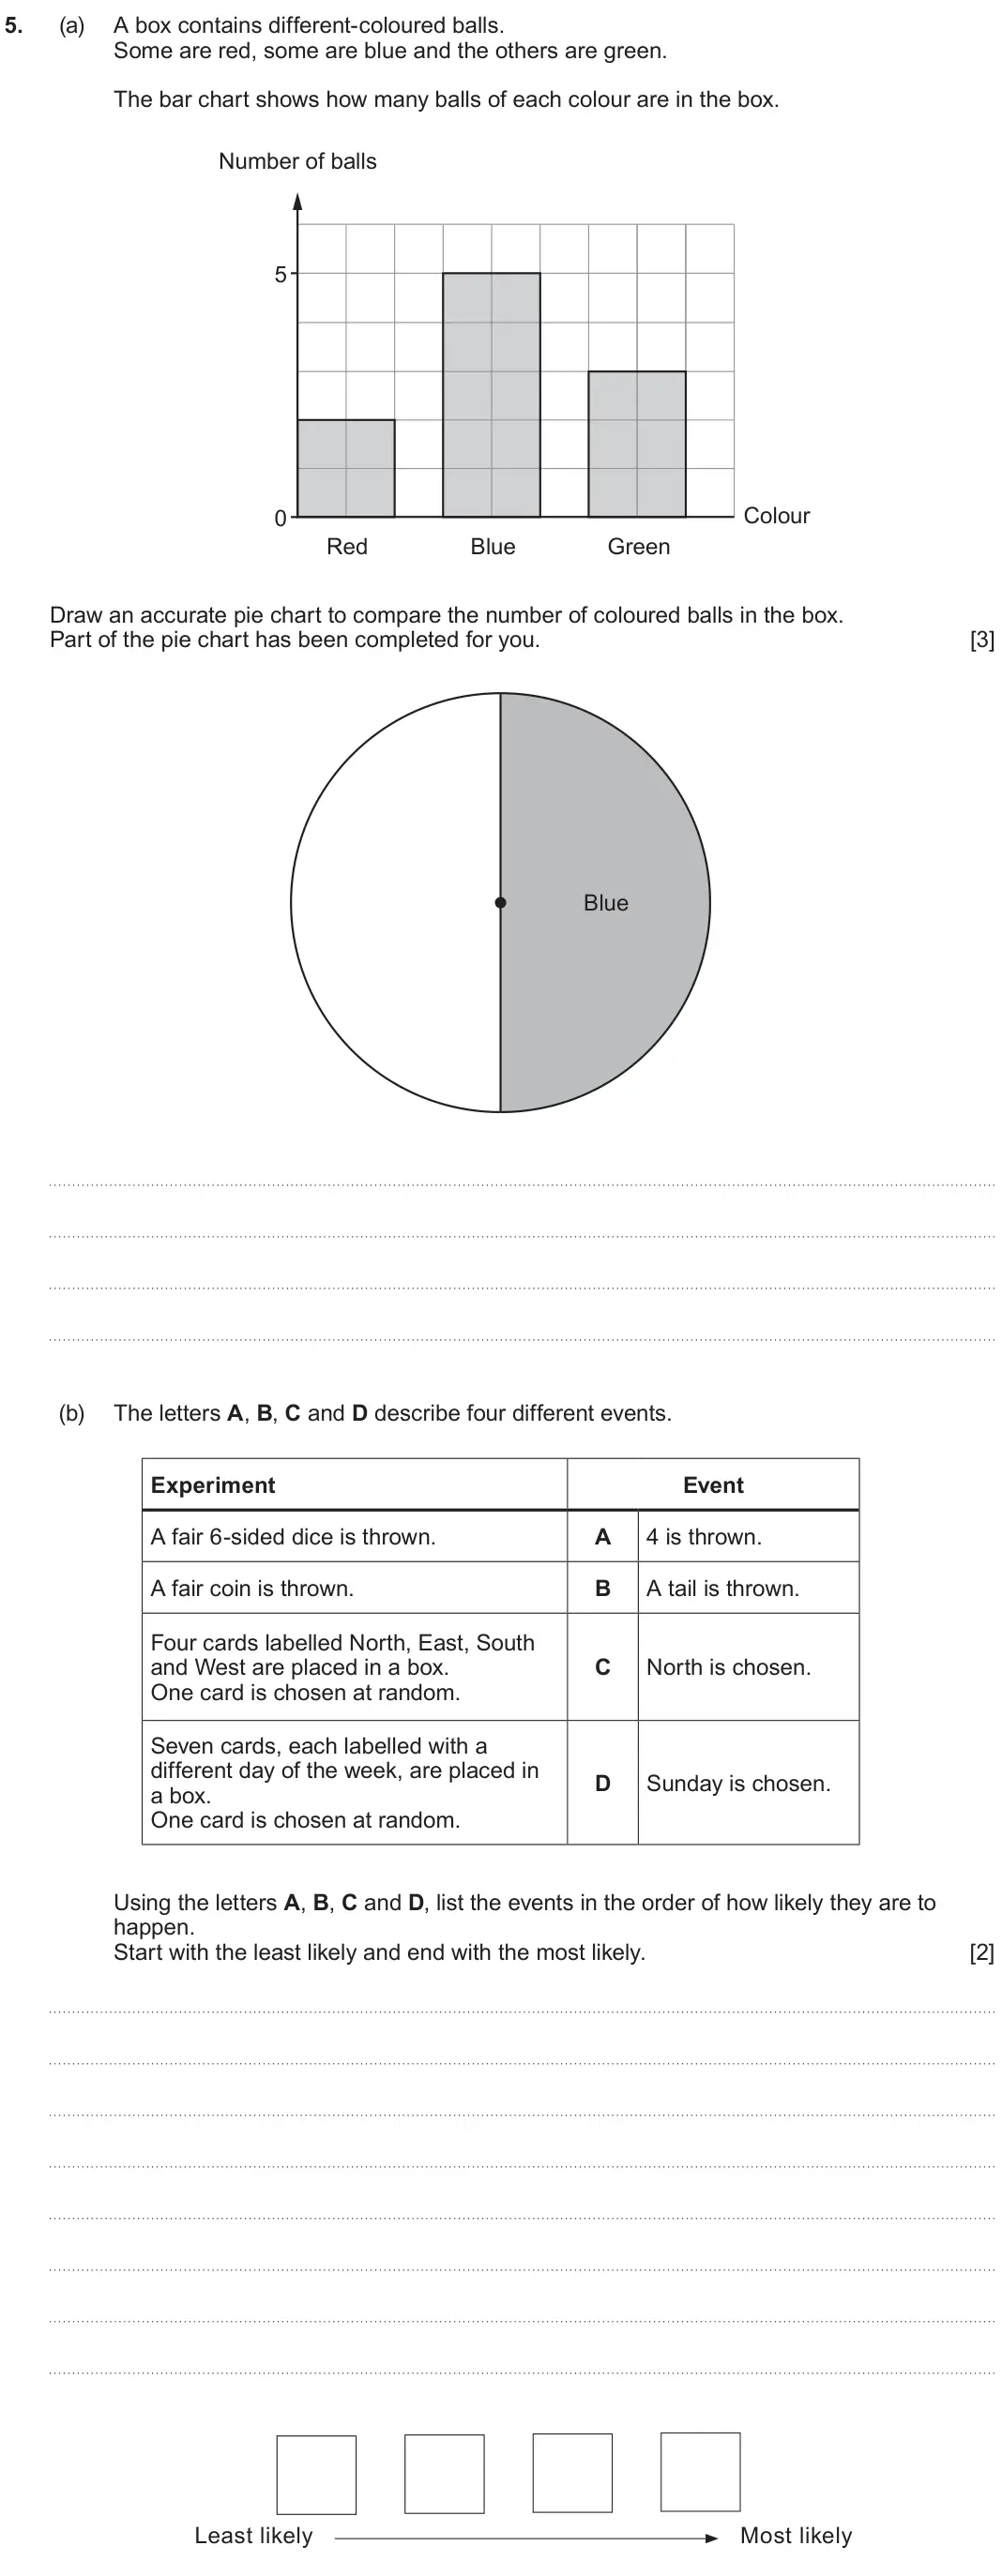
- June 2023, Unit 2 Intermediate, Q5 (5 marks): (a) A box contains different-coloured balls. Some are red, some are blue and the others are green. The bar chart shows how many balls of each colour are in the
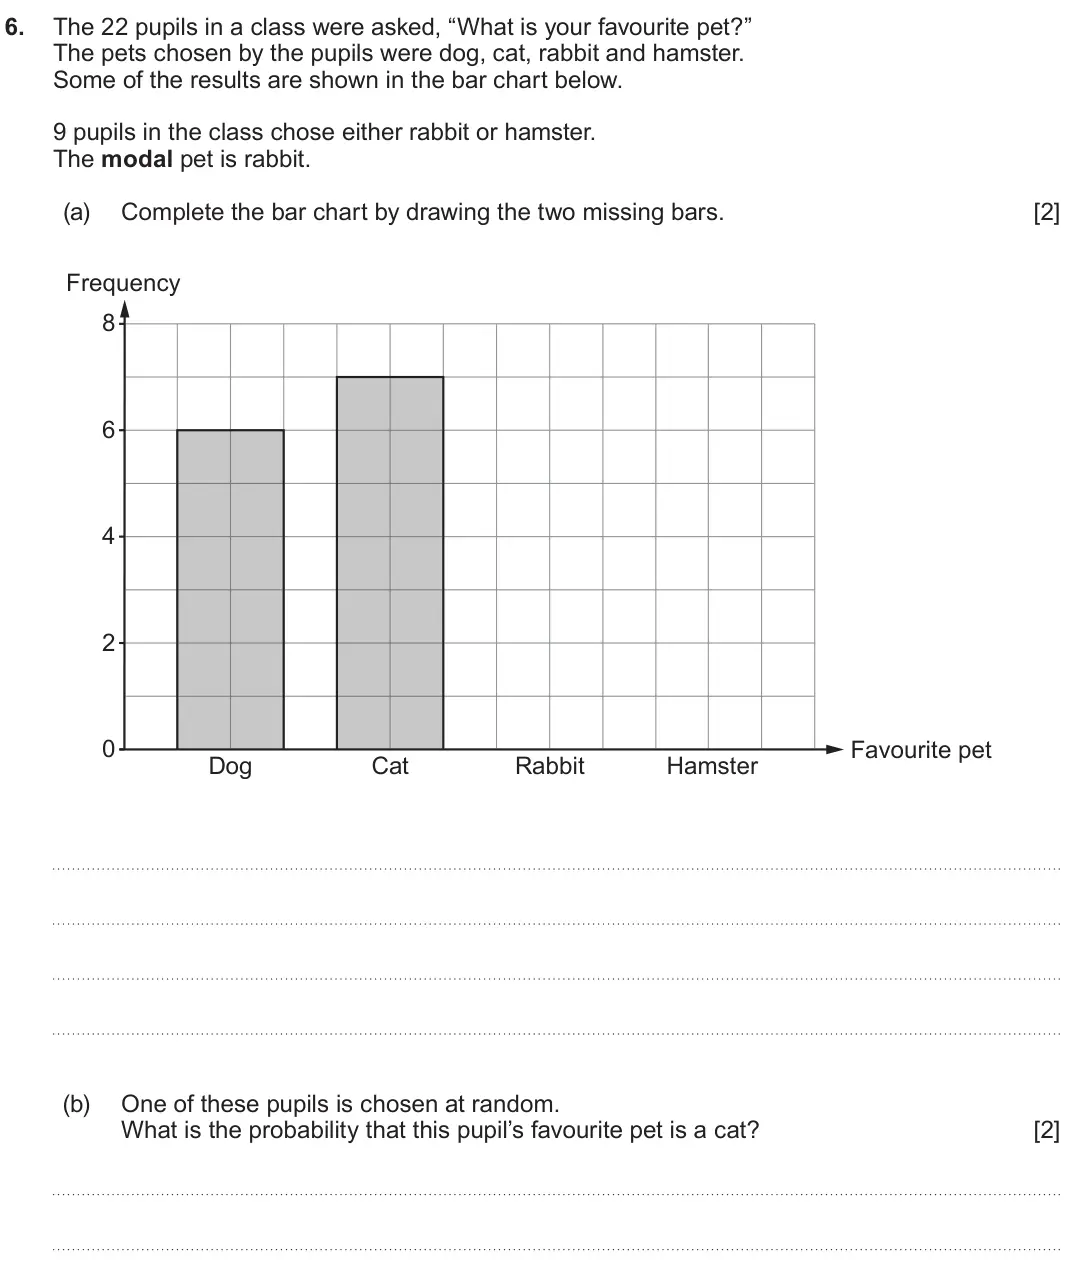
- November 2022, Unit 2 Foundation, Q6 (4 marks): The 22 pupils in a class were asked, “What is your favourite pet?” The pets chosen by the pupils were dog, cat, rabbit and hamster. Some of the results are show
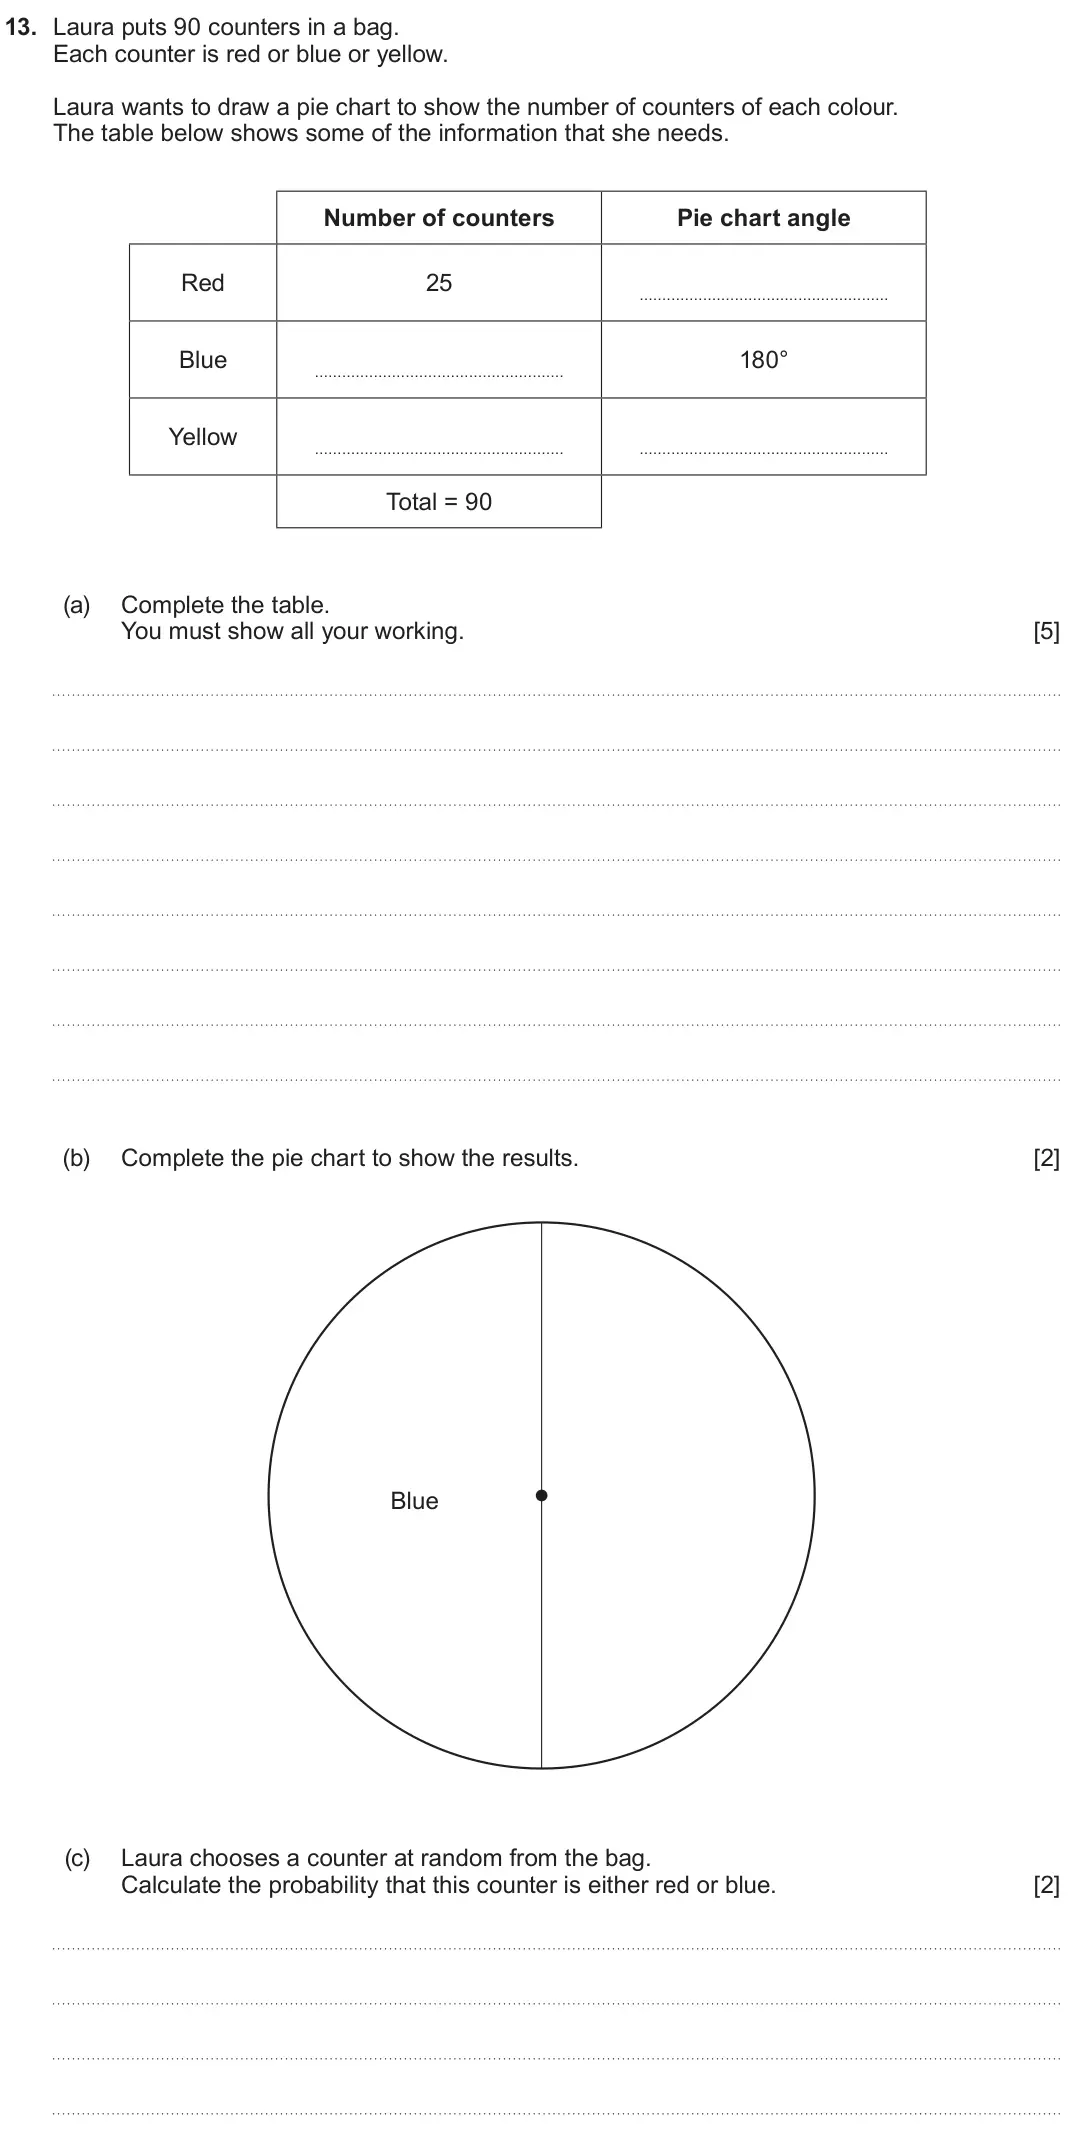
- November 2022, Unit 2 Foundation, Q13 (9 marks): Laura puts 90 counters in a bag. Each counter is red or blue or yellow. Laura wants to draw a pie chart to show the number of counters of each colour. The table
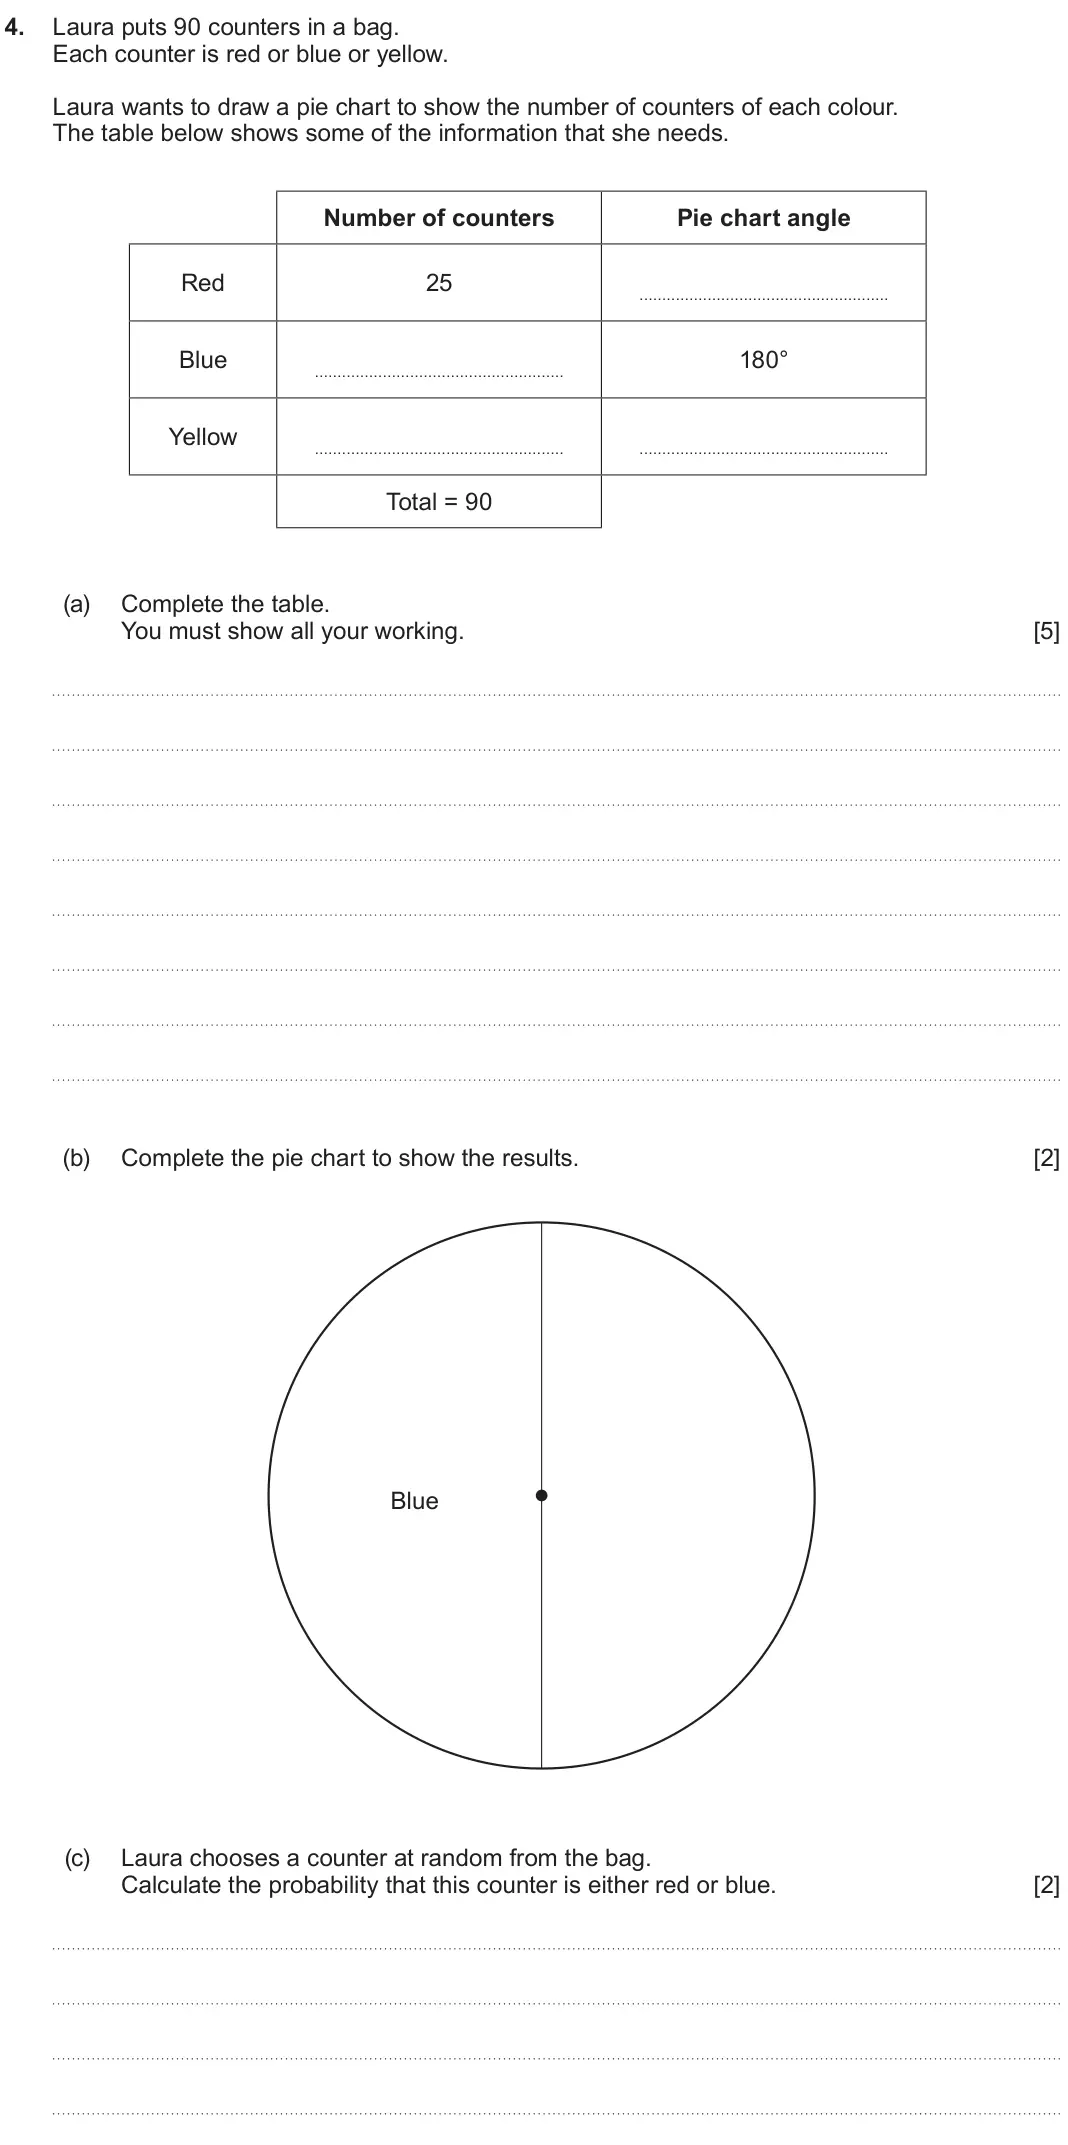
- November 2022, Unit 2 Intermediate, Q4 (9 marks): Laura puts 90 counters in a bag. Each counter is red or blue or yellow. Laura wants to draw a pie chart to show the number of counters of each colour. The table
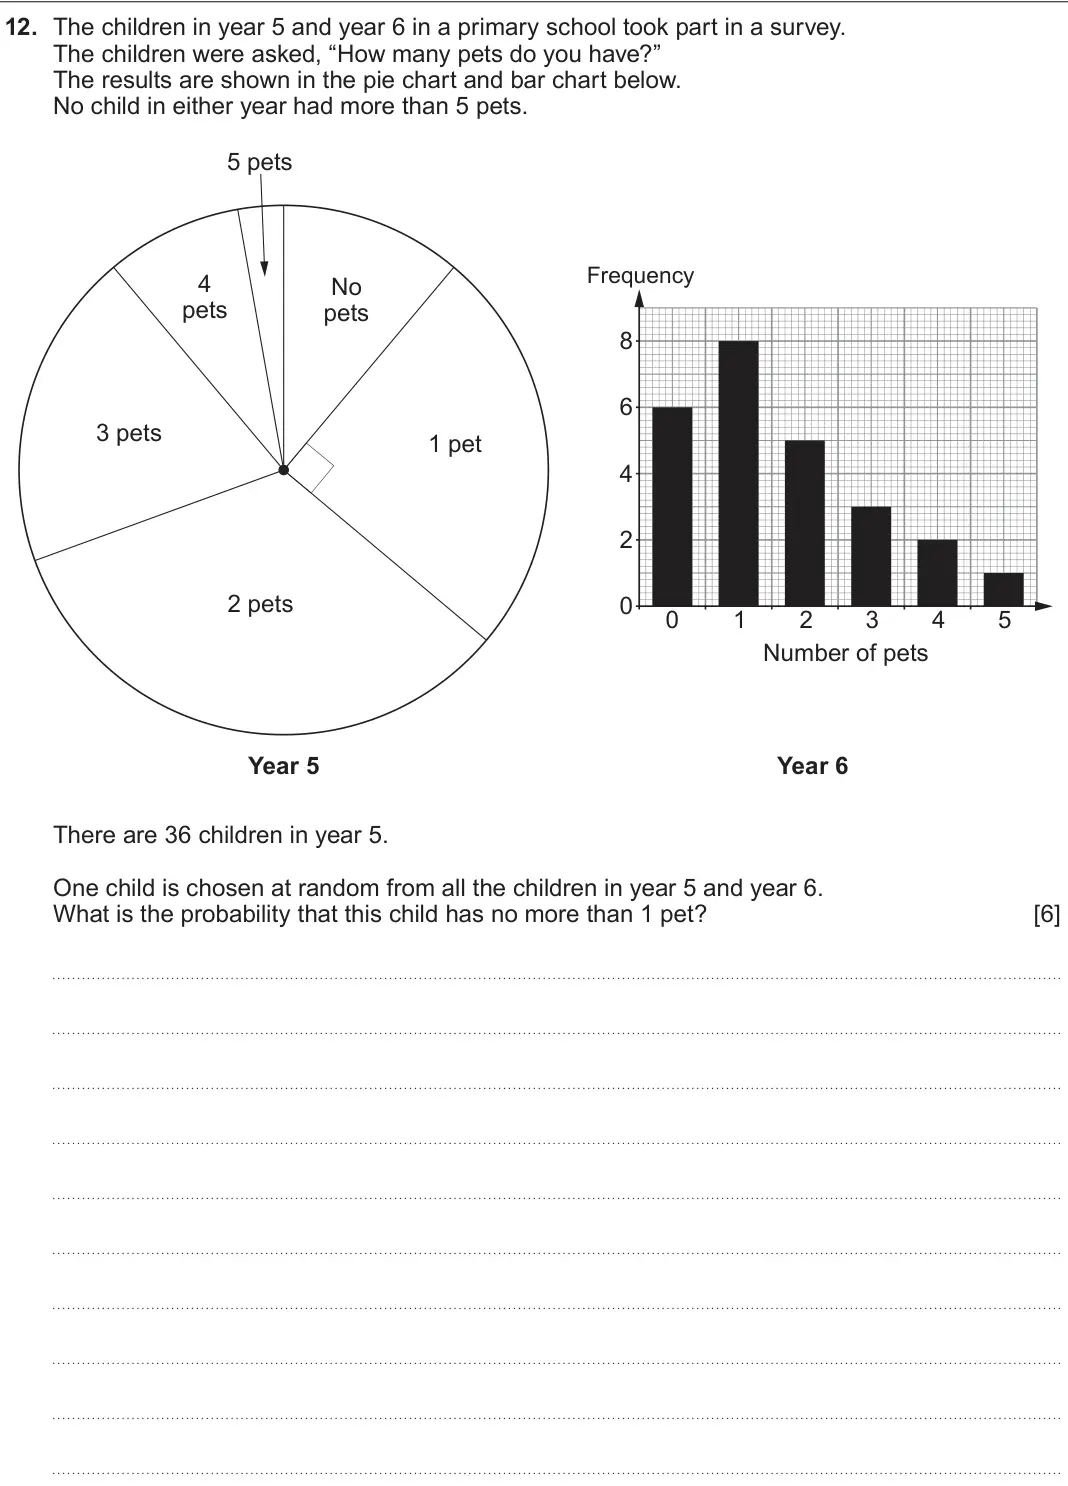
- June 2022, Unit 1 Intermediate, Q12 (6 marks): The children in year 5 and year 6 in a primary school took part in a survey. The children were asked, “How many pets do you have?” The results are shown in the
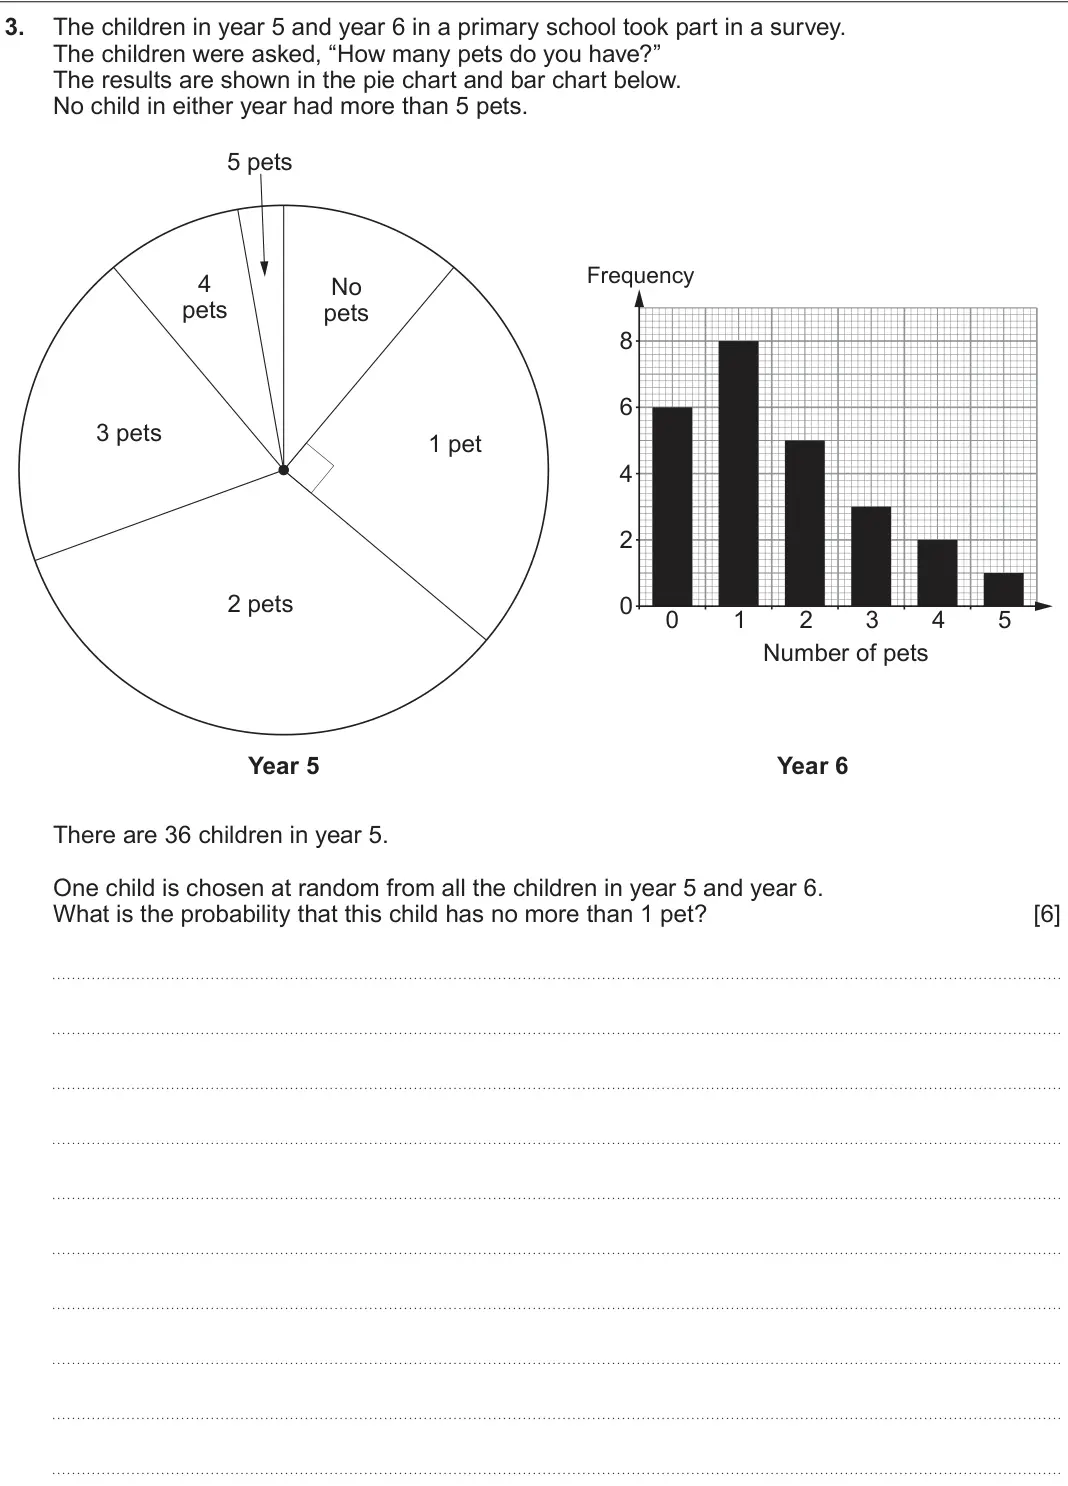
- June 2022, Unit 1 Higher, Q3 (6 marks): The children in year 5 and year 6 in a primary school took part in a survey. The children were asked, “How many pets do you have?” The results are shown in the
- November 2021, Unit 2 Foundation, Q13 (2 marks): Thirty numbers are recorded in the grouped frequency table below. Group 1 to 20 21 to 40 41 to 60 61 to 80 81 to 100 Frequency 3 8 7 6 6 It is decided that the
- November 2021, Unit 2 Intermediate, Q4 (2 marks): Thirty numbers are recorded in the grouped frequency table below. Group 1 to 20 21 to 40 41 to 60 61 to 80 81 to 100 Frequency 3 8 7 6 6 It is decided that the
- November 2021, Unit 2 Intermediate, Q11 (4 marks): A company has two sites. One is in North Wales and the other is in South Wales. The pie charts below show the distribution of its 96 part-time staff and its 150
- November 2021, Unit 2 Higher, Q2 (4 marks): A company has two sites. One is in North Wales and the other is in South Wales. The pie charts below show the distribution of its 96 part-time staff and its 150
- November 2020, Unit 1 Foundation, Q16 (3 marks): 300 students were asked if they would like to change their school’s dinner menu. The pie chart below shows how they answered. Not sure 120° Yes 60° No Complete
- November 2020, Unit 1 Intermediate, Q4 (3 marks): 300 students were asked if they would like to change their school’s dinner menu. The pie chart below shows how they answered. Not sure 120° Yes 60° No Complete
- November 2020, Unit 2 Higher, Q5 (4 marks): Data for different values of t are shown in the table below. t Frequency 8 0 X t ! 5 5 X t ! 10 0 10 X t ! 15 7 15 X t ! 20 5 Calculate an estimate for the mean
- November 2019, Unit 2 Foundation, Q14 (3 marks): (a) A person is chosen at random. Which is the best estimate for the probability that this person was born in the month of March? Circle the correct answer. [1]
- November 2019, Unit 2 Foundation, Q16 (5 marks): A coach company runs trips to Llandudno and Aberystwyth. The information kept by the company about the passengers on these trips includes: • the destination of
- November 2019, Unit 1 Intermediate, Q9 (4 marks): (a) Express 60 out of 300 as a percentage. [2] Answer is …… ……………. % (b) Some people were asked a question. 40% of the people answered ‘Yes’. A sketch of a pie
- November 2019, Unit 2 Intermediate, Q4 (3 marks): (a) A person is chosen at random. Which is the best estimate for the probability that this person was born in the month of March? Circle the correct answer. [1]
- November 2019, Unit 2 Intermediate, Q6 (5 marks): A coach company runs trips to Llandudno and Aberystwyth. The information kept by the company about the passengers on these trips includes: • the destination of
- November 2019, Unit 2 Intermediate, Q11 (7 marks): (a) A biased coin is thrown 100 times. The number of heads thrown is recorded after 20 throws, 40 throws, 60 throws, 80 throws and 100 throws. Some of the resul
- November 2019, Unit 2 Higher, Q2 (9 marks): (a) A biased coin is thrown 100 times. The number of heads thrown is recorded after 20 throws, 40 throws, 60 throws, 80 throws and 100 throws. Some of the resul
- June 2019, Unit 1 Foundation, Q6 (7 marks): The pie chart below shows the favourite sport of 60 people. Swimming Football Tennis (a) Which is the modal sport? [1] (b) One person is chosen at random. What
- June 2019, Unit 1 Foundation, Q10 (5 marks): Twenty-five balls have numbers printed on them. Some of the balls are coloured yellow (Y), the others are coloured blue (B). The list below shows both the colou
- June 2019, Unit 1 Intermediate, Q2 (5 marks): Twenty-five balls have numbers printed on them. Some of the balls are coloured yellow (Y), the others are coloured blue (B). The list below shows both the colou
- June 2019, Unit 2 Intermediate, Q13 (4 marks): A company has 3 sites based in Wales. One is in Carno, one is in Holyhead and one is in Porth. The pie charts below show the distribution of its 128 female staf
- June 2019, Unit 2 Higher, Q5 (4 marks): A company has 3 sites based in Wales. One is in Carno, one is in Holyhead and one is in Porth. The pie charts below show the distribution of its 128 female staf
- November 2018, Unit 2 Foundation, Q11 (4 marks): One day, Gwyn was asleep for 8 hours and awake for the remaining hours. Draw an accurate pie chart to illustrate this information. [4] Pie chart showing Gwyn’s
- November 2018, Unit 2 Intermediate, Q3 (4 marks): One day, Gwyn was asleep for 8 hours and awake for the remaining hours. Draw an accurate pie chart to illustrate this information. [4] Pie chart showing Gwyn’s
- June 2018, Unit 1 Intermediate, Q13 (6 marks): (a) A fair, six-sided dice is thrown twice. What is the probability that a 3 is thrown on both occasions? [2] (b) A company has offices in Llanelli, Caernarfon,
- June 2018, Unit 1 Higher, Q4 (6 marks): (a) A fair, six-sided dice is thrown twice. What is the probability that a 3 is thrown on both occasions? [2] (b) A company has offices in Llanelli, Caernarfon,
- June 2017, Unit 1 Foundation, Q5 (5 marks): Blues, Dragons, Ospreys and Scarlets are four Welsh rugby teams. Aled asked a group of 170 pupils which of these 4 teams they preferred. He then drew this bar c
Questions, mark schemes and examiner’s reports are © WJEC CBAC Ltd, from their published past papers. Plumi isn’t affiliated with any exam board. Want whole papers? WJEC GCSE Maths past papers.
The Plumi iPad app also offers exam-style questions with AI feedback on your handwritten working.