 plumi
Data presentation and interpretation: OCR MEI A‑Level Maths questions
Every OCR MEI A-Level Maths exam question on S.2 Data presentation and interpretation, 2018–2025, with its mark scheme and examiner’s report.
Find questions560










All 56 questions on Data presentation and interpretation, as a list
- June 2025, Paper 2, Q8 (4 marks): At the end of the summer term all 120 Year 8 pupils at Oakmount College sit the same mathematics examination. The marks obtained by the pupils in the 2024 exami
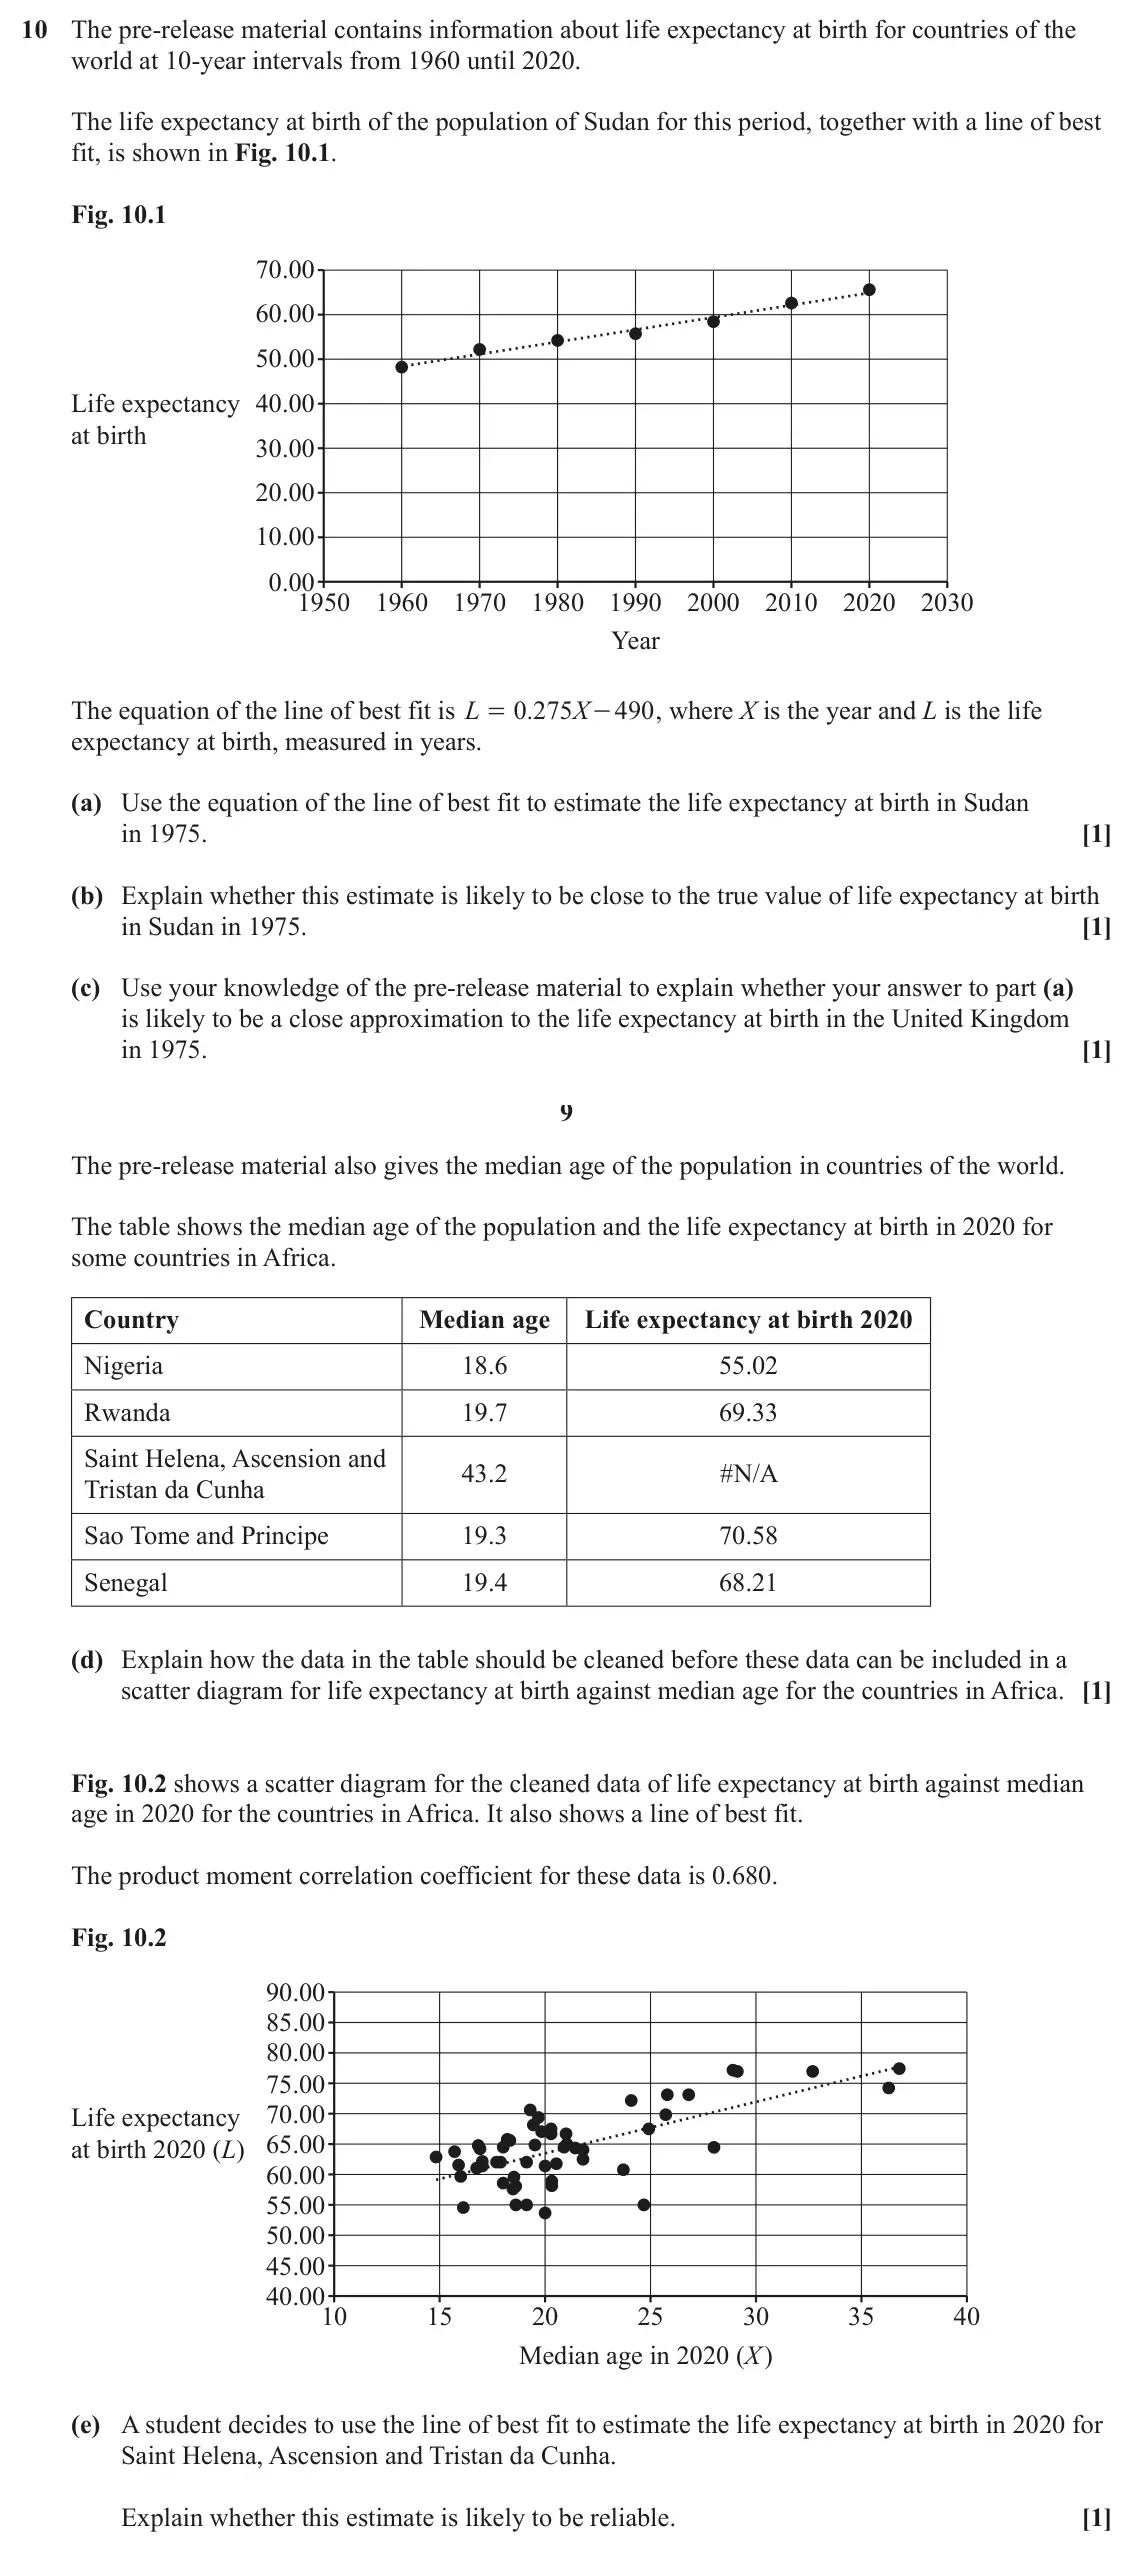
- June 2025, Paper 2, Q10 (5 marks): The pre-release material contains information about life expectancy at birth for countries of the world at 10-year intervals from 1960 until 2020. The life expe
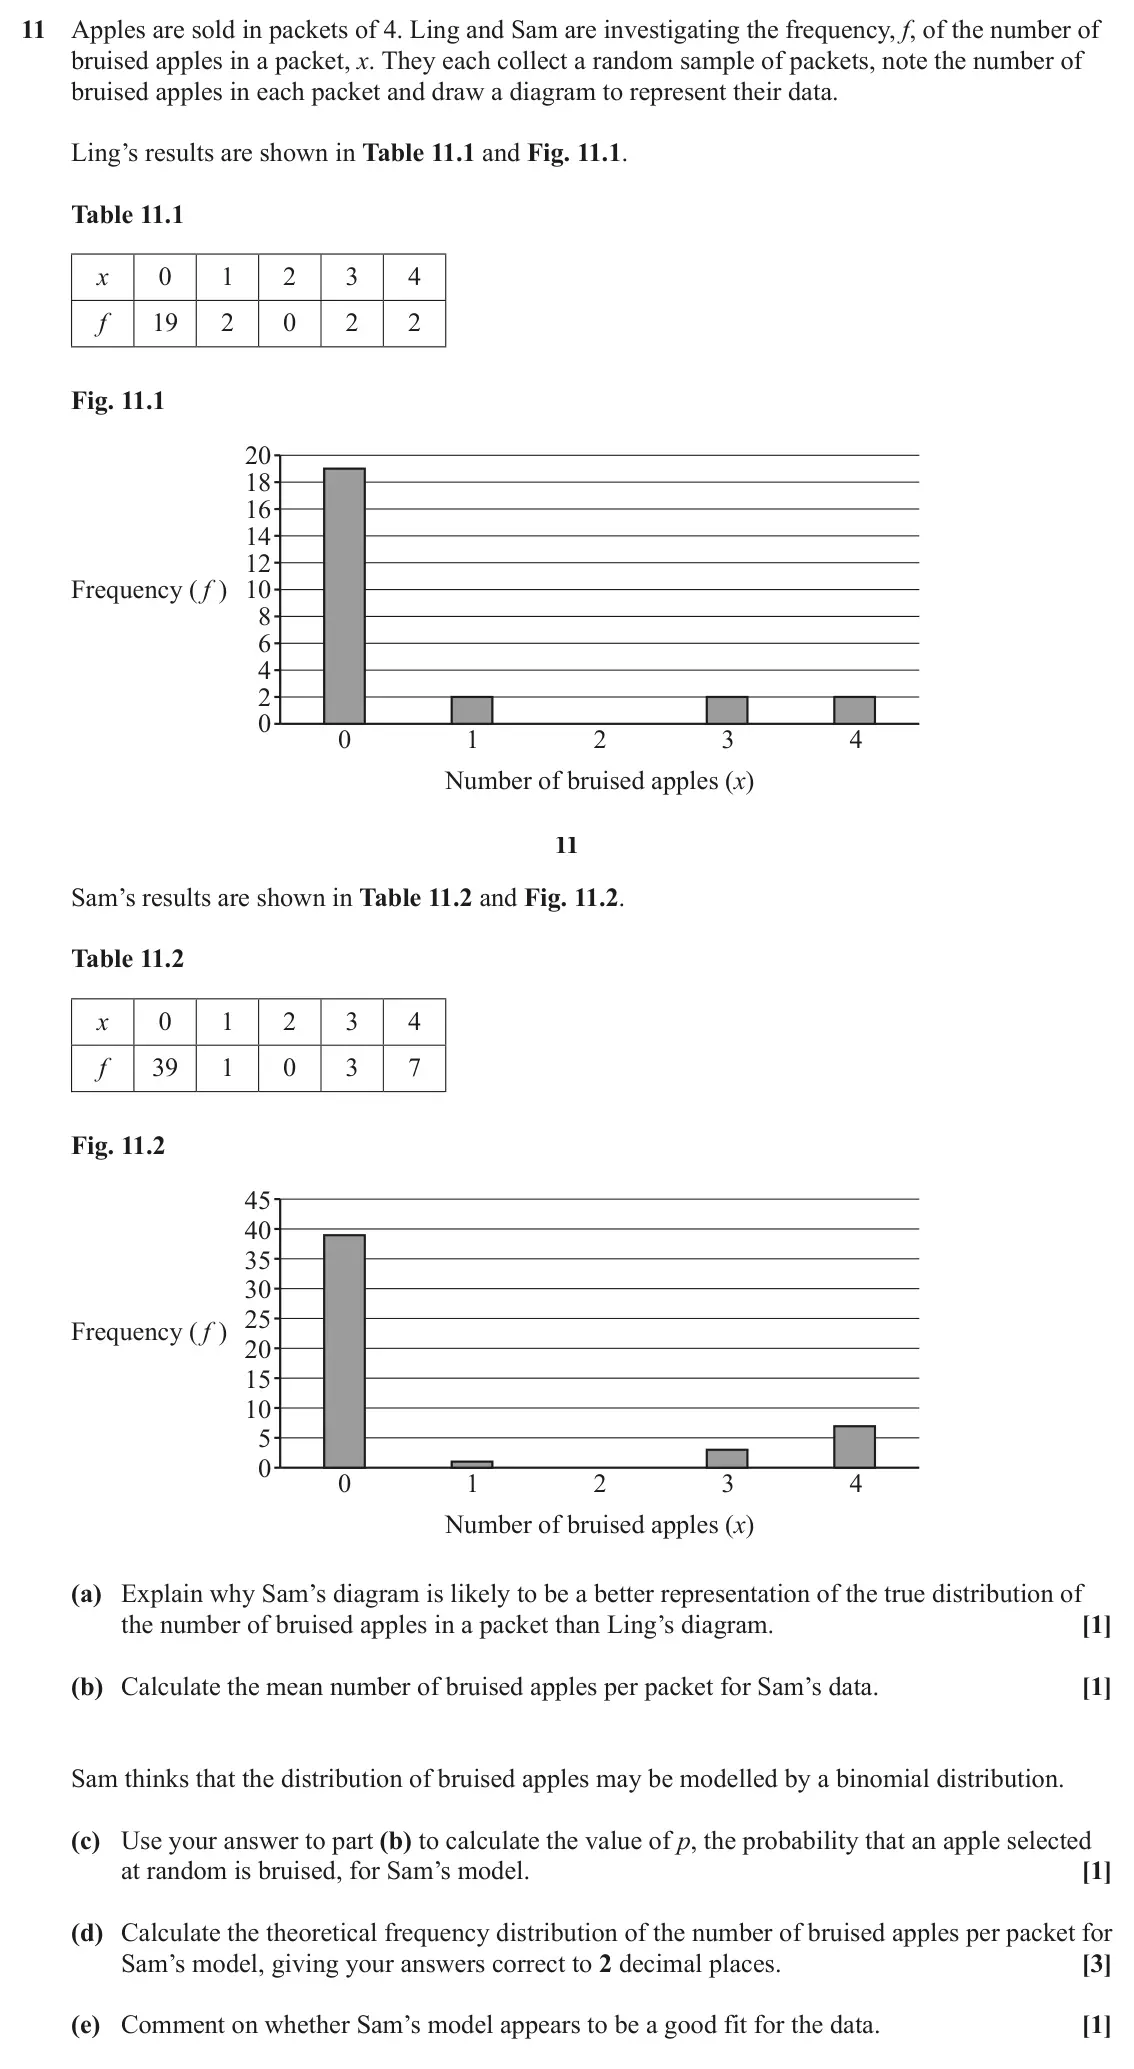
- June 2025, Paper 2, Q11 (7 marks): Apples are sold in packets of 4. Ling and Sam are investigating the frequency, f, of the number of bruised apples in a packet, x. They each collect a random sam
- June 2025, Paper 2, Q15 (10 marks): A personal trainer is investigating whether, in the general population, there is any association between resting pulse rate in beats per minute and mean hours p
- June 2025, AS Paper 2, Q4 (2 marks): The pre-release material contains data for percentage employment rates in different areas of England. The diagram shows percentage employment rates between 2008
- June 2025, AS Paper 2, Q5 (3 marks): All members of a class of year 9 pupils are asked to roll a fair dice a number of times, record the results and represent them using a suitable diagram. Kai’s d
- June 2025, AS Paper 2, Q7 (5 marks): The pre-release material contains data on household waste recycling rates and mean income of taxpayers in different areas of England. The scatter diagram shows
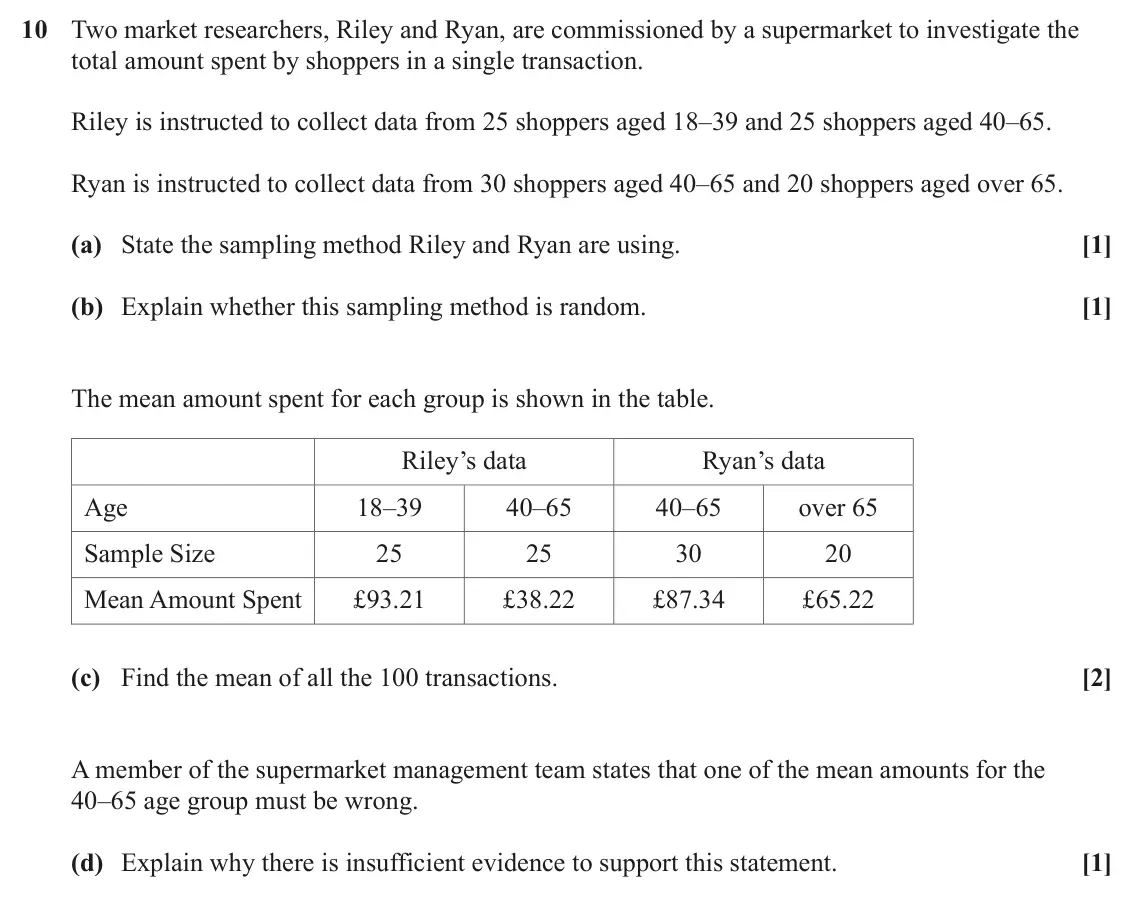
- June 2025, AS Paper 2, Q10 (5 marks): Two market researchers, Riley and Ryan, are commissioned by a supermarket to investigate the total amount spent by shoppers in a single transaction. Riley is in
- June 2025, AS Paper 2, Q14 (4 marks): An environmental scientist is monitoring the fish population in a river. One day he catches some fish from a certain pool on the river. He weighs each fish befo
- June 2024, Paper 2, Q3 (3 marks): The histogram shows the amount spent on electricity in pounds in a sample of households in March 2023. 4 3 Frequency 2 density 1 0 50 60 70 80 90 100 Amount spe
- June 2024, Paper 2, Q11 (5 marks): A householder is investigating whether there is any relationship between his monthly cost of gas and his monthly cost of electricity, both measured in pounds (£
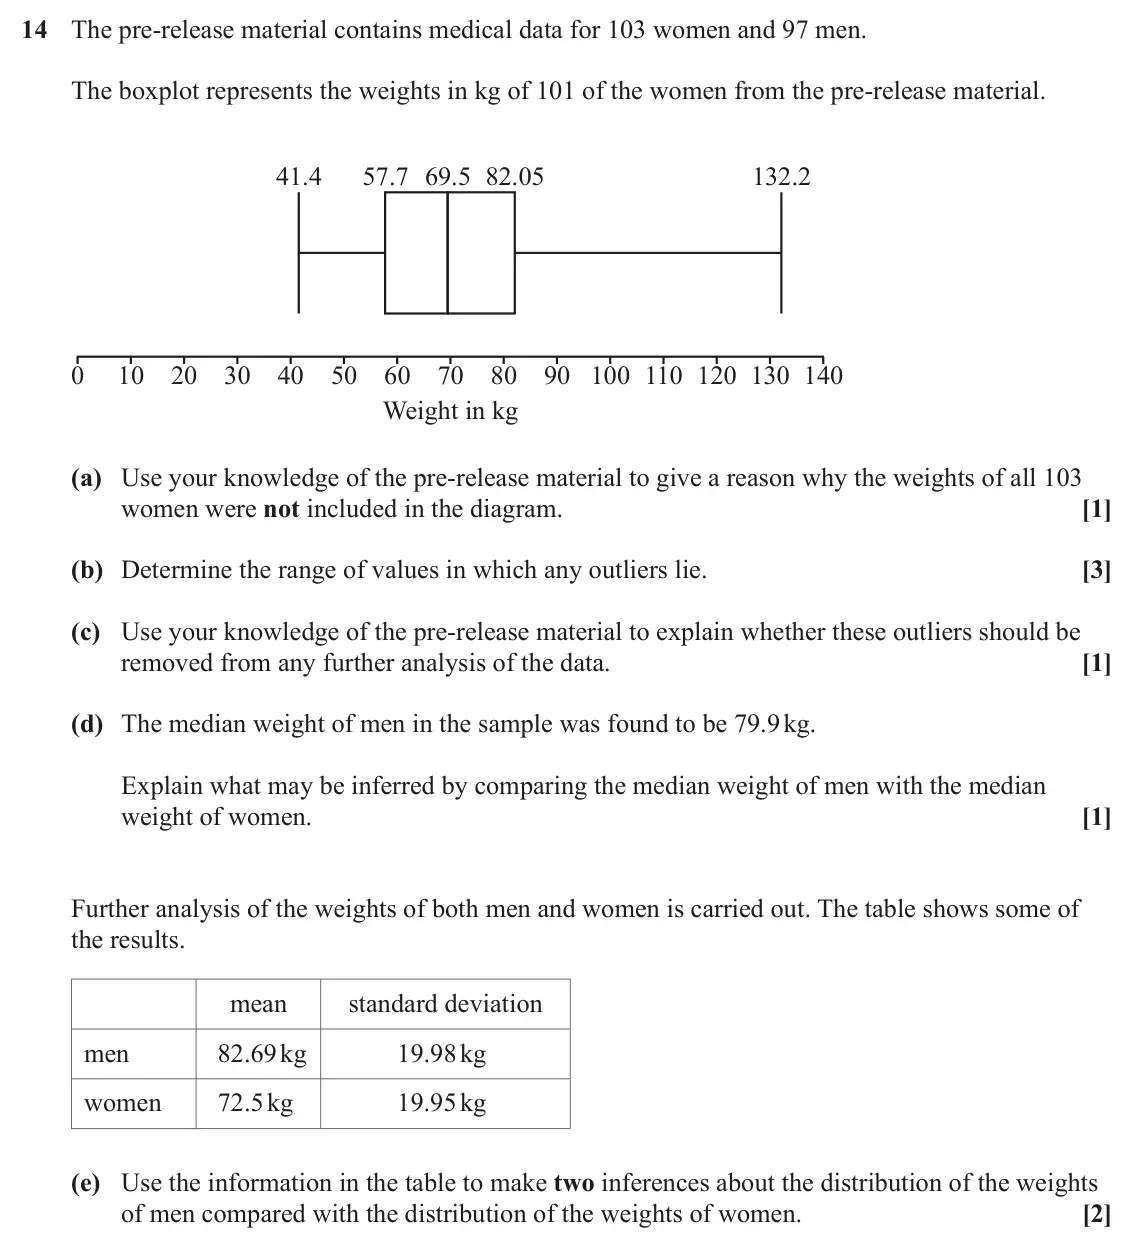
- June 2024, Paper 2, Q14 (8 marks): The pre-release material contains medical data for 103 women and 97 men. The boxplot represents the weights in kg of 101 of the women from the pre-release mater
- June 2024, Paper 2, Q15 (17 marks): Bottles of Fizzipop nominally contain 330 ml of drink. A consumer affairs researcher collects a random sample of 55 bottles of Fizzipop and records the volume o
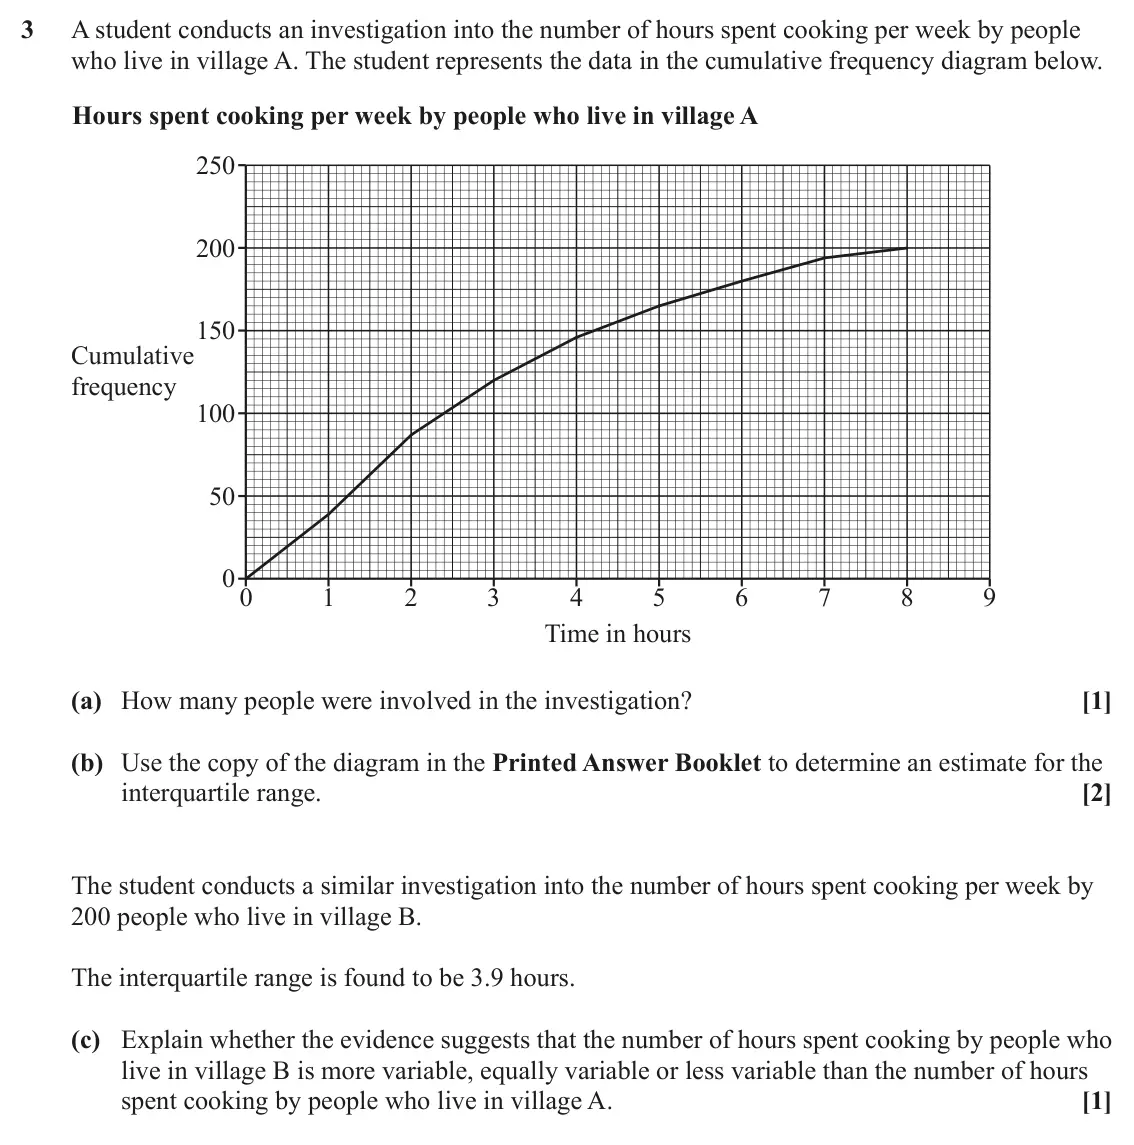
- June 2024, AS Paper 2, Q3 (4 marks): A student conducts an investigation into the number of hours spent cooking per week by people who live in village A. The student represents the data in the cumu
- June 2024, AS Paper 2, Q5 (3 marks): The pre-release material contains information for countries in the world concerning real GDP per capita in US$ and mobile phone subscribers per 100 population.
- June 2024, AS Paper 2, Q10 (6 marks): The pre-release material contains information about the birth rate per 1000 people in different countries of the world. These countries have been classified int
- June 2023, Paper 2, Q8 (6 marks): A garden centre stocks coniferous hedging plants. These are displayed in 10 rows, each of 120 plants. An employee collects a sample of the heights of these plan
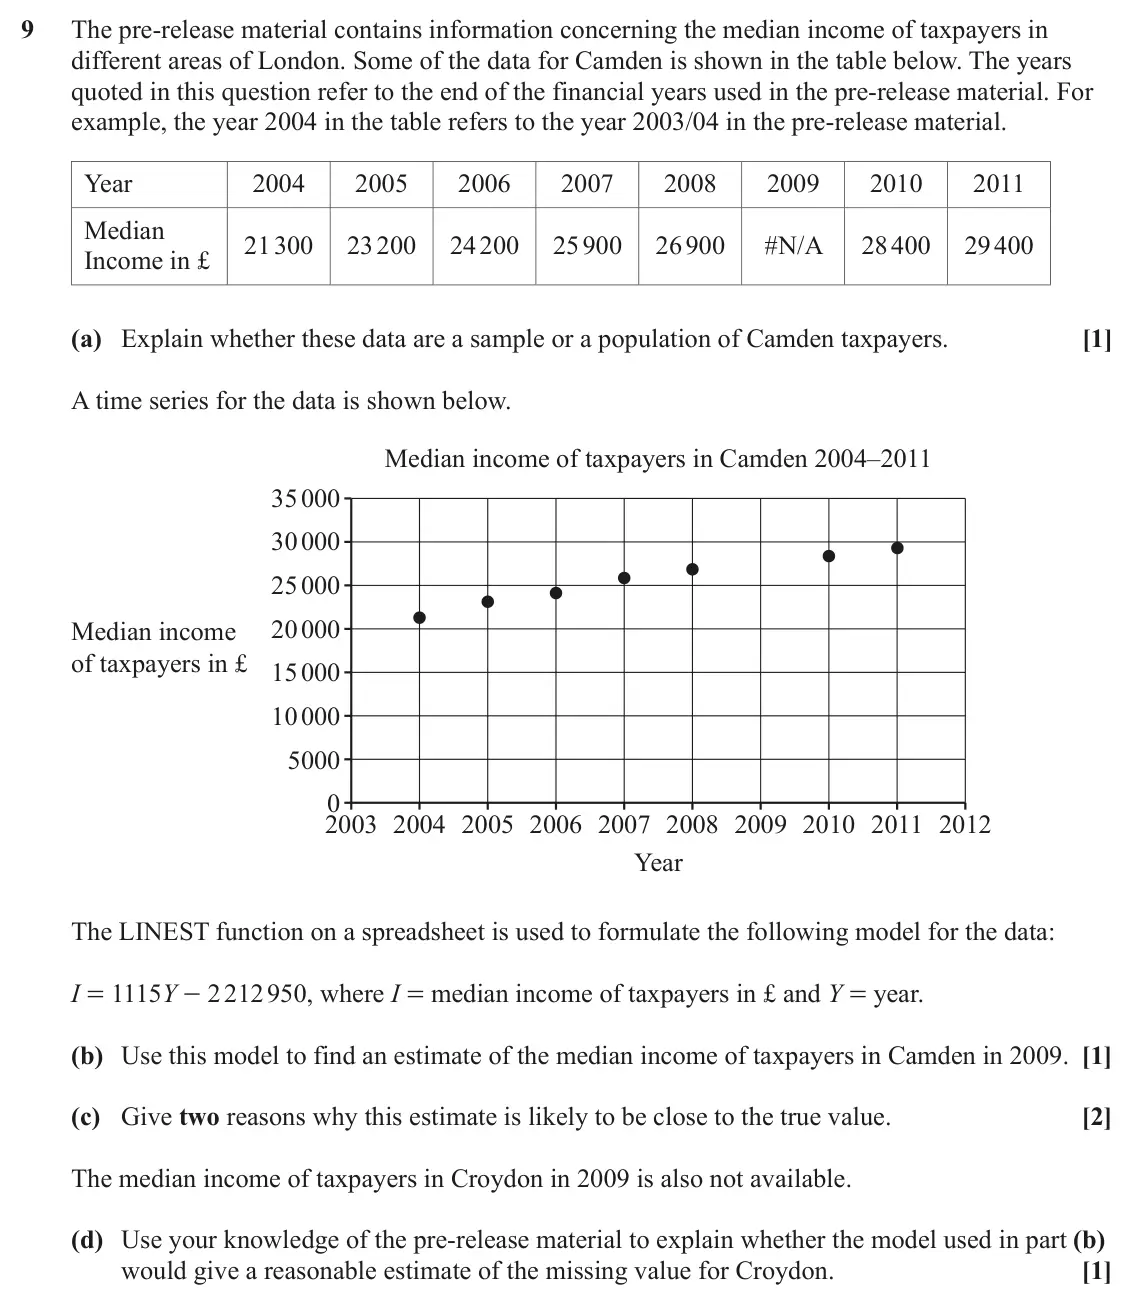
- June 2023, Paper 2, Q9 (5 marks): The pre-release material contains information concerning the median income of taxpayers in different areas of London. Some of the data for Camden is shown in th
- June 2023, Paper 2, Q14 (8 marks): The pre-release material contains information concerning the median income of taxpayers in £ and the percentage of all pupils at the end of KS4 achieving 5 or m
- June 2023, Paper 2, Q18 (11 marks): Riley is investigating the daily water consumption, in litres, of his household. He records the amount used for a random sample of 120 days from the previous tw
- June 2023, AS Paper 2, Q1 (3 marks): A researcher collects data concerning the number of different social media platforms used by school pupils on a typical weekday. The frequency table for the dat
- June 2023, AS Paper 2, Q6 (6 marks): An app on my new smartphone records the number of times in a day I use the phone. The data for each day since I bought the phone are shown in the stem and leaf
- June 2023, AS Paper 2, Q8 (4 marks): The pre-release material contains information on Pulse Rate and Body Mass Index (BMI). A student is investigating whether there is a relationship between pulse
- June 2023, AS Paper 2, Q12 (6 marks): Doctors are investigating the weights of adult males registered at their surgery. One week they collect a sample by noting the weight in kilograms of all the ad
- June 2022, Paper 2, Q7 (2 marks): Kareem bought some tomatoes. He recorded the mass of each tomato and displayed the results in a histogram, which is shown below. y 4 3 Frequency density 2 1 0 1
- June 2022, Paper 2, Q8 (3 marks): Ali conducted an investigation into the distances ridden by those members of a cycling club who rode at least 120 km in a training week. She grouped all the dis
- June 2022, Paper 2, Q9 (9 marks): At the beginning of the academic year, all the pupils in year 12 at a college take part in an assessment. Summary statistics for the marks obtained by the 2021
- June 2022, Paper 2, Q15 (9 marks): The pre-release material includes information on life expectancy at birth in countries of the world. Fig. 15.1 shows the data for Liberia, which is in Africa, t
- June 2022, AS Paper 2, Q5 (6 marks): Ali collected data from a random sample of 200 workers and recorded the number of days they each worked from home in the second week of September 2019. These da
- June 2022, AS Paper 2, Q6 (6 marks): The pre-release material contains information about employment rates in London boroughs. The graph shows employment rates for Westminster between 2006 and 2019.
- June 2022, AS Paper 2, Q11 (9 marks): The pre-release material contains information about the Median Income of Taxpayers and the Percentage of Pupils Achieving at Least 5 A*– C grades, including Eng
- November 2021, Paper 2, Q10 (9 marks): Ben has an interest in birdwatching. For many years he has identified, at the start of the year, 32 days on which he will spend an hour counting the number of b
- November 2021, Paper 2, Q12 (7 marks): Fig. 12.1 shows an excerpt from the pre-release material. A B C D E F G H 1 Sex Age Marital Weight Height BMI Waist Pulse 2 Female 34 Married 60.3 173.4 20.05 8
- November 2021, Paper 2, Q13 (7 marks): At a certain factory Christmas tree decorations are packed in boxes of 10. The quality control manager collects a random sample of 100 boxes of decorations and
- November 2021, AS Paper 2, Q2 (2 marks): Mia rolls a six-sided die 24 times and records the scores. She displays her results in a vertical line chart. This is shown in Fig. 2.1. Scores on a six-sided d
- November 2021, AS Paper 2, Q7 (7 marks): The pre-release material contains information about health expenditure. Fig. 7.1 shows an extract from the data. Health expenditure Country (% of GDP) Algeria 7
- November 2021, AS Paper 2, Q9 (5 marks): Arun, Beth and Charlie are investigating whether there is any association between death rate per 1000 and physician density per 1000. They each collect a random
- November 2021, AS Paper 2, Q11 (6 marks): James is investigating the amount of time retired people spend each day using social media. He collects a sample by advertising in a local newspaper for people
- November 2021, AS Paper 2, Q12 (8 marks): A manufacturer of steel rods checks the length of each rod in randomly selected batches of 10 rods. 100 batches of 10 rods are checked and x, the number of rods
- November 2020, Paper 2, Q4 (2 marks): Fig. 4 shows a cumulative frequency diagram for the time spent revising mathematics by year 11 students at a certain school during a week in the summer term. Ye
- November 2020, Paper 2, Q8 (12 marks): Rosella is carrying out an investigation into the age at which adults retire from work in the city where she lives. She collects a sample of size 50, ensuring t
- November 2020, Paper 2, Q11 (10 marks): The pre-release material contains information concerning median house prices over the period 2004 – 2015. A spreadsheet has been used to generate a time series
- November 2020, Paper 2, Q13 (7 marks): The pre-release material contains information concerning median house prices, recycling rates and employment rates. Fig. 13.1 shows a scatter diagram of recycli
- November 2020, AS Paper 2, Q2 (3 marks): A student measures the upper arm lengths of a sample of 97 women. The results are summarised in the frequency table in Fig. 2.1. Arm length in cm 30 – 31 – 32 –
- November 2020, AS Paper 2, Q3 (8 marks): A researcher is conducting an investigation into the number of portions of fruit adults consume each day. The researcher decides to ask 50 men and 50 women to c
- November 2020, AS Paper 2, Q10 (9 marks): Fig. 10.1 shows a sample collected from the large data set. mass of person in kilograms BMI is defined as square of person’s height in metres. Sex Age in years
- June 2019, Paper 2, Q3 (3 marks): Fig. 3 shows the time Lorraine spent in hours, t, answering e-mails during the working day. The data were collected over a number of months. Time in hours, 0 t
- June 2019, Paper 2, Q5 (3 marks): Fig. 5 shows the number of times that students at a sixth form college visited a recreational mathematics website during the first week of the summer term. Numb
- June 2019, Paper 2, Q14 (8 marks): The pre-release material includes data concerning crude death rates in different countries of the world. Fig. 14.1 shows some information concerning crude death
- June 2019, AS Paper 2, Q6 (13 marks): The large data set gives information about life expectancy at birth for males and females in different London boroughs. Fig. 6.1 shows summary statistics for fe
- June 2018, Paper 2, Q4 (2 marks): A survey of the number of cars per household in a certain village generated the data in Fig. 4. Number of cars 0 1 2 3 4 Number of households 8 22 31 27 7 Fig.
- June 2018, Paper 2, Q9 (5 marks): At the end of each school term at North End College all the science classes in year 10 are given a test. The marks out of 100 achieved by members of set 1 are s
- June 2018, Paper 2, Q14 (9 marks): The pre-release material includes data on unemployment rates in different countries. A sample from this material has been taken. All the countries in the sample
- June 2018, AS Paper 2, Q2 (3 marks): Doug has a list of times taken by competitors in a ‘fun run’. He has grouped the data and calculated the frequency densities in order to draw a histogram to rep
- June 2018, AS Paper 2, Q7 (8 marks): Rose and Emma each wear a device that records the number of steps they take in a day. All the results for a 7-day period are given in Fig. 7. Day 1 2 3 4 5 6 7
- June 2018, AS Paper 2, Q11 (9 marks): The pre-release material contains data concerning the death rate per thousand people and the birth rate per thousand people in all the countries of the world. T
Questions, mark schemes and examiner’s reports are © OCR, from their published past papers. Plumi isn’t affiliated with any exam board. Want whole papers? Every OCR MEI A-Level Maths paper.
Rather write your answers by hand on iPad? Plumi marks them against the same mark schemes.