 plumi
Opportunity cost: OCR A‑Level Economics questions
Every OCR A-Level Economics exam question on 1.3 Opportunity cost, 2021–2025, with its mark scheme and examiner’s report.
Find questions478
Exam
All years
Calculations
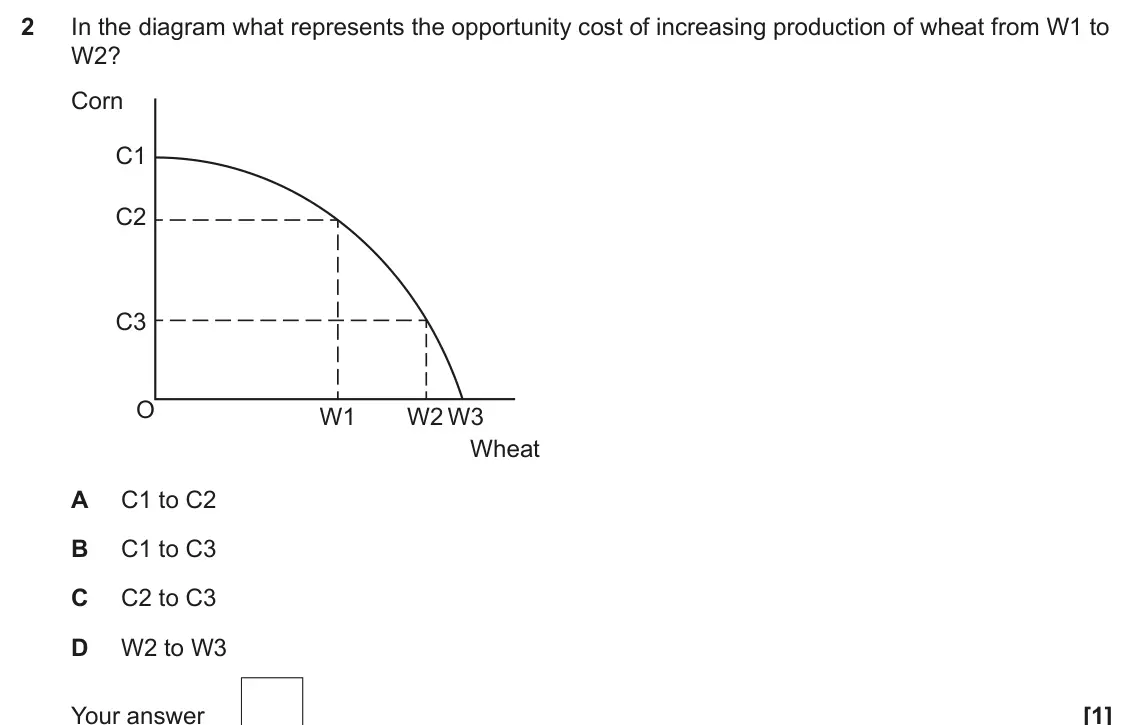 Your answer
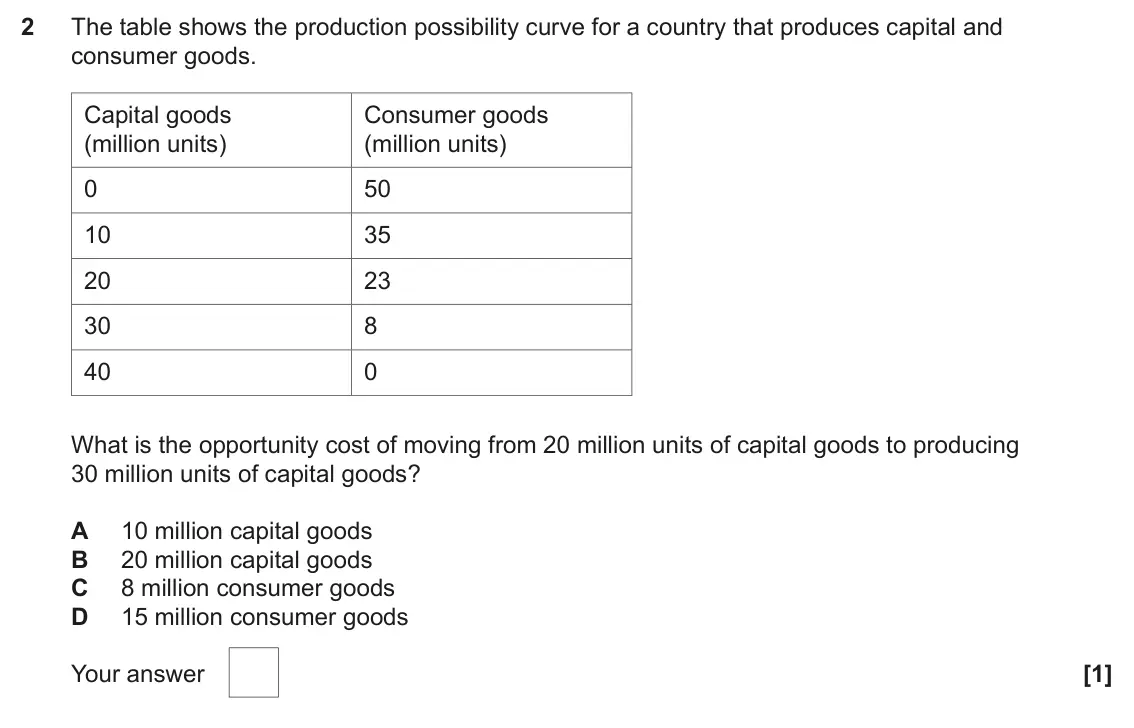 Your answer
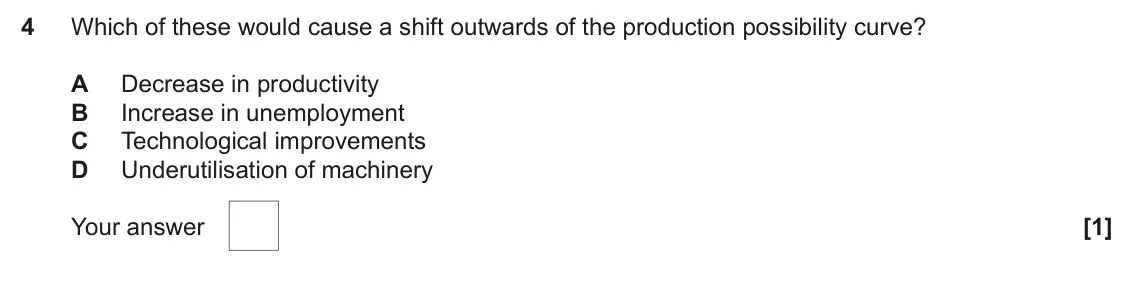 Your answer
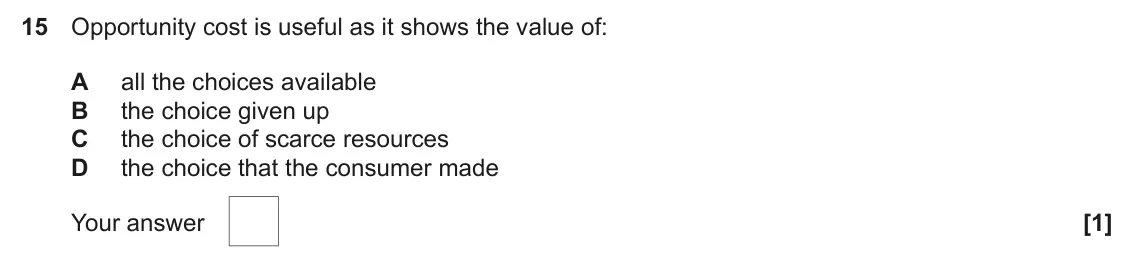 Your answer

 Your answer
 Your answer
 Your answer
 Your answer
All 9 questions on Opportunity cost, as a list
- June 2025, Paper 3, Q2 (1 mark): In the diagram what represents the opportunity cost of increasing production of wheat from W1 to W2? Corn C1 C2 C3 O W1 W2 W3 Wheat A C1 to C2 B C1 to C3 C C2 t
- June 2025, AS Paper 1, Q2 (1 mark): The table shows the production possibility curve for a country that produces capital and consumer goods. Capital goods Consumer goods (million units) (million u
- June 2025, AS Paper 1, Q4 (1 mark): Which of these would cause a shift outwards of the production possibility curve? A Decrease in productivity B Increase in unemployment C Technological improveme
- June 2025, AS Paper 1, Q15 (1 mark): Opportunity cost is useful as it shows the value of: A all the choices available B the choice given up C the choice of scarce resources D the choice that the co
- June 2025, AS Paper 1, Q18 (20 marks): 18* Norway devoted more of its resources to the output of capital goods in 2022. This had an impact on the country’s output of consumer goods. Evaluate, using a
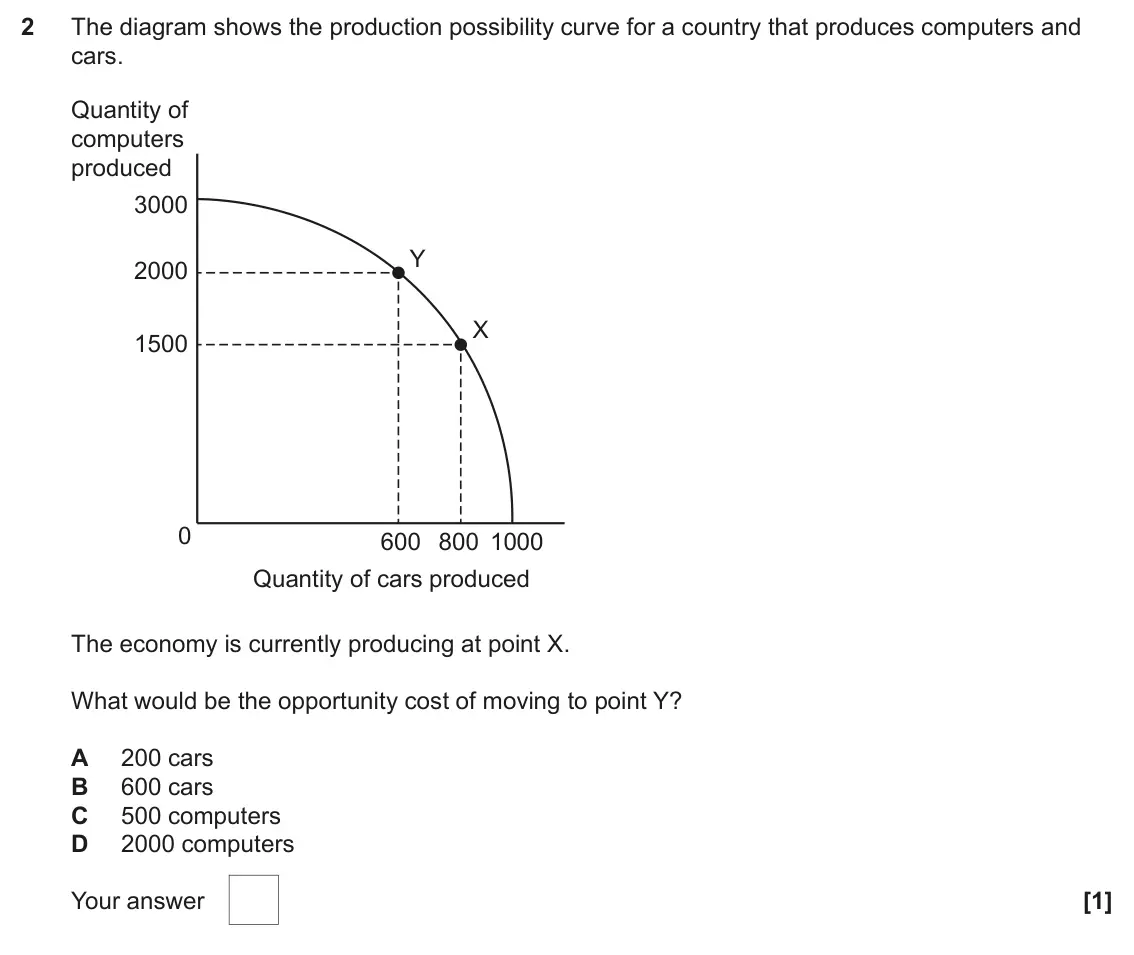
- June 2024, AS Paper 1, Q2 (1 mark): The diagram shows the production possibility curve for a country that produces computers and cars. Quantity of computers produced 3000 Y 2000 X 1500 0 600 800 1
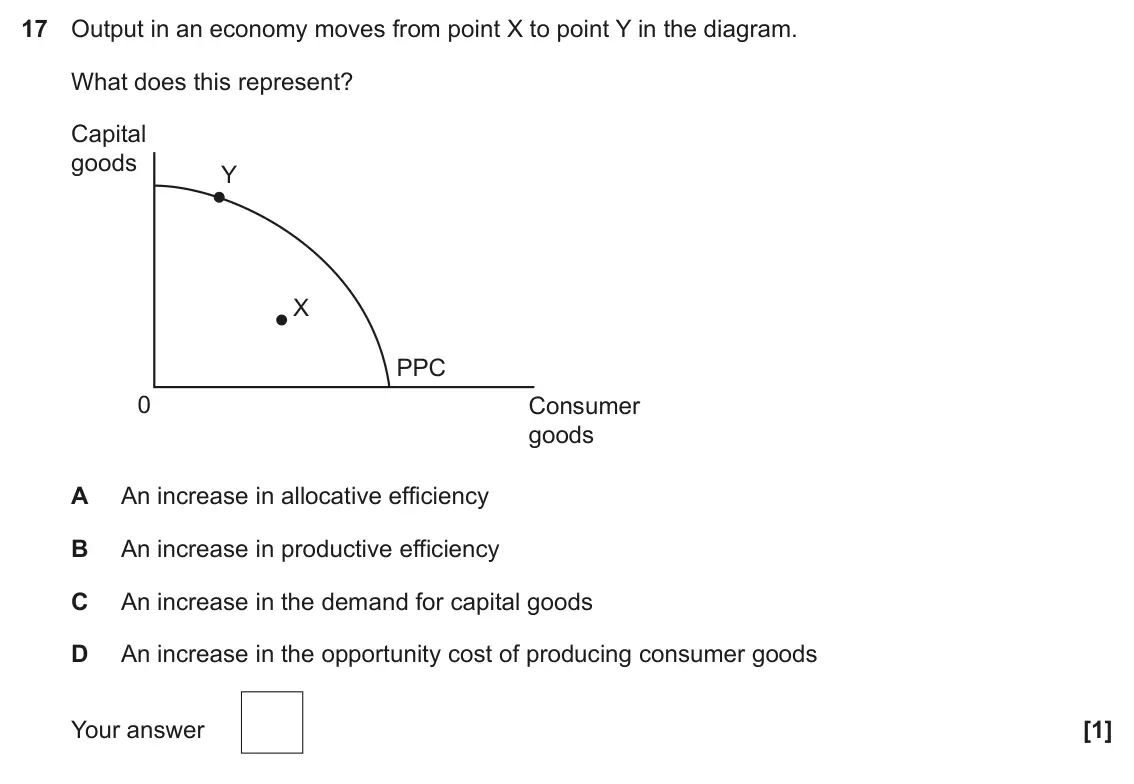
- June 2023, Paper 3, Q17 (1 mark): Output in an economy moves from point X to point Y in the diagram. What does this represent? Capital goods Y X PPC 0 Consumer goods A An increase in allocative
- June 2023, AS Paper 1, Q4 (1 mark): Opportunity cost is defined as the value of: A all alternative goods foregone B the cost of other goods and services C the cost imposed on a third party D the n
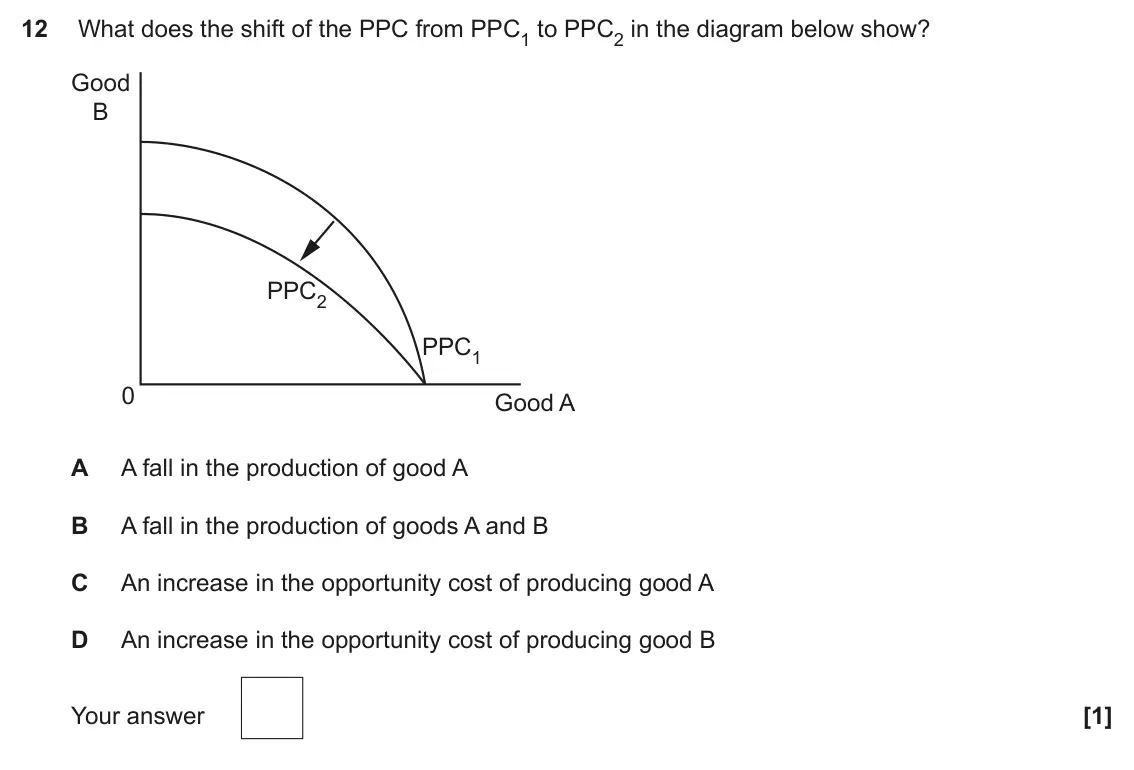
- June 2022, Paper 3, Q12 (1 mark): What does the shift of the PPC from PPC1 to PPC2 in the diagram below show? Good B PPC2 PPC1 0 Good A A A fall in the production of good A B A fall in the produ
Questions, mark schemes and examiner’s reports are © OCR, from their published past papers. Plumi isn’t affiliated with any exam board. Want whole papers? Full past papers.
Rather write your answers by hand on iPad? Plumi marks them against the same mark schemes.