 plumi
The patterns of the distribution and consumption of natural resources varies on a global and a national scale: Edexcel GCSE Geography A questions
Edexcel GCSE Geography A past-paper questions on 6.2 The patterns of the distribution and consumption of natural resources varies on a global and a national scale, 2018–2025, with mark schemes and examiner’s reports where available.
Paper
All papers
Exam
All years
Calculations
Loading the full question list…
Q3(a)(i)
The whole paper ↗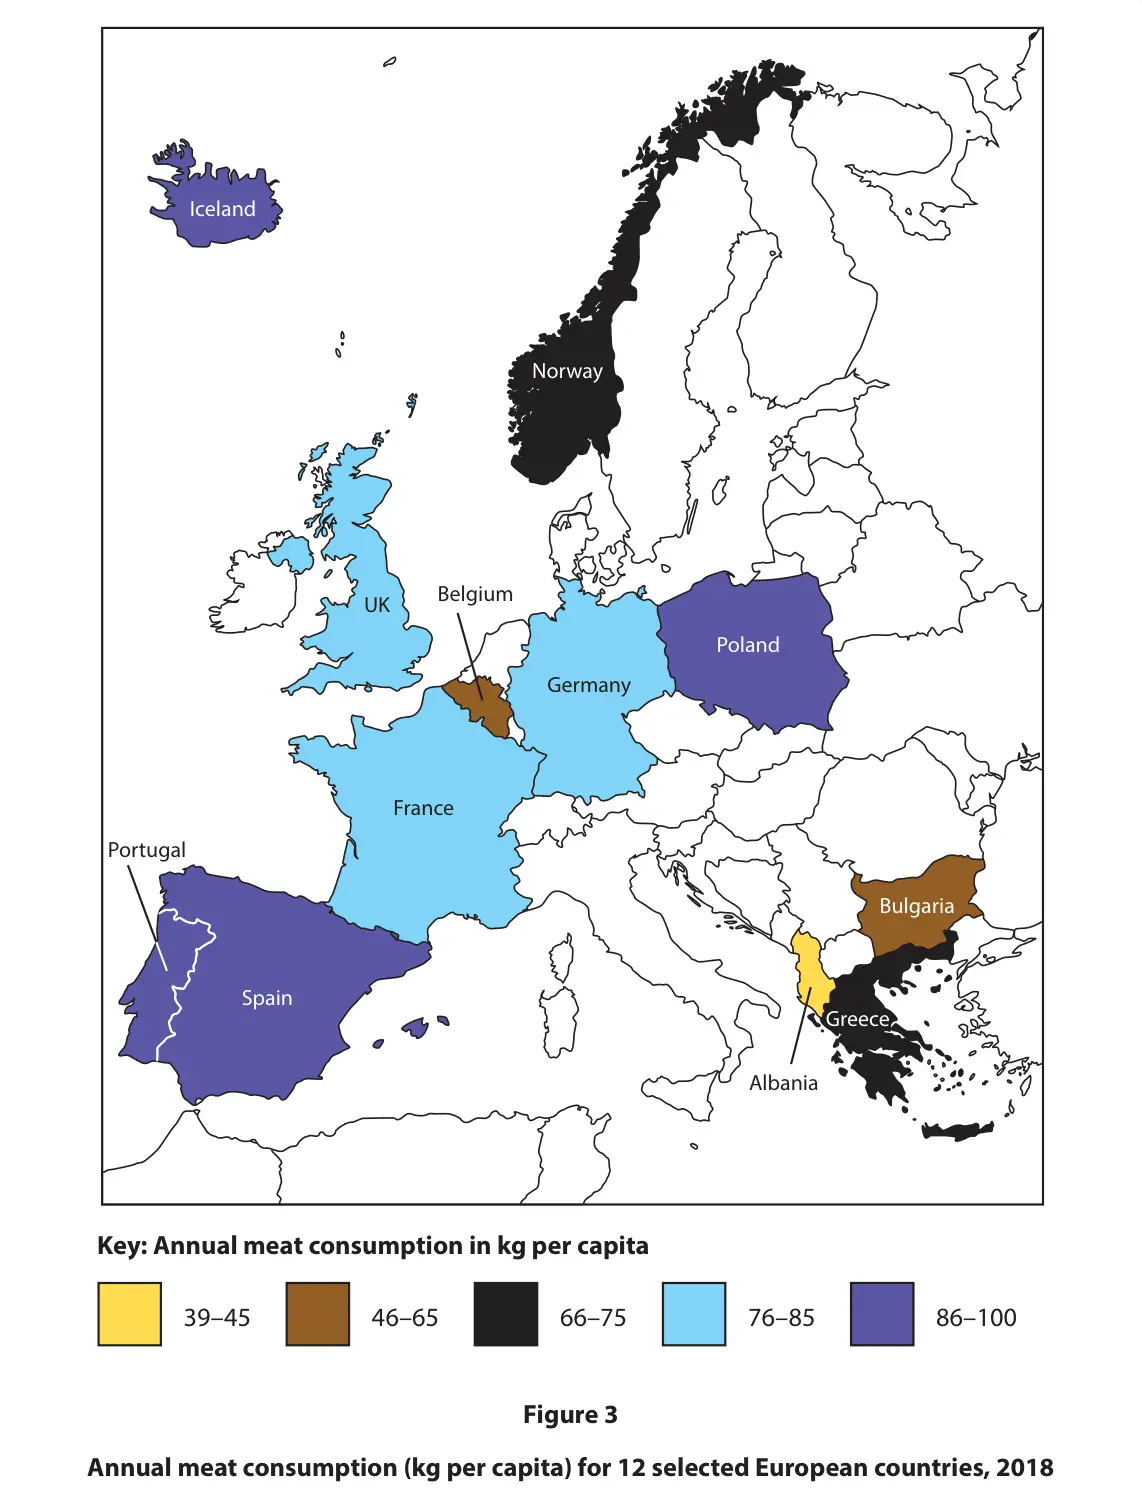 (Total for Question 3 is 1 mark)
Q3(a)(ii)
The whole paper ↗(Total for Question 3 is 1 mark)
Q3(a)(iii)
The whole paper ↗(Total for Question 3 is 2 marks)
Q3(a)(iv)
The whole paper ↗(Total for Question 3 is 2 marks)
Q3(c)
The whole paper ↗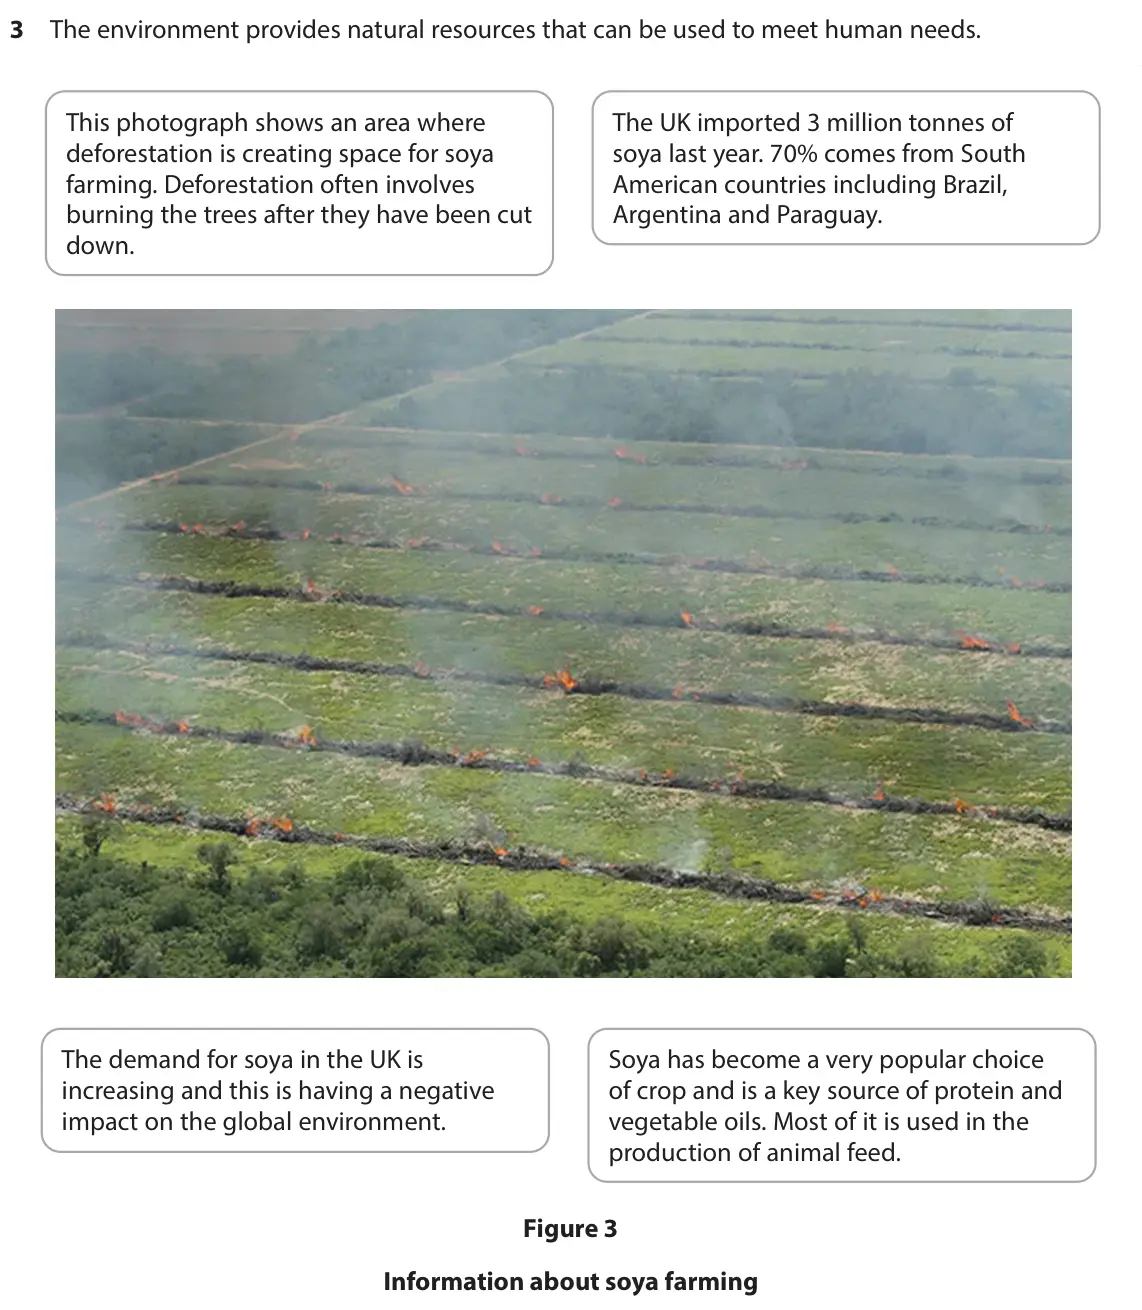 (Total for Question 3 is 1 mark)

Q3(c)(i)
The whole paper ↗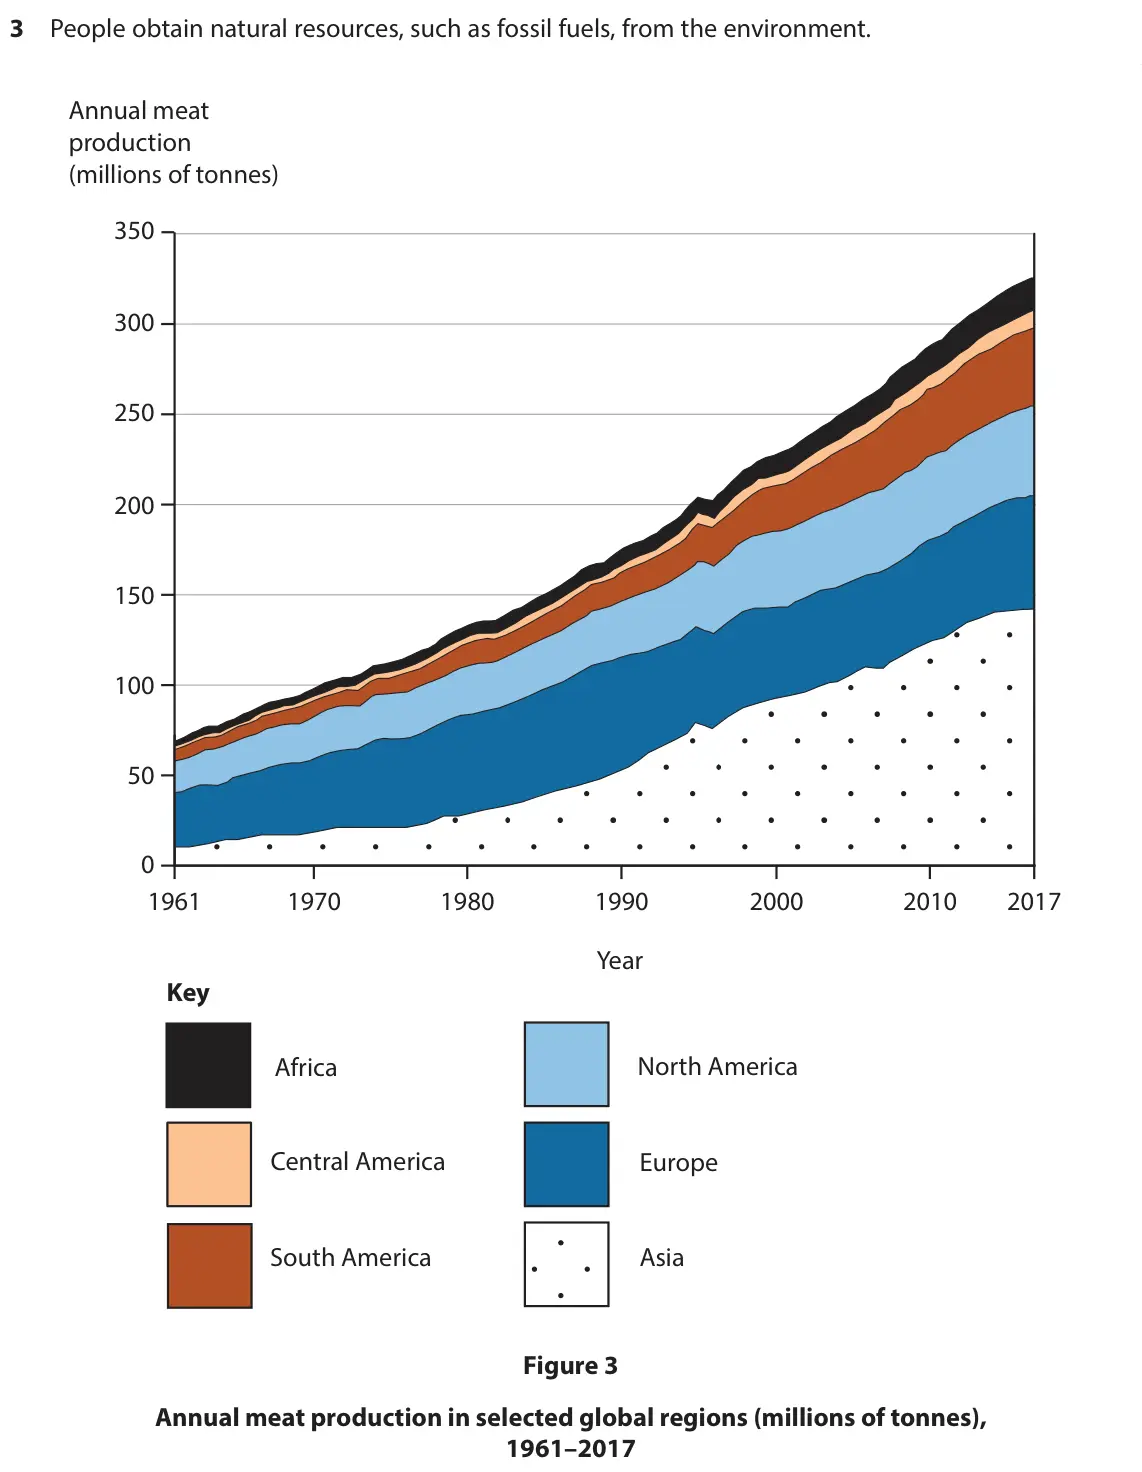 (Total for Question 3 is 1 mark)

Q3(c)(ii)
The whole paper ↗(Total for Question 3 is 2 marks)
Q3(c)(iii)
The whole paper ↗(Total for Question 3 is 3 marks)
Q3(a)(i)
The whole paper ↗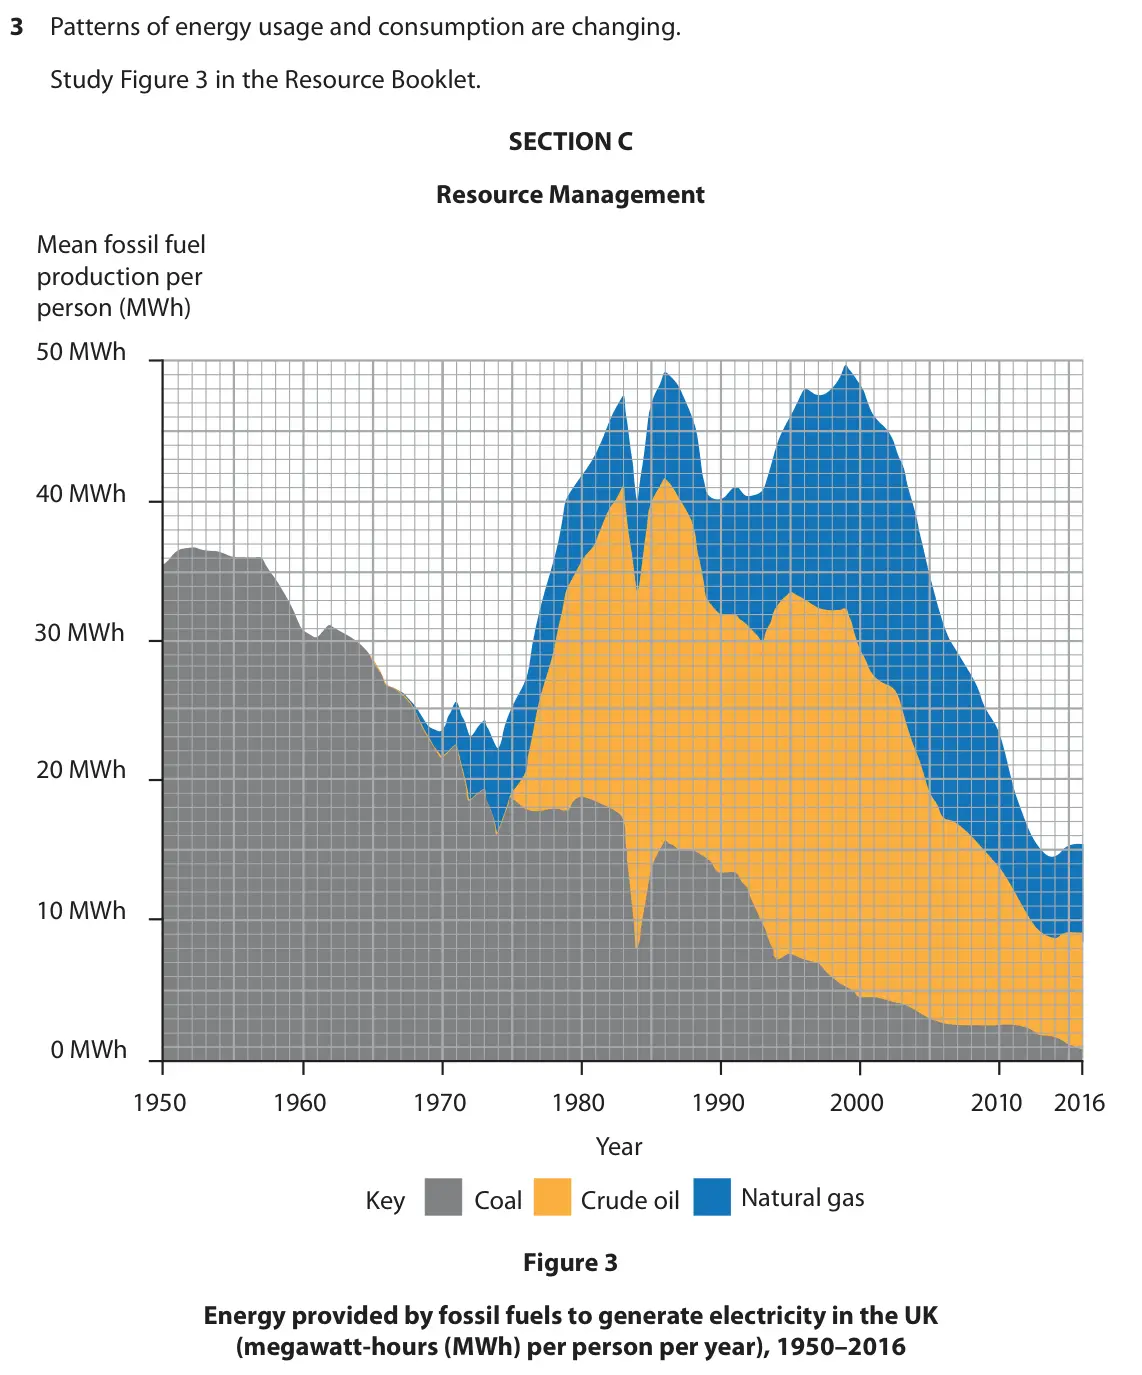 (Total for Question 3 is 1 mark)
Q3(a)(ii)
The whole paper ↗(Total for Question 3 is 1 mark)
Q3(a)(iii)
The whole paper ↗(Total for Question 3 is 2 marks)
Q3(a)(iv)
The whole paper ↗(Total for Question 3 is 3 marks)
Q3(c)(i)
The whole paper ↗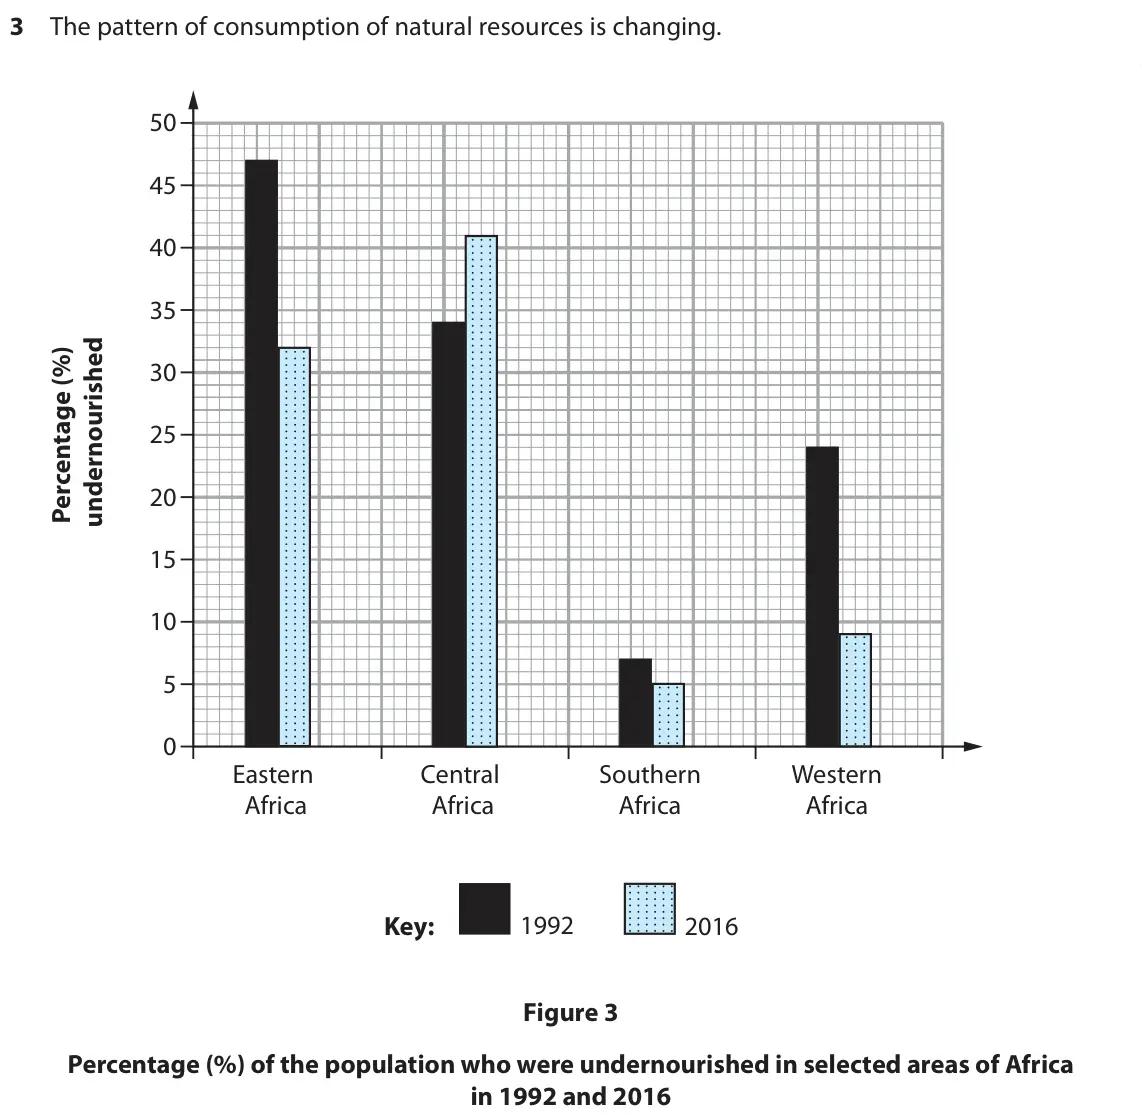 (Total for Question 3 is 1 mark)
Q3(c)(ii)
The whole paper ↗(Total for Question 3 is 1 mark)
Q3(c)(iii)
The whole paper ↗(Total for Question 3 is 2 marks)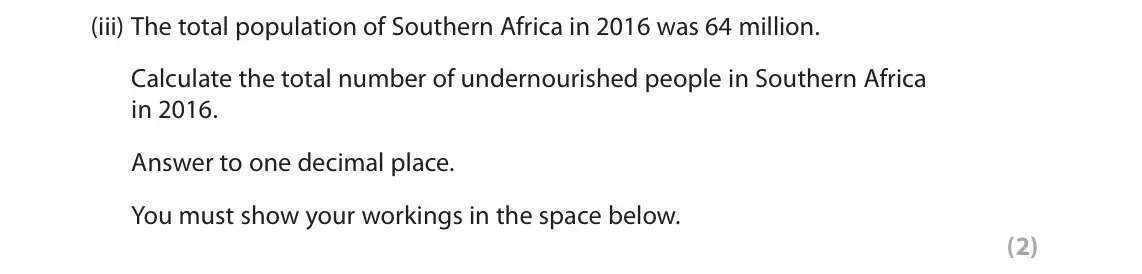
Q3(b)(i)
The whole paper ↗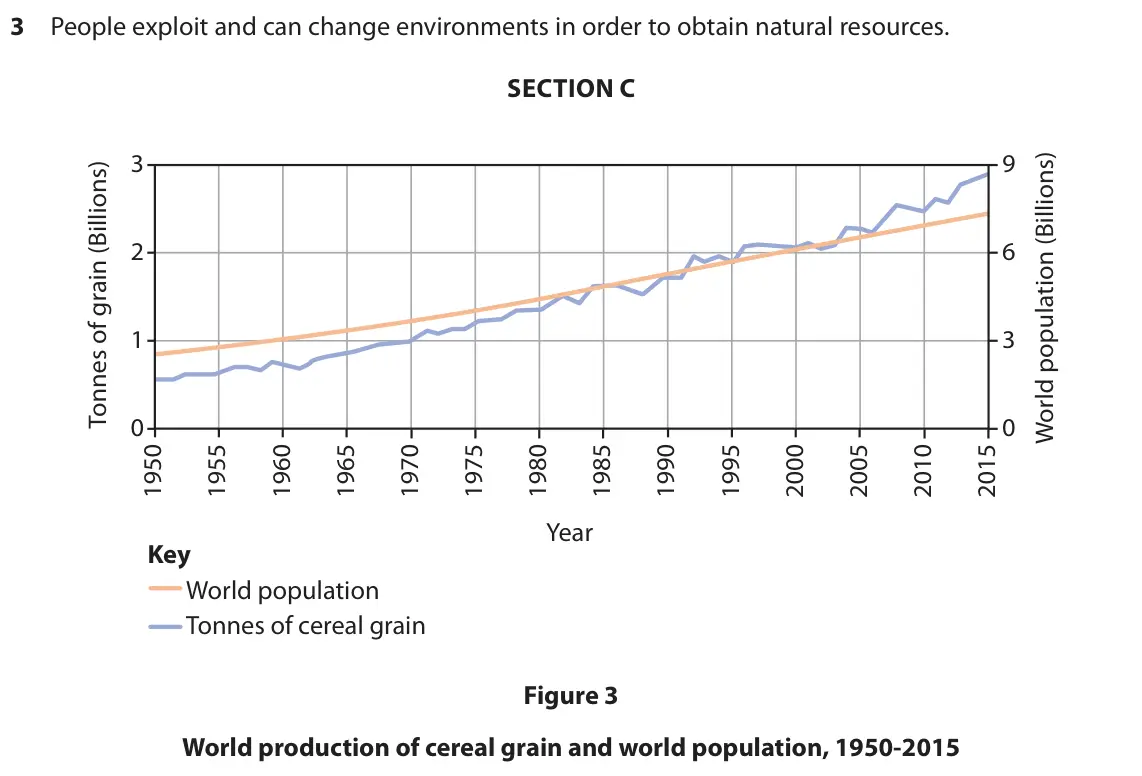 (Total for Question 3 is 2 marks)

All 16 questions on The patterns of the distribution and consumption of natural resources varies on a global and a national scale, as a list
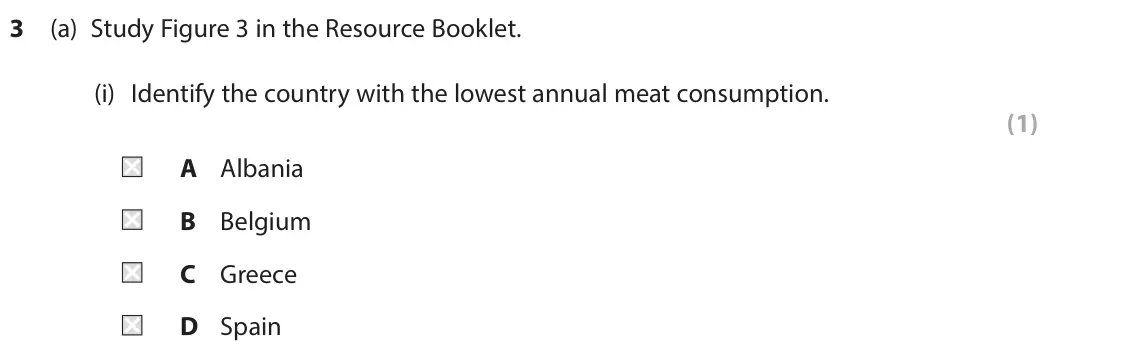
- June 2025, Paper 2, Q3(a)(i) (1 mark): Identify the country with the lowest annual meat consumption. (1) A Albania B Belgium C Greece D Spain Iceland Norway Belgium UK Poland Germany France Portugal
- June 2025, Paper 2, Q3(a)(ii) (1 mark): Identify the number of countries with an annual meat consumption of 86–100 kg per capita. (1) Iceland Norway Belgium UK Poland Germany France Portugal Bulgaria
- June 2025, Paper 2, Q3(a)(iii) (2 marks): Calculate the percentage of the 12 countries labelled on Figure 3 that have a meat consumption of 76–85 kg per capita. You must show your working in the space b
- June 2025, Paper 2, Q3(a)(iv) (2 marks): Describe one limitation of just using Figure 3 to investigate European meat consumption. (2) Iceland Norway Belgium UK Poland Germany France Portugal Bulgaria S
- June 2023, Paper 2, Q3(c) (1 mark): Name one area of the UK where most of the agriculture is arable farming (growing crops). (1) 3 The environment provides natural resources that can be used to me
- June 2022, Paper 2, Q3(c)(i) (1 mark): Name the region with the highest annual meat production in 1961. (1) 3 People obtain natural resources, such as fossil fuels, from the environment. Annual meat
- June 2022, Paper 2, Q3(c)(ii) (2 marks): Describe the overall change in meat production in Asia. Use data in your answer. (2) 3 People obtain natural resources, such as fossil fuels, from the environme
- June 2022, Paper 2, Q3(c)(iii) (3 marks): Suggest one reason for the differences in meat production between Europe and Asia. (3) 3 People obtain natural resources, such as fossil fuels, from the environ
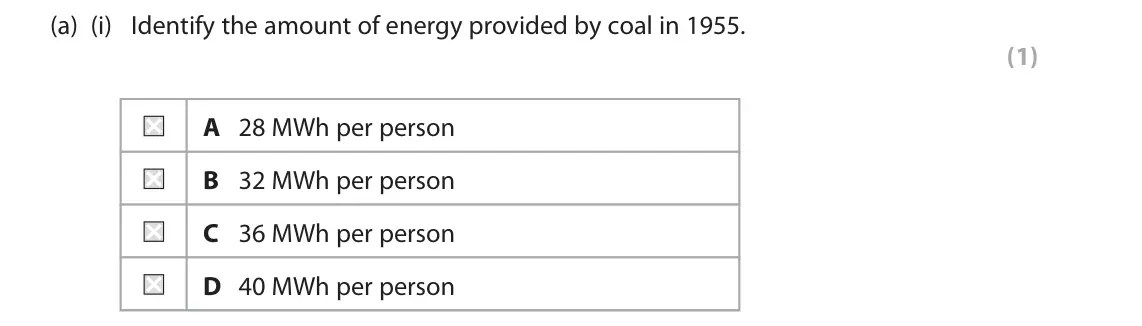
- November 2021, Paper 2, Q3(a)(i) (1 mark): Identify the amount of energy provided by coal in 1955. (1) A 28 MWh per person B 32 MWh per person C 36 MWh per person D 40 MWh per person 3 Patterns of energy
- November 2021, Paper 2, Q3(a)(ii) (1 mark): Identify the amount of energy provided by natural gas in 2000. (1) 3 Patterns of energy usage and consumption are changing. Study Figure 3 in the Resource Bookl
- November 2021, Paper 2, Q3(a)(iii) (2 marks): Calculate the overall decrease in energy provided by fossil fuels between 2000 and 2009. You must show your working in the space below. (2) 3 Patterns of energy
- November 2021, Paper 2, Q3(a)(iv) (3 marks): Describe how the amount of electricity generated by crude oil changed between 1975 and 2016. Use data in your answer. (3) 3 Patterns of energy usage and consump
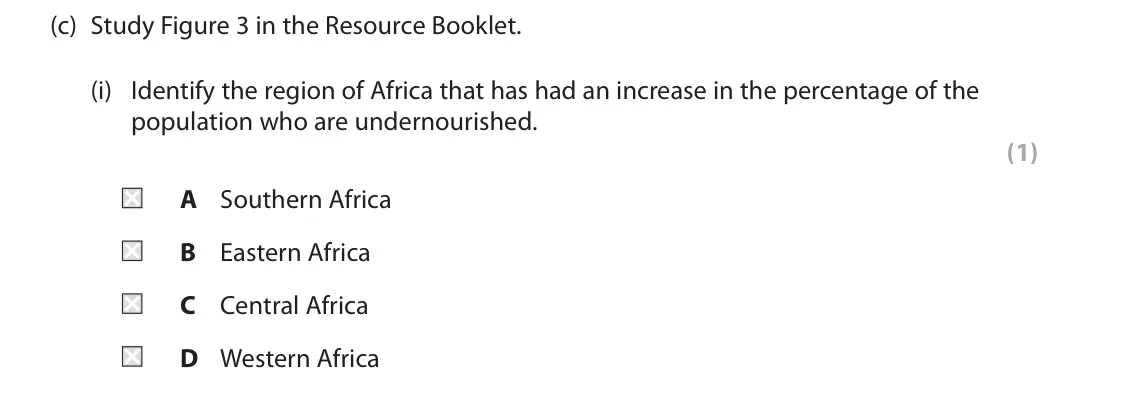
- November 2020, Paper 2, Q3(c)(i) (1 mark): Identify the region of Africa that has had an increase in the percentage of the population who are undernourished. (1) A Southern Africa B Eastern Africa C Cent
- November 2020, Paper 2, Q3(c)(ii) (1 mark): Calculate the range of the percentage of the population who were undernourished in 2016. (1) 3 The pattern of consumption of natural resources is changing. 50 4
- November 2020, Paper 2, Q3(c)(iii) (2 marks): The total population of Southern Africa in 2016 was 64 million. Calculate the total number of undernourished people in Southern Africa in 2016. Answer to one de
- June 2019, Paper 2, Q3(b)(i) (2 marks): Compare the trends shown in Figure 3. (2) 3 People exploit and can change environments in order to obtain natural resources. SECTION C 3 9 2 6 1 3 0 0 Year Key
Questions, mark schemes and examiner’s reports are © Pearson Edexcel, from their published past papers. Plumi isn’t affiliated with any exam board. Want whole papers? Edexcel GCSE Geography A past papers.
The Plumi iPad app also offers exam-style questions with AI feedback on your handwritten working.