 plumi
Definitions of development vary as do attempts to measure it: Edexcel GCSE Geography A questions
Edexcel GCSE Geography A past-paper questions on 5.1 Definitions of development vary as do attempts to measure it, 2018–2025, with mark schemes and examiner’s reports where available.
Paper
All papers
Exam
All years
Calculations
Loading the full question list…
Q2(b)
The whole paper ↗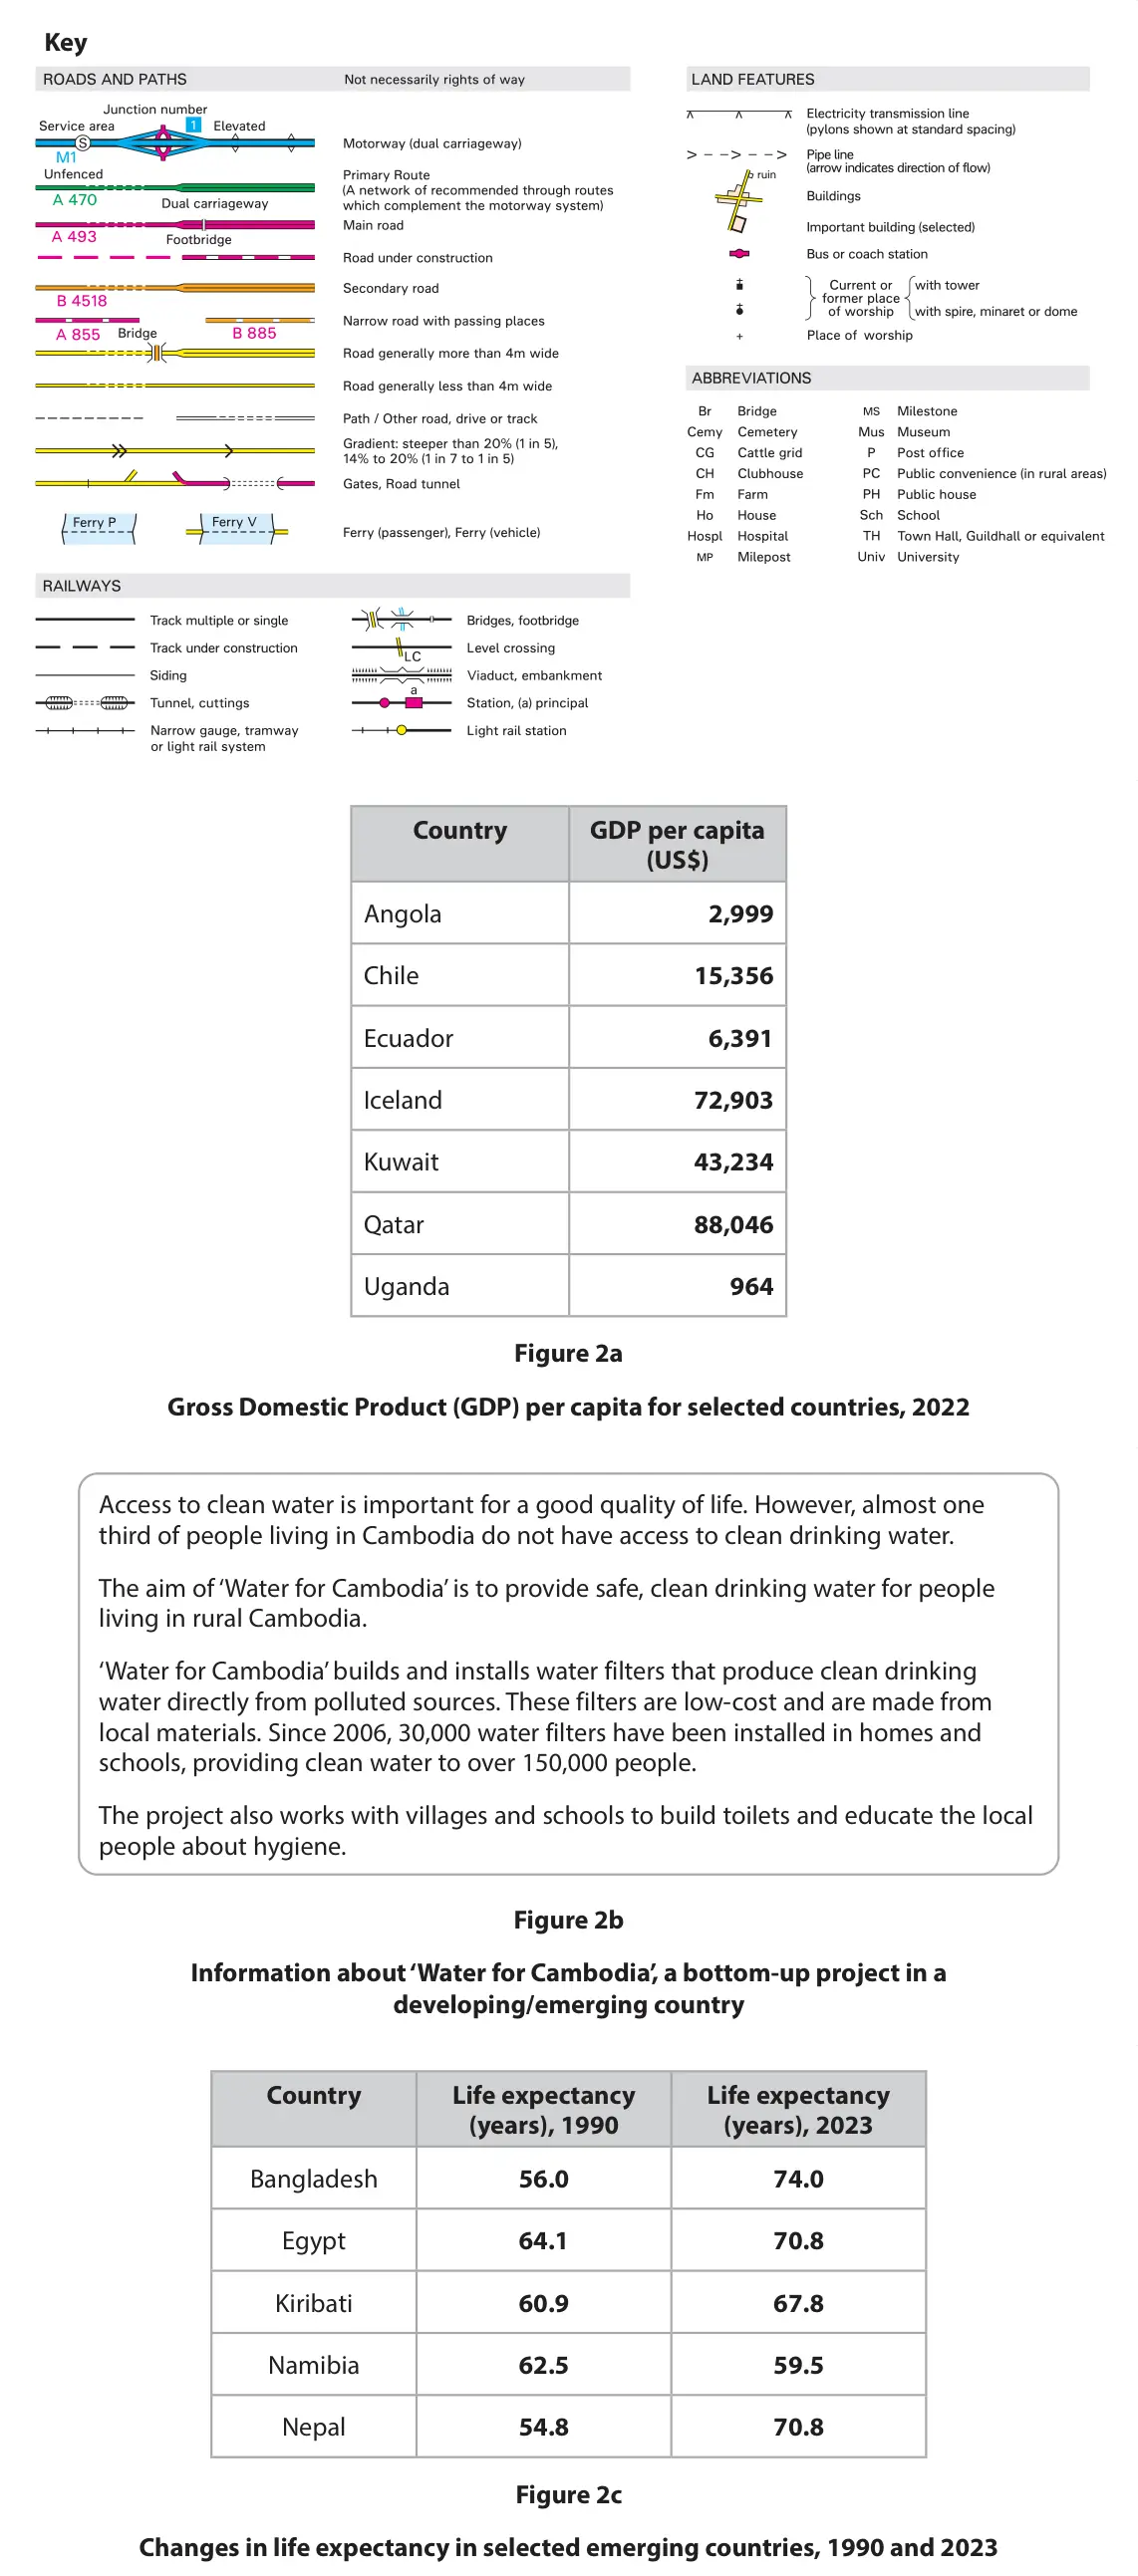 (Total for Question 2 is 2 marks)

Q2(c)(i)
The whole paper ↗(Total for Question 2 is 1 mark)
Q2(f)(i)
The whole paper ↗(Total for Question 2 is 1 mark)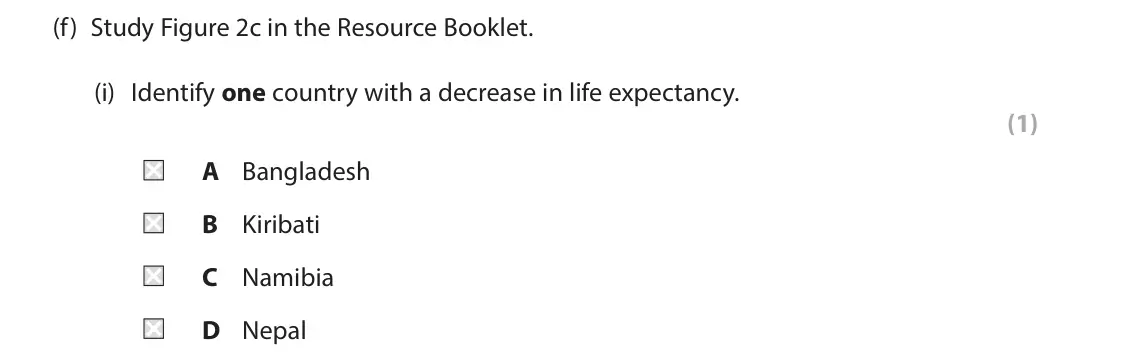
Q2(f)(ii)
The whole paper ↗(Total for Question 2 is 2 marks)
Q2(b)(i)
The whole paper ↗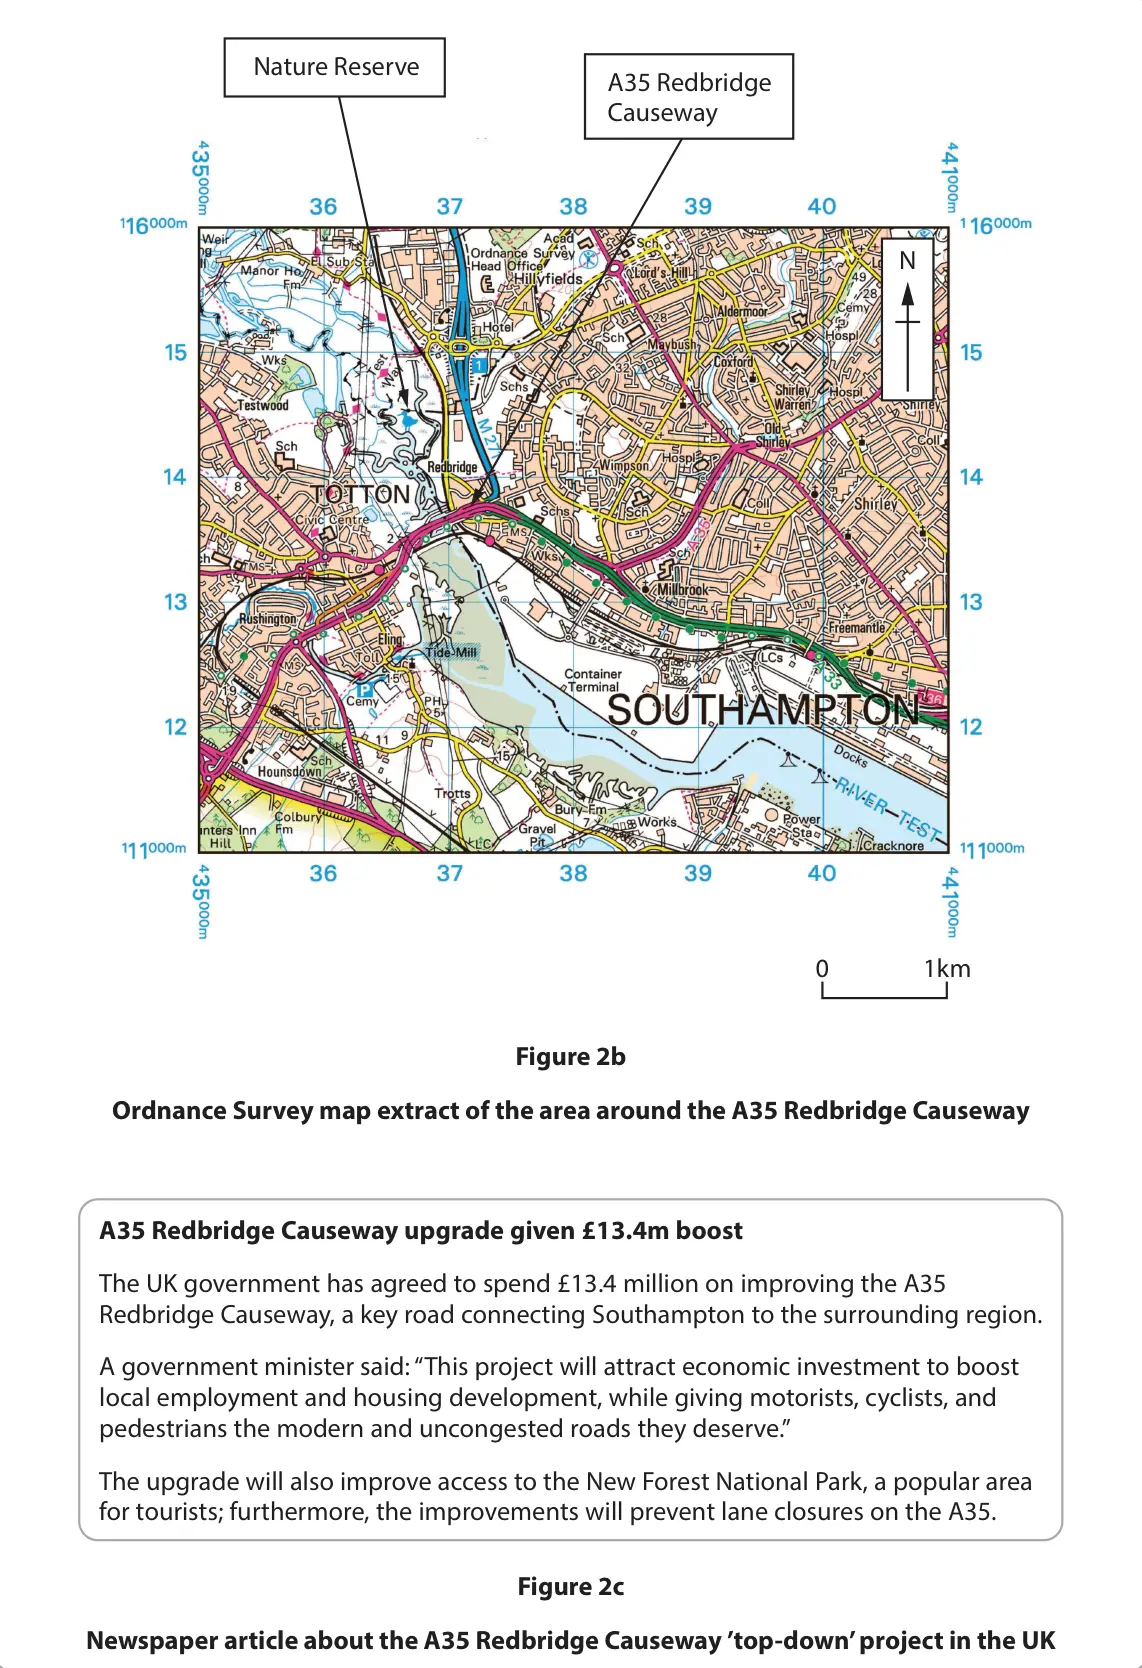 (Total for Question 2 is 1 mark)
Q2(b)(ii)
The whole paper ↗(Total for Question 2 is 1 mark)
Q2(b)(iii)
The whole paper ↗(Total for Question 2 is 2 marks)
Q2(b)(iv)
The whole paper ↗(Total for Question 2 is 2 marks)
Q2(c)
The whole paper ↗(Total for Question 2 is 2 marks)
Q2(d)(i)
The whole paper ↗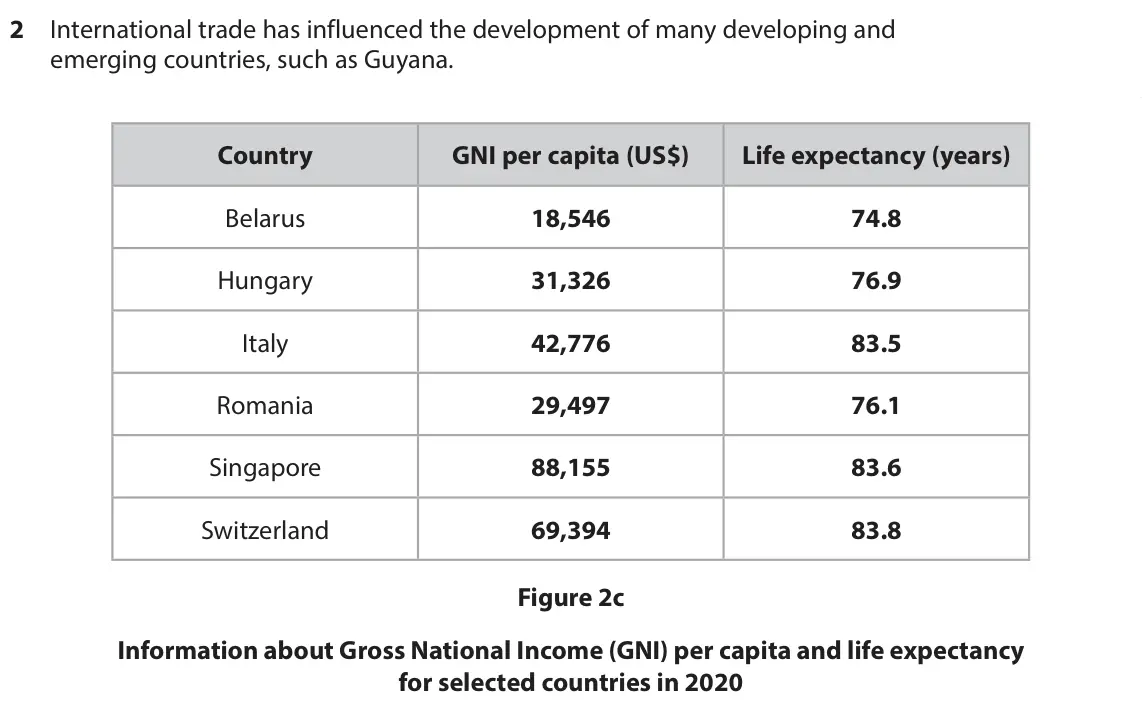 (Total for Question 2 is 2 marks)
Q2(d)(ii)
The whole paper ↗(Total for Question 2 is 3 marks)
Q2(d)(iv)
The whole paper ↗(Total for Question 2 is 1 mark)
Q2(a)(i)
The whole paper ↗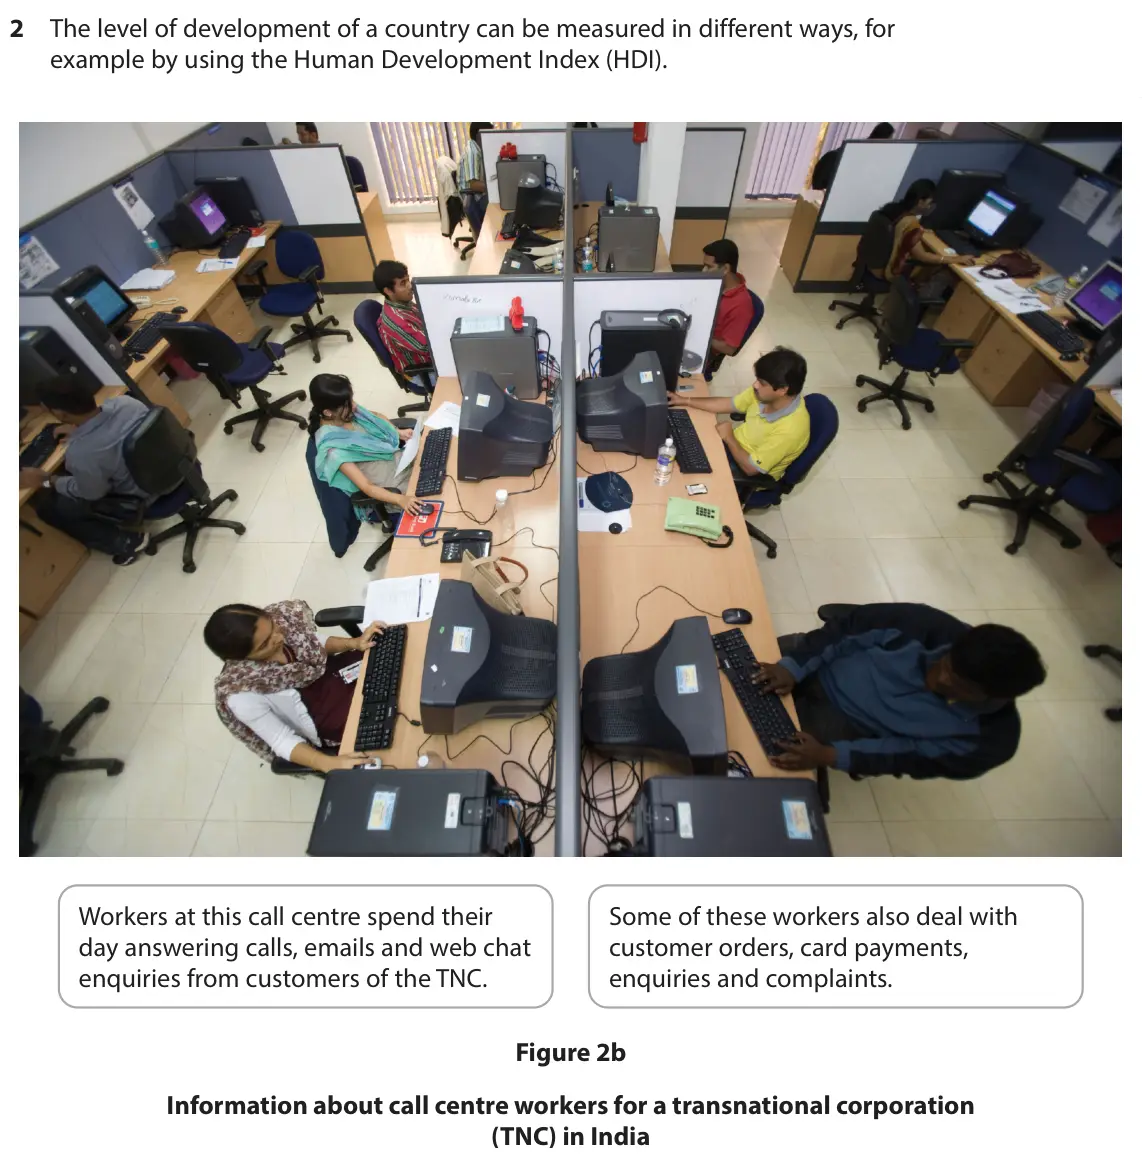 (Total for Question 2 is 2 marks)
Q2(a)(ii)
The whole paper ↗(Total for Question 2 is 1 mark)
Q2(a)(iii)
The whole paper ↗(Total for Question 2 is 2 marks)
Q2(a)(v)
The whole paper ↗(Total for Question 2 is 1 mark)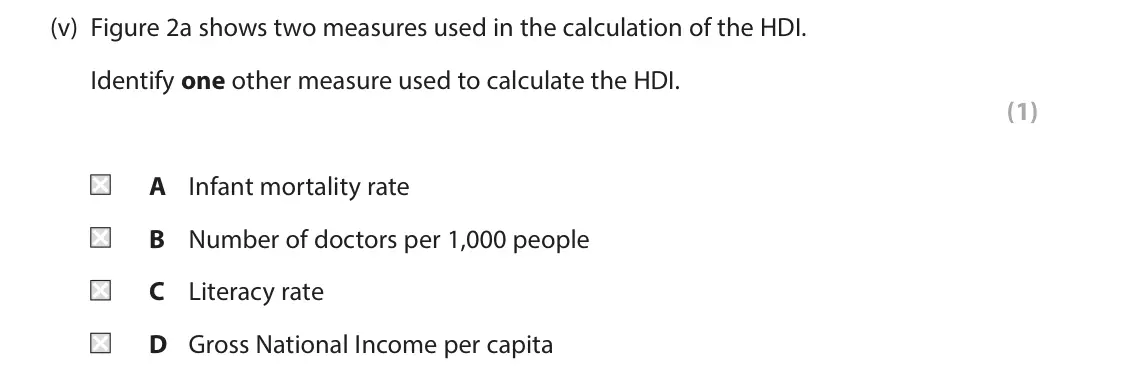
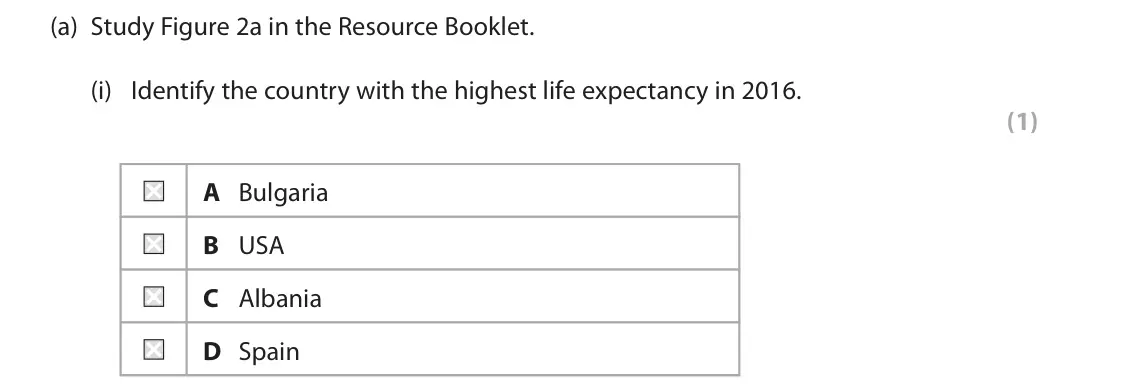
Q2(a)(i)
The whole paper ↗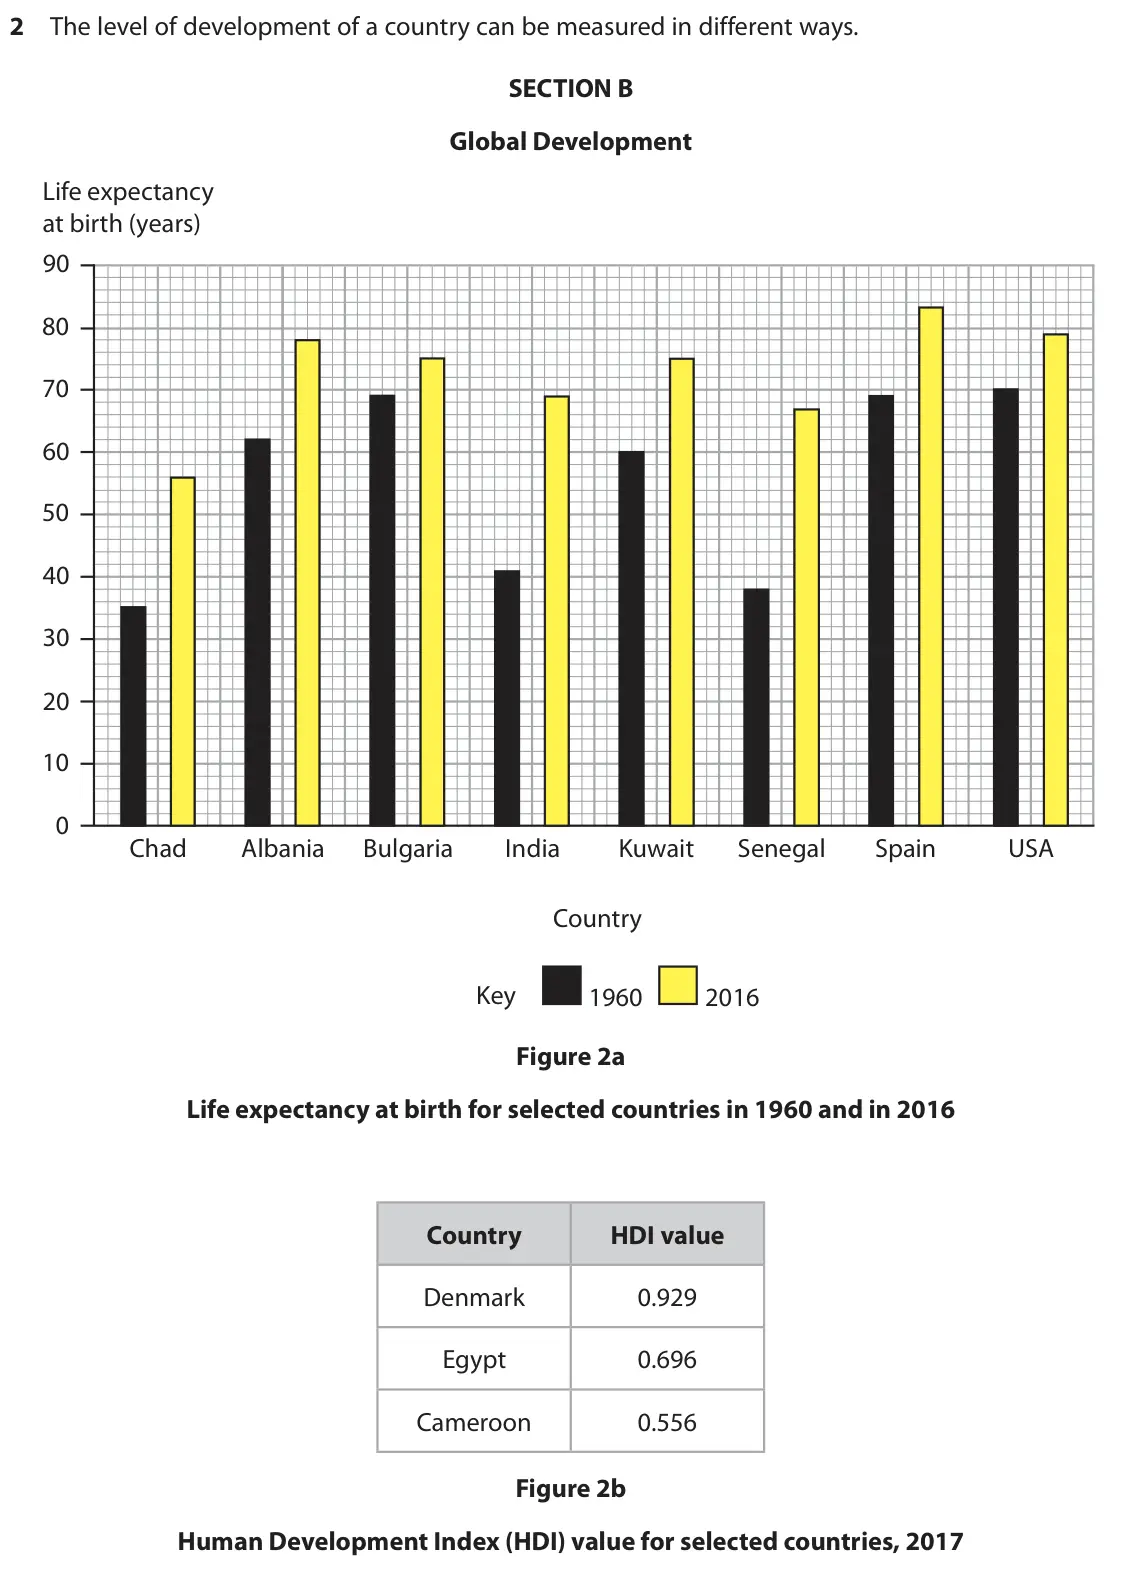 (Total for Question 2 is 1 mark)
Q2(a)(ii)
The whole paper ↗(Total for Question 2 is 1 mark)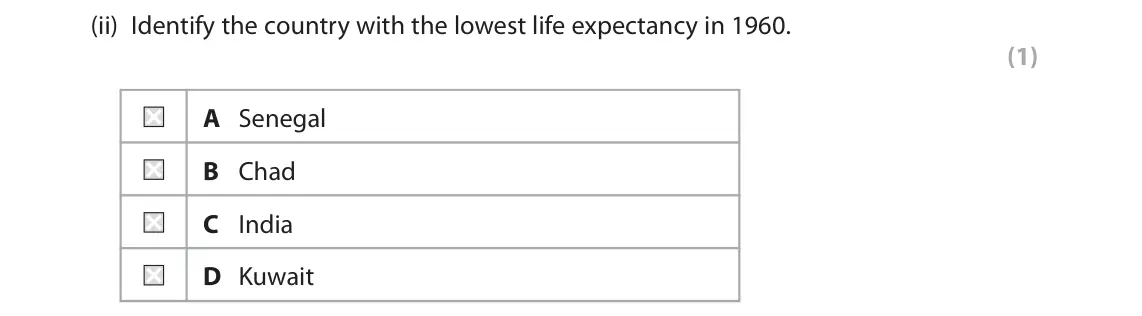
Q2(a)(iii)
The whole paper ↗(Total for Question 2 is 2 marks)
Q2(a)(iv)
The whole paper ↗(Total for Question 2 is 2 marks)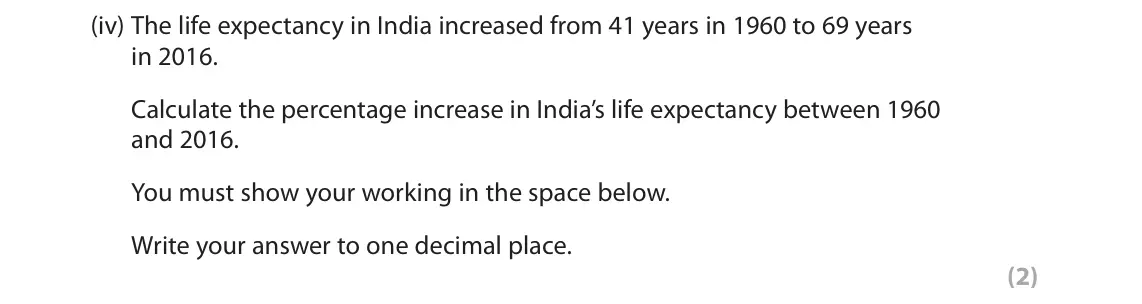
All 31 questions on Definitions of development vary as do attempts to measure it, as a list
- June 2025, Paper 2, Q2(b) (2 marks): Describe one index used to measure political corruption. (2) Key Country GDP per capita (US$) Angola 2,999 Chile 15,356 6,391 Ecuador Iceland 72,903 Kuwait 43,2
- June 2025, Paper 2, Q2(c)(i) (1 mark): Calculate the median value for GDP per capita shown in Figure 2a. (1) Key Country GDP per capita (US$) Angola 2,999 Chile 15,356 6,391 Ecuador Iceland 72,903 Ku
- June 2025, Paper 2, Q2(f)(i) (1 mark): Identify one country with a decrease in life expectancy. (1) A Bangladesh B Kiribati C Namibia D Nepal Key Country GDP per capita (US$) Angola 2,999 Chile 15,35
- June 2025, Paper 2, Q2(f)(ii) (2 marks): Calculate the percentage increase in Egypt’s life expectancy between 1990 and 2023. Write your answer to the nearest whole number. You must show your working in
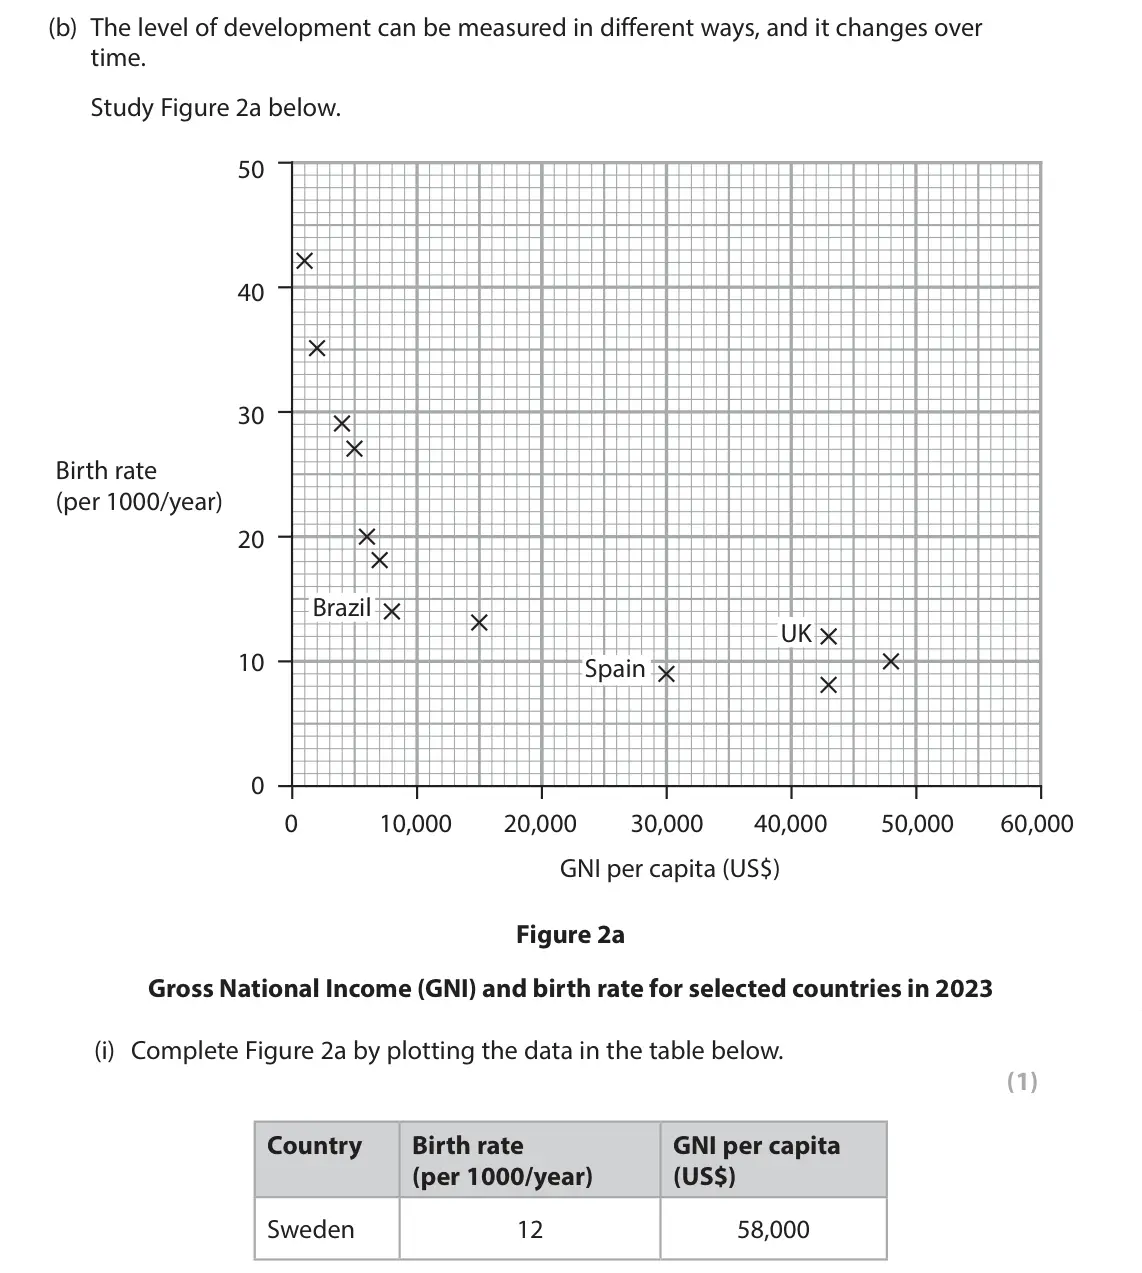
- June 2024, Paper 2, Q2(b)(i) (1 mark): Complete Figure 2a by plotting the data in the table below. (1) Country Birth rate GNI per capita (per 1000/year) (US$) Sweden 12 58,000 Nature Reserve A35 Redb
- June 2024, Paper 2, Q2(b)(ii) (1 mark): State the GNI per capita of Spain shown on Figure 2a. (1) Nature Reserve A35 Redbridge Causeway N 0 1km Figure 2b Ordnance Survey map extract of the area around
- June 2024, Paper 2, Q2(b)(iii) (2 marks): Compare the GNI per capita for the UK and Brazil shown in Figure 2a. Use data in your answer. (2) Nature Reserve A35 Redbridge Causeway N 0 1km Figure 2b Ordnan
- June 2024, Paper 2, Q2(b)(iv) (2 marks): Calculate the mean birth rate for the countries with a GNI per capita between 40,000 and 50,000 US$. Write your answer to the nearest whole number. You must sho
- June 2024, Paper 2, Q2(c) (2 marks): Explain one way a lack of food security can limit a country’s rate of development. (2) Nature Reserve A35 Redbridge Causeway N 0 1km Figure 2b Ordnance Survey m
- June 2023, Paper 2, Q2(d)(i) (2 marks): Calculate the mean life expectancy for the countries shown on Figure 2c. Write your answer to one decimal place. You must show your working in the space below.
- June 2023, Paper 2, Q2(d)(ii) (3 marks): Describe the relationship between GNI per capita and life expectancy shown in Figure 2c. (3) 2 International trade has influenced the development of many develo
- June 2023, Paper 2, Q2(d)(iv) (1 mark): Figure 2c includes two measures used to calculate the Human Development Index (HDI) for a country. State one other measure used in the calculation of the HDI. (
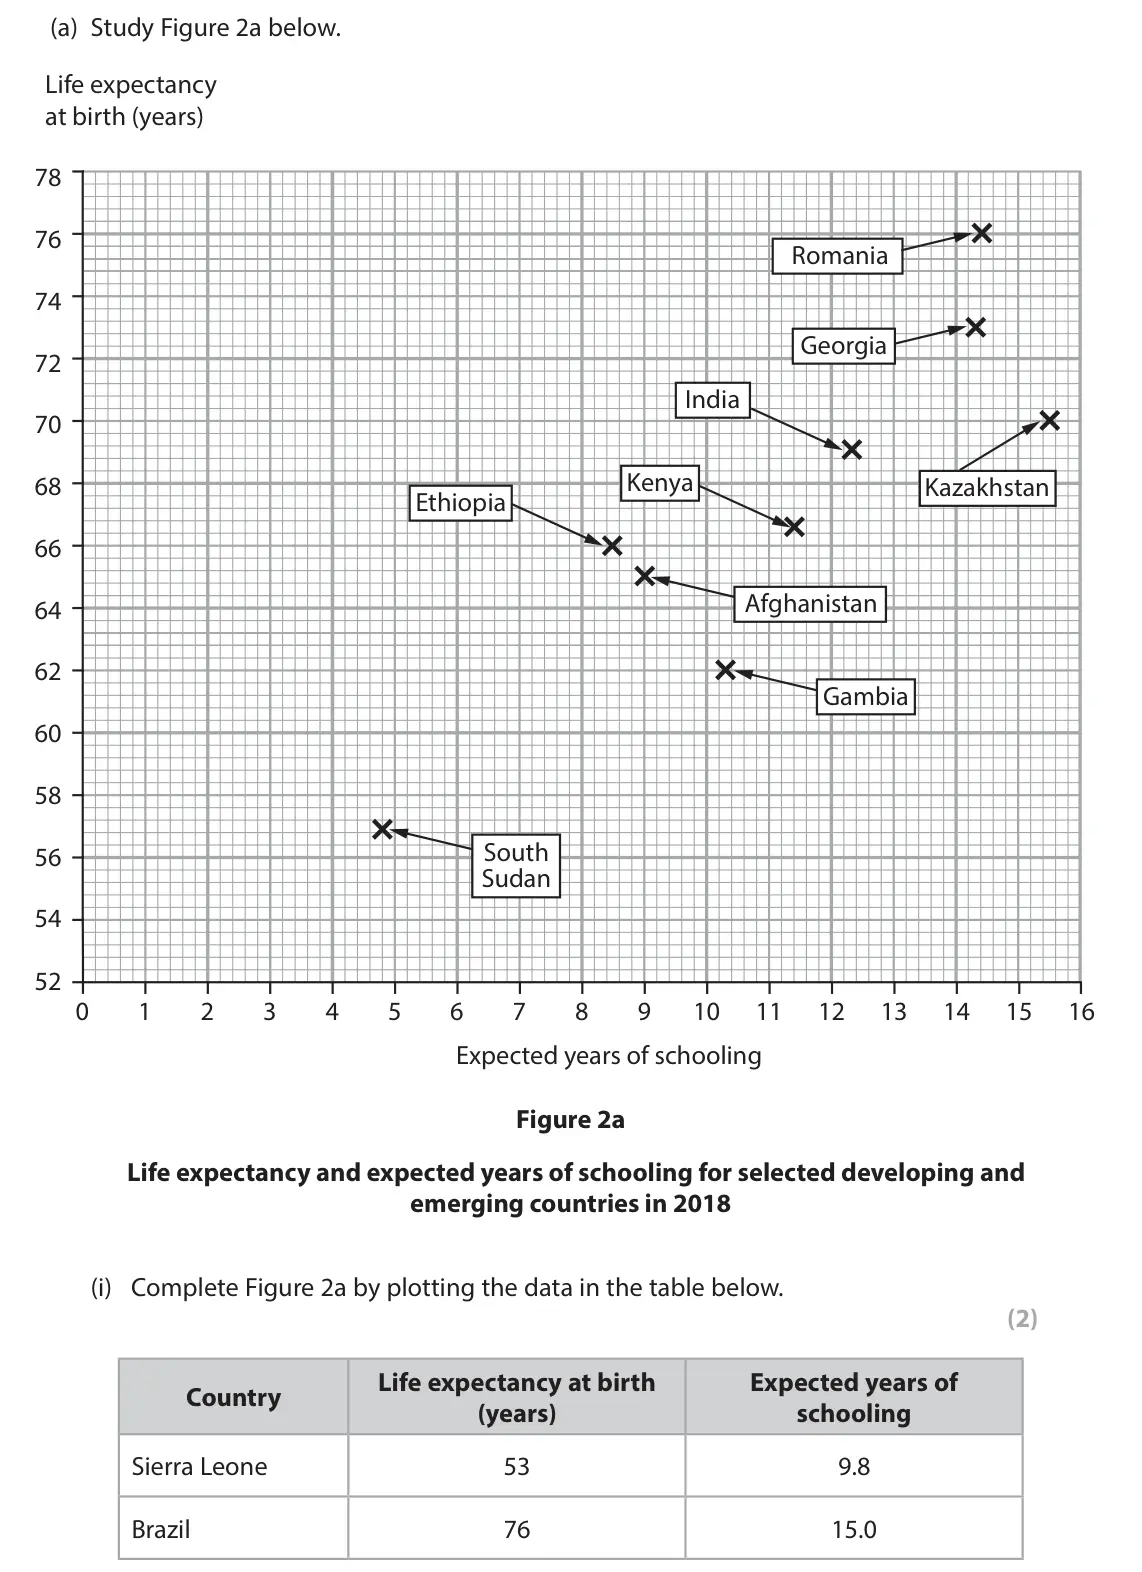
- June 2022, Paper 2, Q2(a)(i) (2 marks): Complete Figure 2a by plotting the data in the table below. (2) Life expectancy at birth Expected years of Country (years) schooling Sierra Leone 53 9.8 Brazil
- June 2022, Paper 2, Q2(a)(ii) (1 mark): Draw a best fit line on Figure 2a. (1) 2 The level of development of a country can be measured in different ways, for example by using the Human Development Ind
- June 2022, Paper 2, Q2(a)(iii) (2 marks): Describe the relationship shown in Figure 2a. Use data in your answer. (2) 2 The level of development of a country can be measured in different ways, for exampl
- June 2022, Paper 2, Q2(a)(v) (1 mark): Figure 2a shows two measures used in the calculation of the HDI. Identify one other measure used to calculate the HDI. (1) A Infant mortality rate B Number of d
- November 2021, Paper 2, Q2(a)(i) (1 mark): Identify the country with the highest life expectancy in 2016. (1) A Bulgaria B USA C Albania D Spain 2 The level of development of a country can be measured in
- November 2021, Paper 2, Q2(a)(ii) (1 mark): Identify the country with the lowest life expectancy in 1960. (1) A Senegal B Chad C India D Kuwait 2 The level of development of a country can be measured in d
- November 2021, Paper 2, Q2(a)(iii) (2 marks): Describe the change in Kuwait’s life expectancy shown in Figure 2a. (2) 2 The level of development of a country can be measured in different ways. SECTION B Glo
- November 2021, Paper 2, Q2(a)(iv) (2 marks): The life expectancy in India increased from 41 years in 1960 to 69 years in 2016. Calculate the percentage increase in India’s life expectancy between 1960 and
- November 2021, Paper 2, Q2(b)(i) (2 marks): Identify which two statements are likely to be true. (2) A The mean years of schooling will be highest in Egypt B Life expectancy is higher in Denmark than in E
- November 2021, Paper 2, Q2(b)(ii) (2 marks): HDI includes measures of life expectancy, gross national income per capita and mean years of schooling. Describe one other way in which development could be mea
- November 2020, Paper 2, Q2(a)(i) (1 mark): Identify the country with the highest HDI score in 2015. (1) A Cuba B Singapore C Slovakia D UK 2 The level of development varies around the world due to a comb
- November 2020, Paper 2, Q2(a)(ii) (2 marks): Describe the trend of Zimbabwe’s HDI score between 1990 and 2015. (2) 2 The level of development varies around the world due to a combination of factors. 0.900
- November 2020, Paper 2, Q2(a)(iii) (4 marks): Suggest two reasons for the change in Cuba’s HDI score between 1990 and 2010. (4) 2 The level of development varies around the world due to a combination of fac
- November 2020, Paper 2, Q2(a)(iv) (2 marks): State two limitations of just using Figure 2a to investigate changes in global HDI scores over time. (2) 2 The level of development varies around the world due
- June 2019, Paper 2, Q2(a)(i) (2 marks): Identify two measures used in the calculation of the HDI score. (2) A infant mortality rate B life expectancy C access to clean water D birth rate E mean years
- June 2019, Paper 2, Q2(a)(ii) (1 mark): Identify the HDI score for emerging countries. (1) A 0.299 or lower B Between 0.300 and 0.549 C Between 0.550 and 0.799 D 0.800 or higher 2 Levels of developmen
- June 2018, Paper 2, Q2(a) (1 mark): Name one indicator used in the calculation of the Human Development Index (HDI). (1) 2 Levels of development are different around the world due to a combination
- June 2018, Paper 2, Q2(d)(i) (1 mark): Identify the two countries with the highest GDP per capita. (1) A Morocco and Kenya B France and Qatar C Qatar and Spain D Kenya and Thailand 2 Levels of develo
- June 2018, Paper 2, Q2(d)(ii) (1 mark): Calculate the median GDP per capita for the countries shown on Figure 2b. (1) 2 Levels of development are different around the world due to a combination of phy
Questions, mark schemes and examiner’s reports are © Pearson Edexcel, from their published past papers. Plumi isn’t affiliated with any exam board. Want whole papers? Edexcel GCSE Geography A past papers.
The Plumi iPad app also offers exam-style questions with AI feedback on your handwritten working.