Skip to content
Android waitlistTry on iPad
Get started

Definite integration and area: Edexcel A‑Level Maths questions

Edexcel A-Level Maths past-paper questions on Definite integration and area, 2008–2025, with mark schemes and examiner’s reports where available. Add MadAsMaths questions to your practice, or browse them separately by topic and difficulty.

Questions from
Specification

Previous-specification questions for extra practice. Content and exam requirements may differ from your current course.

Past paper difficulty
Paper
All papers
Exam
All years

Loading the full question list…

1,612 questions

  1. Q9

    June 2018 · Legacy C2 · ★★★★★

    The whole paper ↗
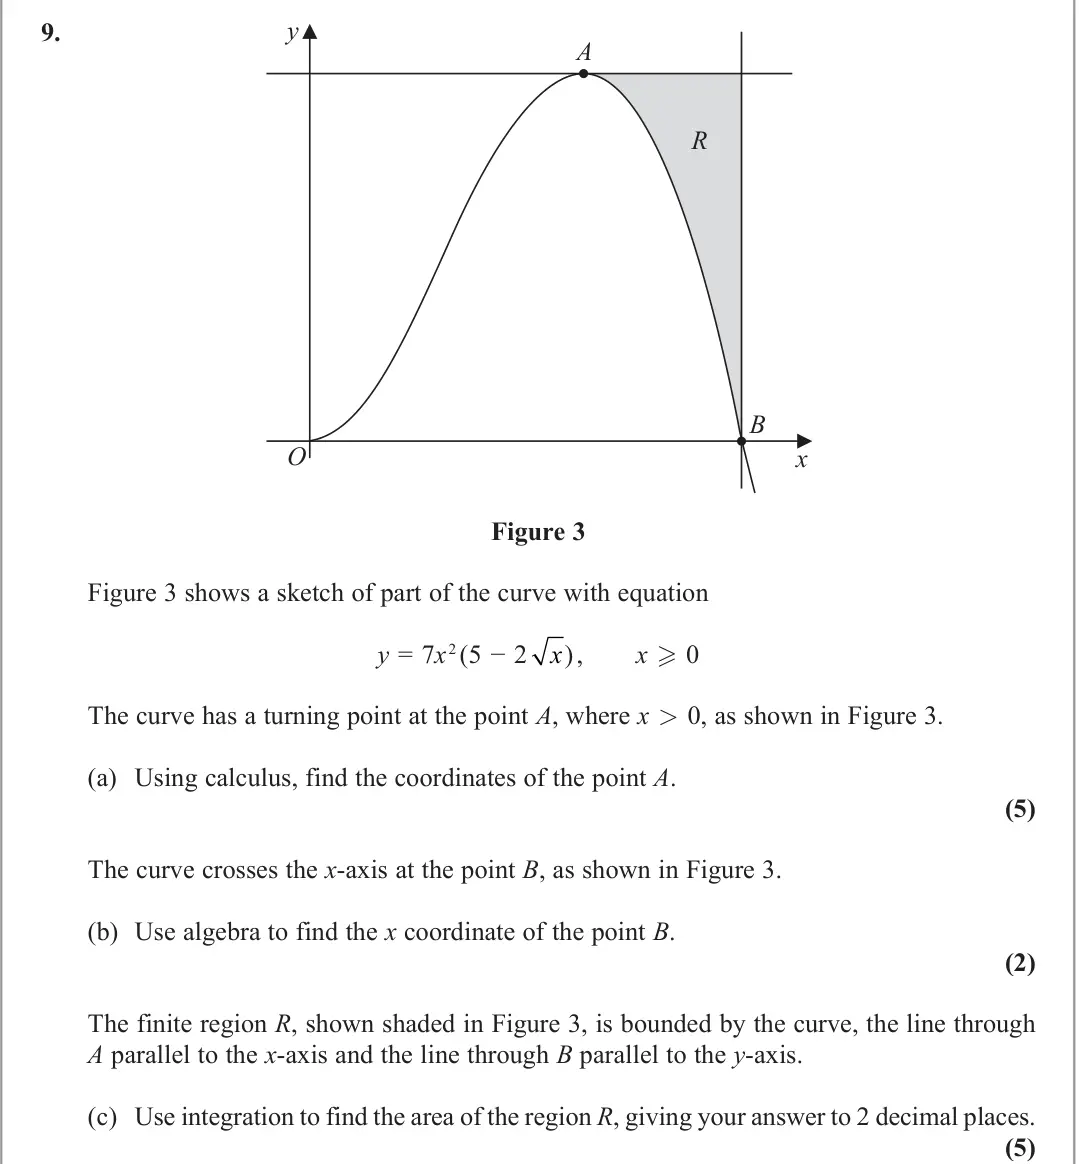
    Original question 9: y x O A R B Figure 3 Figure 3 shows a sketch of part of the curve with equation y = 7x 2 (5 − 2 x) , x  0 The curve has a turning point at the point A, where x

    Loading the question…

    (Total for Question 9 is 12 marks)
  2. Q10

    June 2017 · Legacy C2 · ★★★★

    The whole paper ↗
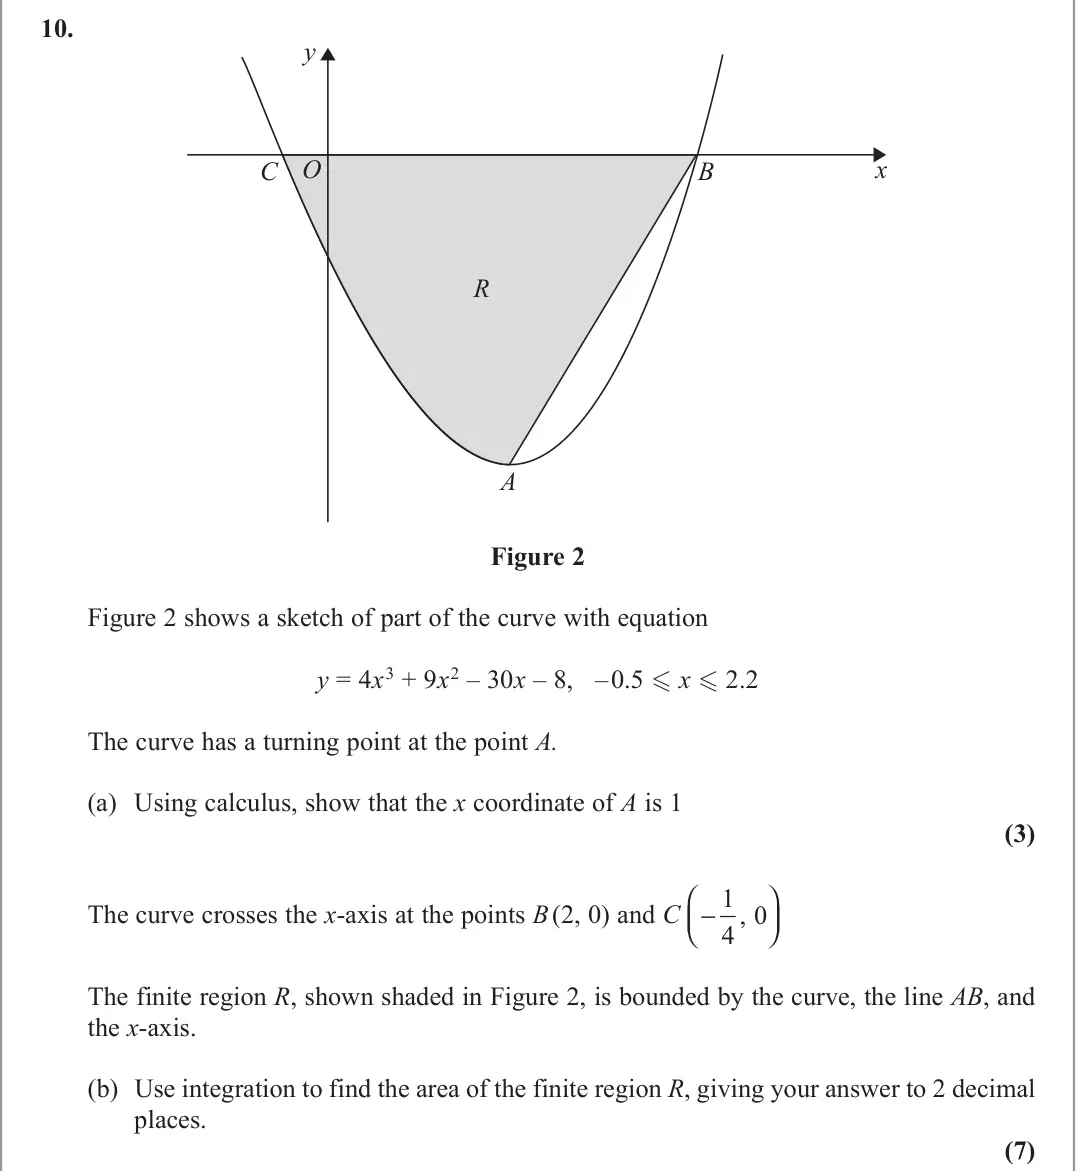
    Original question 10: A B C O R y x Figure 2 Figure 2 shows a sketch of part of the curve with equation y = 4x3 + 9x2 – 30x – 8, –0.5 - x - 2.2 The curve has a turning point at the p

    Loading the question…

    (Total for Question 10 is 10 marks)
  3. Q7

    June 2016 · Legacy C2 · ★★★

    The whole paper ↗
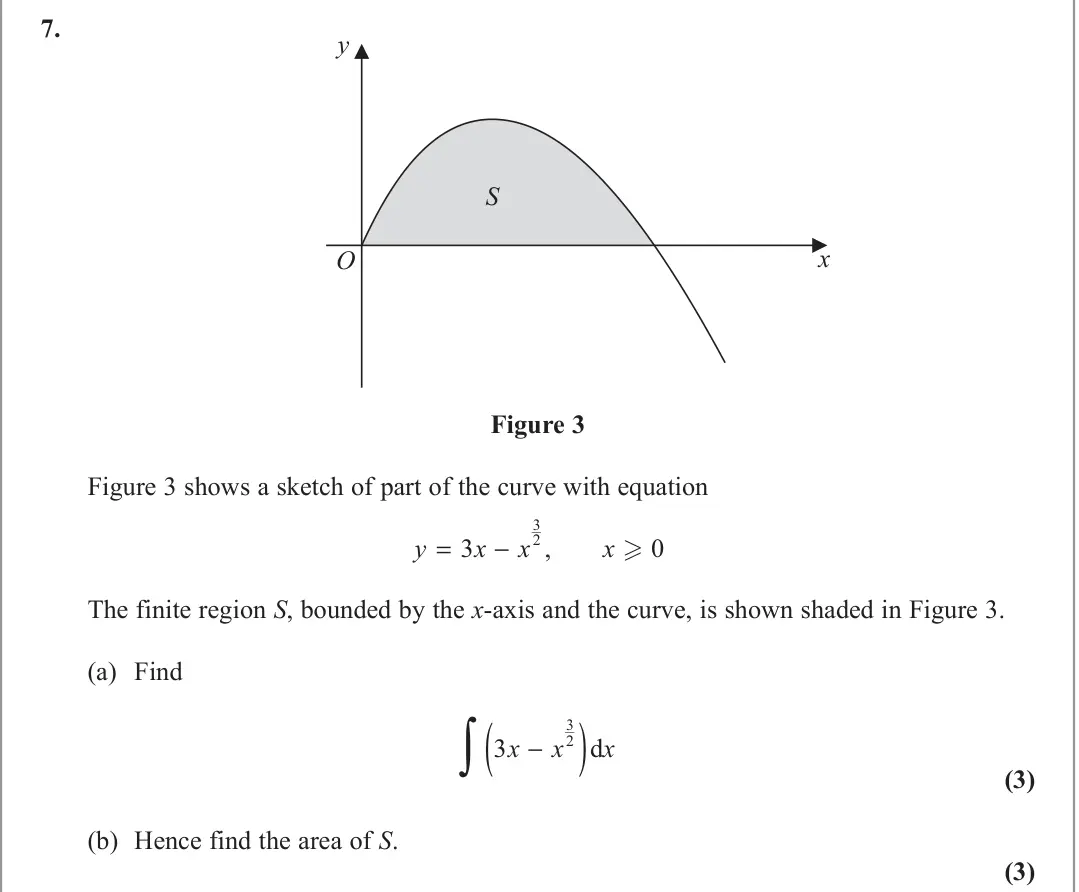
    Original question 7: Figure 3 Figure 3 shows a sketch of part of the curve with equation y x x x = − 3 0 3 2, . The finite region S, bounded by the x-axis and the curve, is shown sh

    Loading the question…

    (Total for Question 7 is 6 marks)
  4. Q6

    June 2015 · Legacy C2 · ★★★★

    The whole paper ↗
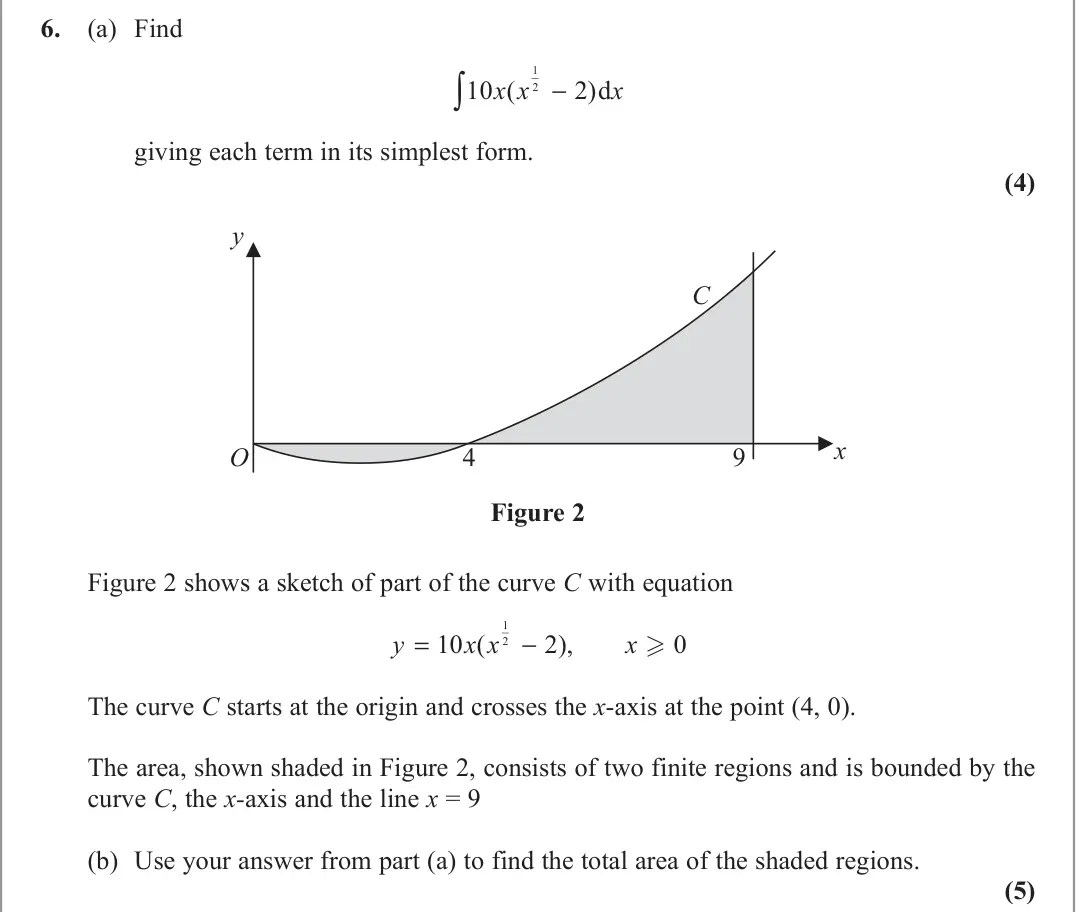
    Original question 6: (a) Find 10 2 1 2 x x ( ) ∫ − dx giving each term in its simplest form. (4) Figure 2 Figure 2 shows a sketch of part of the curve C with equation y x x x = − 10

    Loading the question…

    (Total for Question 6 is 9 marks)
  5. Q4

    June 2014 · Legacy C2 · ★★★

    The whole paper ↗
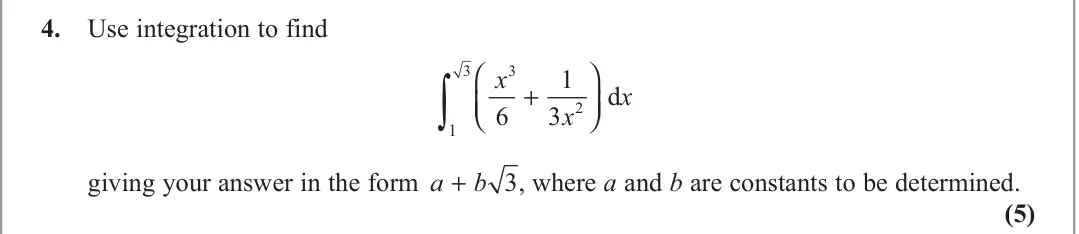
    Original question 4: Use integration to find œ1 3 3 2 6 1 3 x x x + ⎛ ⎝⎜ ⎞ ⎠⎟ d giving your answer in the form a b + 3, where a and b are constants to be determined. (5)

    Loading the question…

    (Total for Question 4 is 5 marks)
  6. Q6

    June 2014 · Legacy C2 (01R) · ★★★

    The whole paper ↗
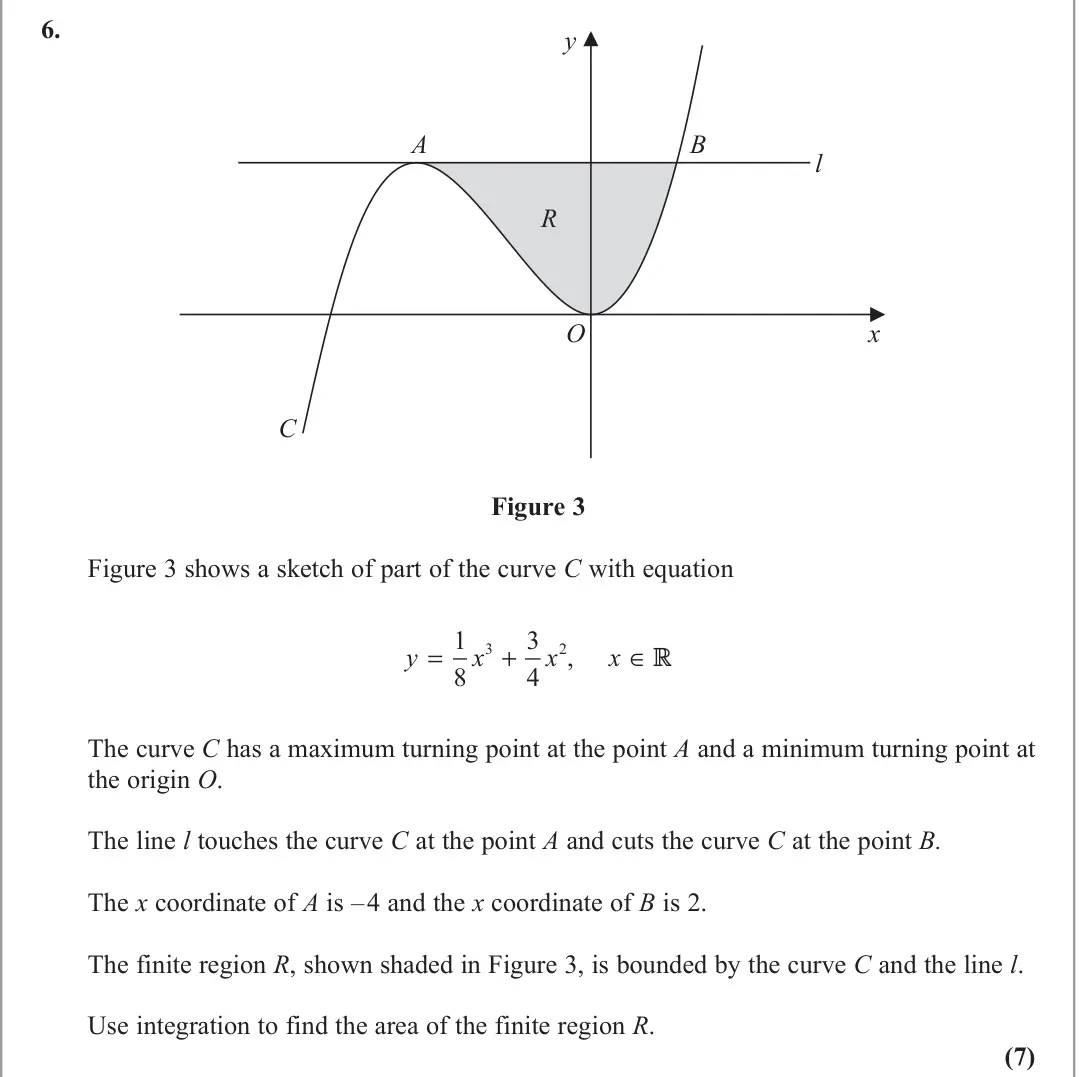
    Original question 6: Figure 3 Figure 3 shows a sketch of part of the curve C with equation y x x x = + ∈ 1 8 3 4 3 2, The curve C has a maximum turning point at the point A and a mi

    Loading the question…

    (Total for Question 6 is 7 marks)
  7. Q6

    June 2013 · Legacy C2 · ★★★★

    The whole paper ↗
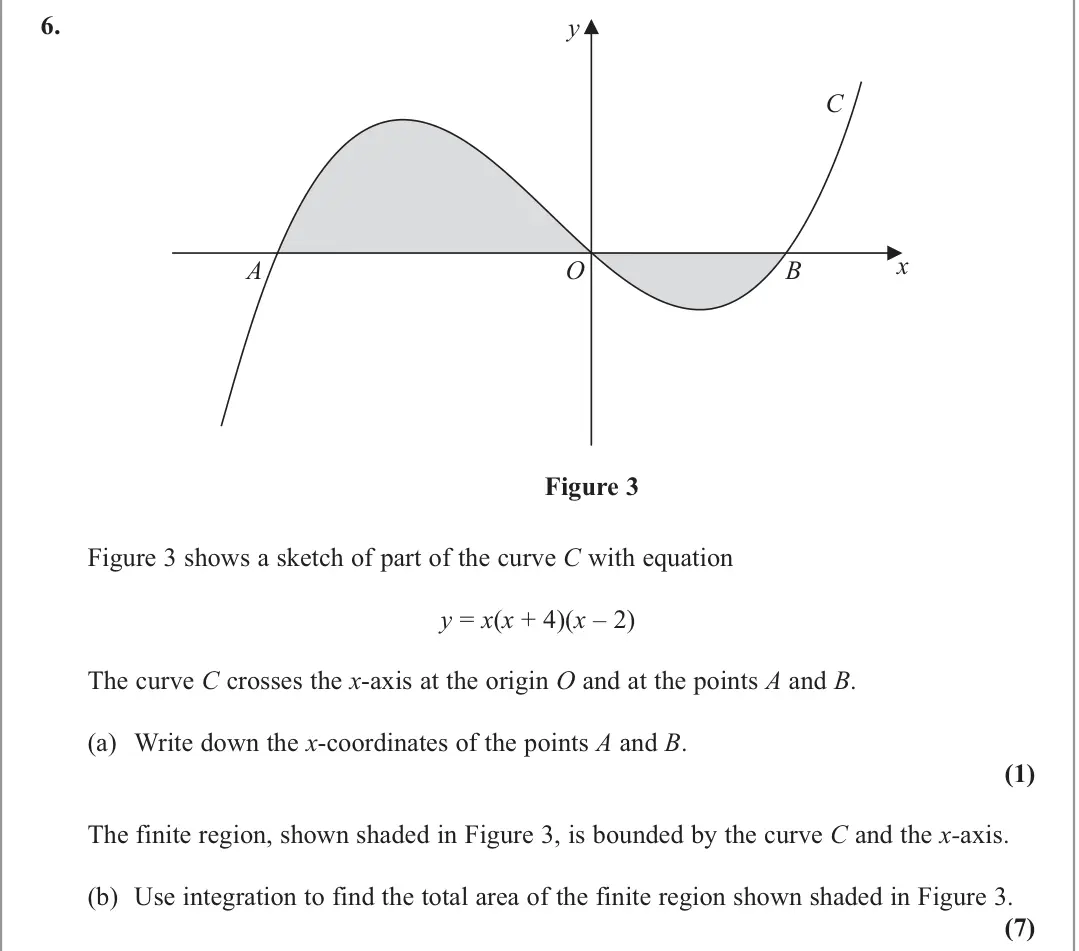
    Original question 6: Figure 3 shows a sketch of part of the curve C with equation y = x(x + 4)(x – 2) The curve C crosses the x-axis at the origin O and at the points A and B. (a) W

    Loading the question…

    (Total for Question 6 is 8 marks)
  8. Q7

    June 2013 · Legacy C2 (01R) · ★★★★

    The whole paper ↗
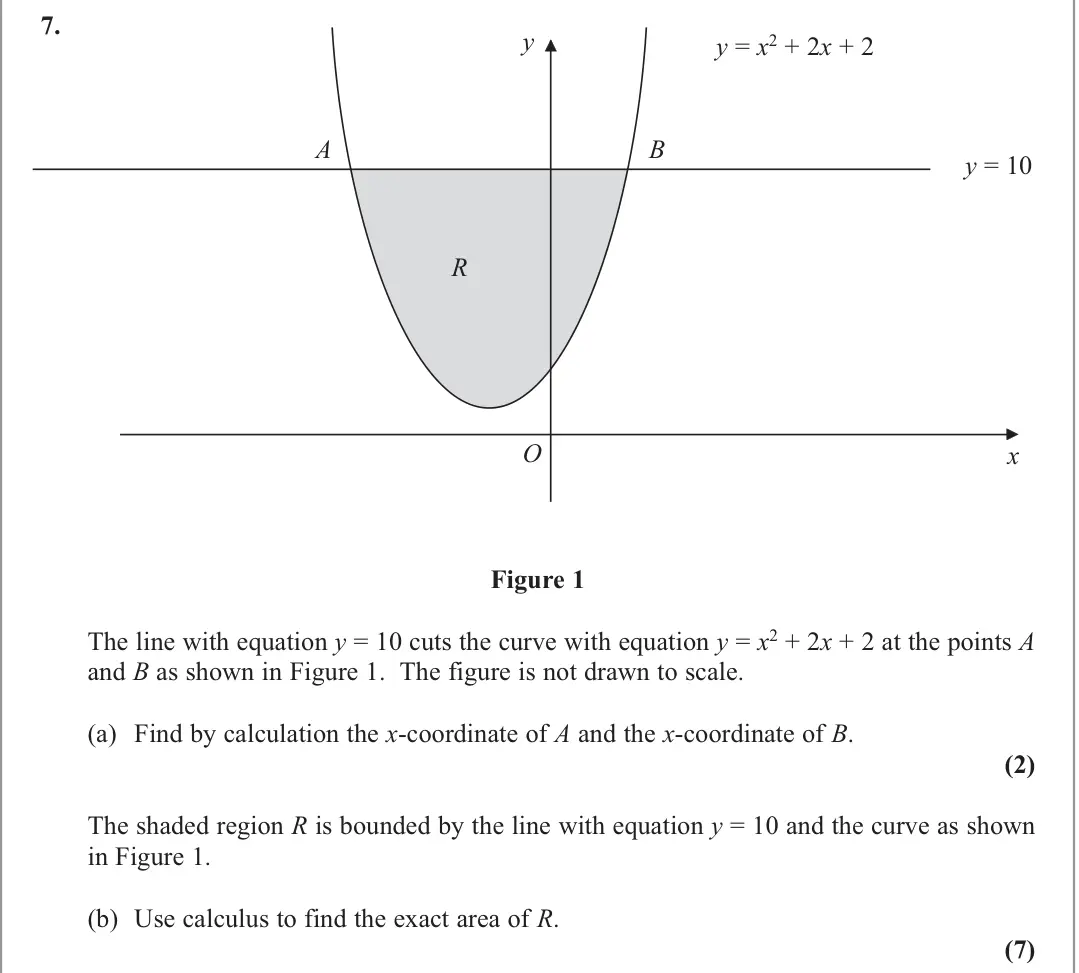
    Original question 7: Figure 1 The line with equation y = 10 cuts the curve with equation y = x2 + 2x + 2 at the points A and B as shown in Figure 1. The figure is not drawn to scale

    Loading the question…

    (Total for Question 7 is 9 marks)
  9. Q9

    January 2013 · Legacy C2 · ★★★★★

    The whole paper ↗
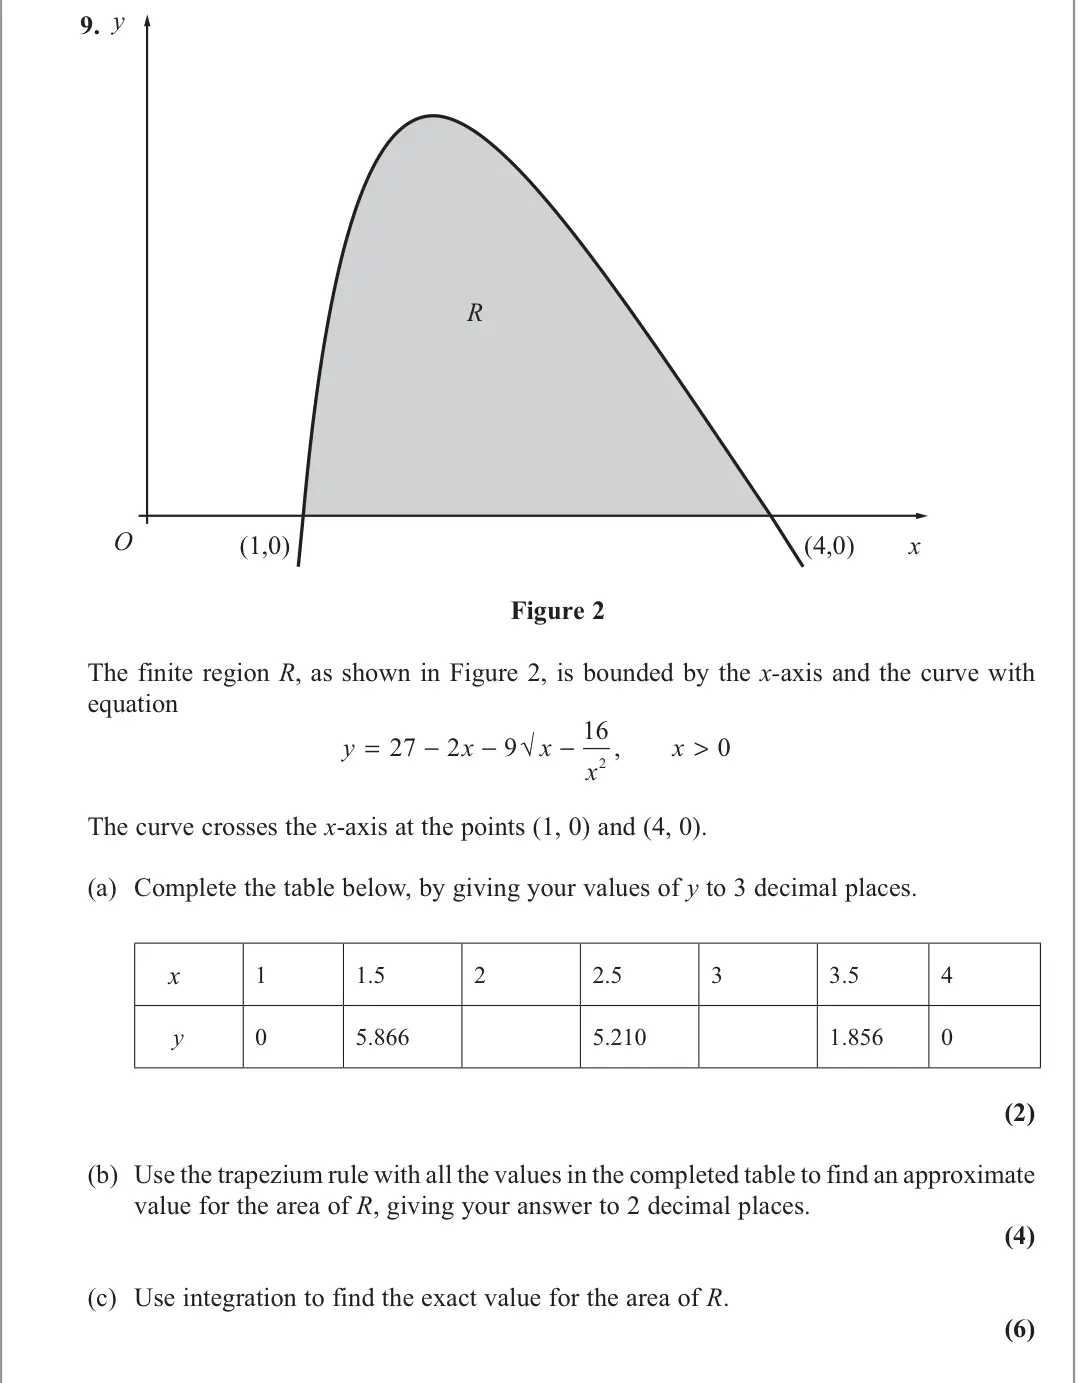
    Original question 9: Figure 2 The finite region R, as shown in Figure 2, is bounded by the x-axis and the curve with equation y x x x x = − − − > 27 2 9 16 0 2 √ , The curve crosses

    Loading the question…

    (Total for Question 9 is 12 marks)
  10. Q5

    June 2012 · Legacy C2 · ★★★★★

    The whole paper ↗
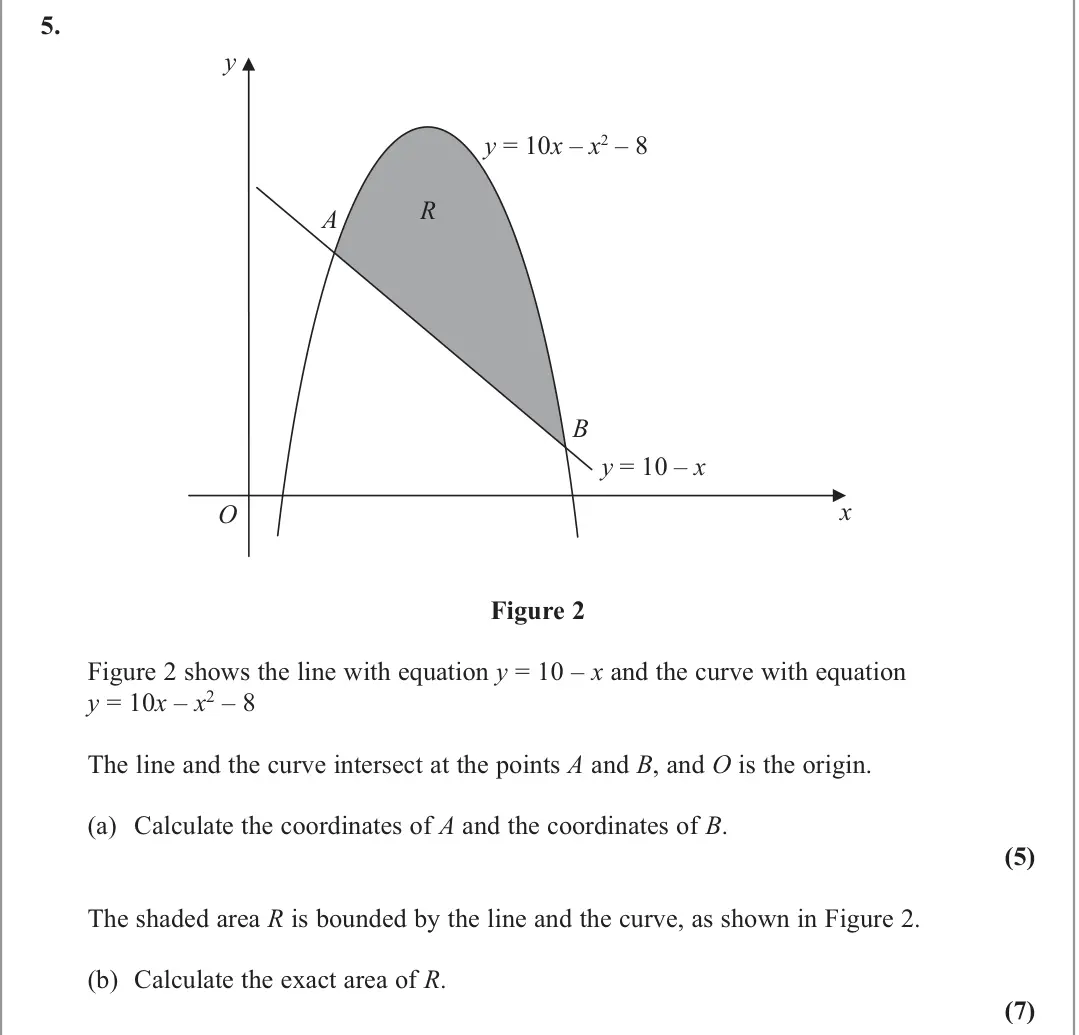
    Original question 5: O y A B x y = 10x – x2 – 8 y = 10 – x R Figure 2 Figure 2 shows the line with equation y = 10 – x and the curve with equation y = 10x – x2 – 8 The line and the

    Loading the question…

    (Total for Question 5 is 12 marks)
  11. Q6

    January 2012 · Legacy C2 · ★★★★★

    The whole paper ↗
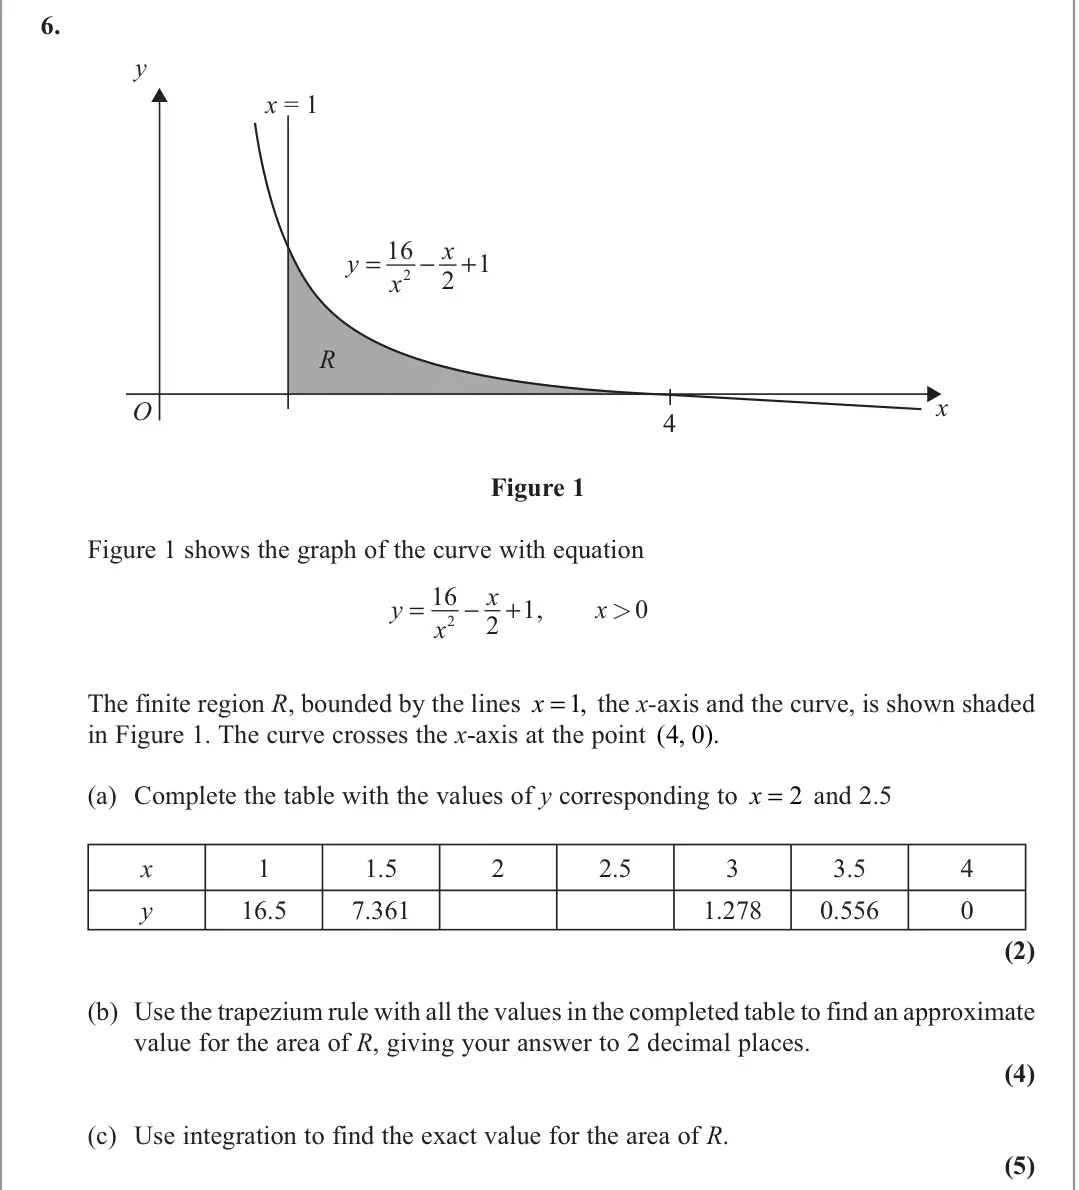
    Original question 6: Figure 1 Figure 1 shows the graph of the curve with equation y x x = − + 16 2 1 2 , x 0 > The finite region R, bounded by the lines x = 1, the x-axis and the cu

    Loading the question…

    (Total for Question 6 is 11 marks)
  12. Q9

    June 2011 · Legacy C2 · ★★★★★

    The whole paper ↗
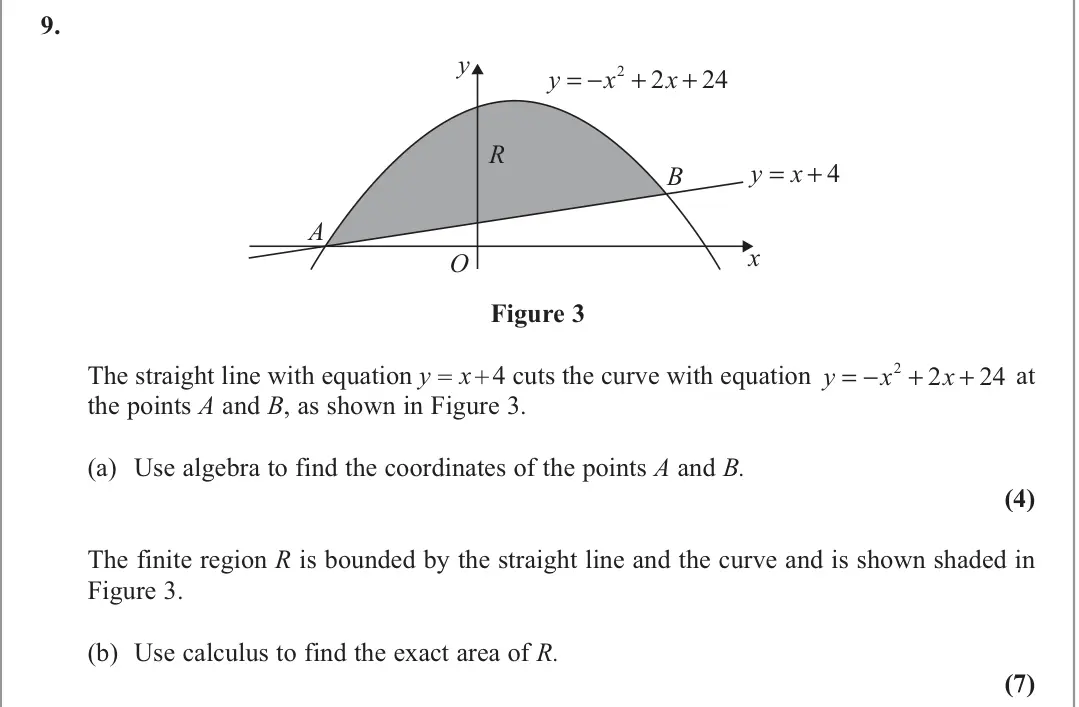
    Original question 9: y x A B R O 4 y x = + 2 2 24 y x x = − + + Figure 3 The straight line with equation y = x+ 4 cuts the curve with equation y x x = − + + 2 2 24 at the points A a

    Loading the question…

    (Total for Question 9 is 11 marks)
  13. Q4

    January 2011 · Legacy C2 · ★★★

    The whole paper ↗
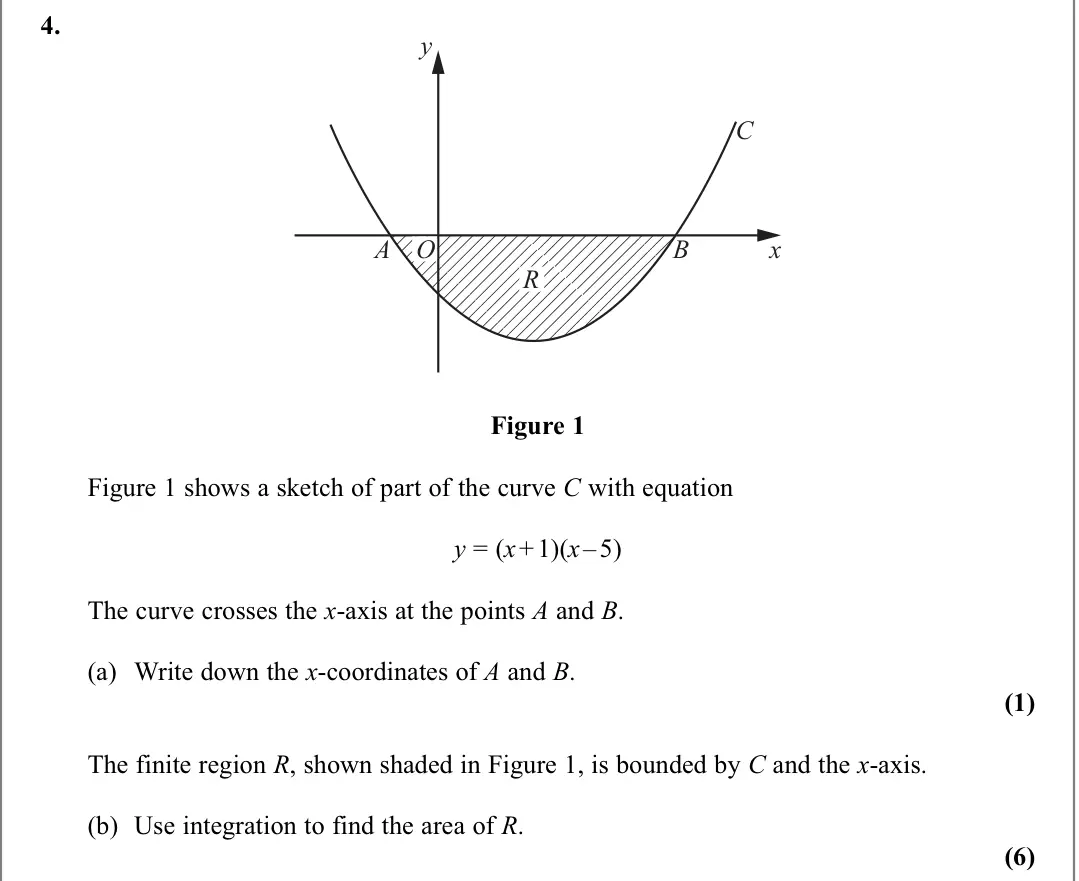
    Original question 4: y C A O R B x Figure 1 Figure 1 shows a sketch of part of the curve C with equation y = (x + 1)(x – 5) The curve crosses the x-axis at the points A and B. (a) W

    Loading the question…

    (Total for Question 4 is 7 marks)
  14. Q8

    June 2010 · Legacy C2 · ★★★★

    The whole paper ↗
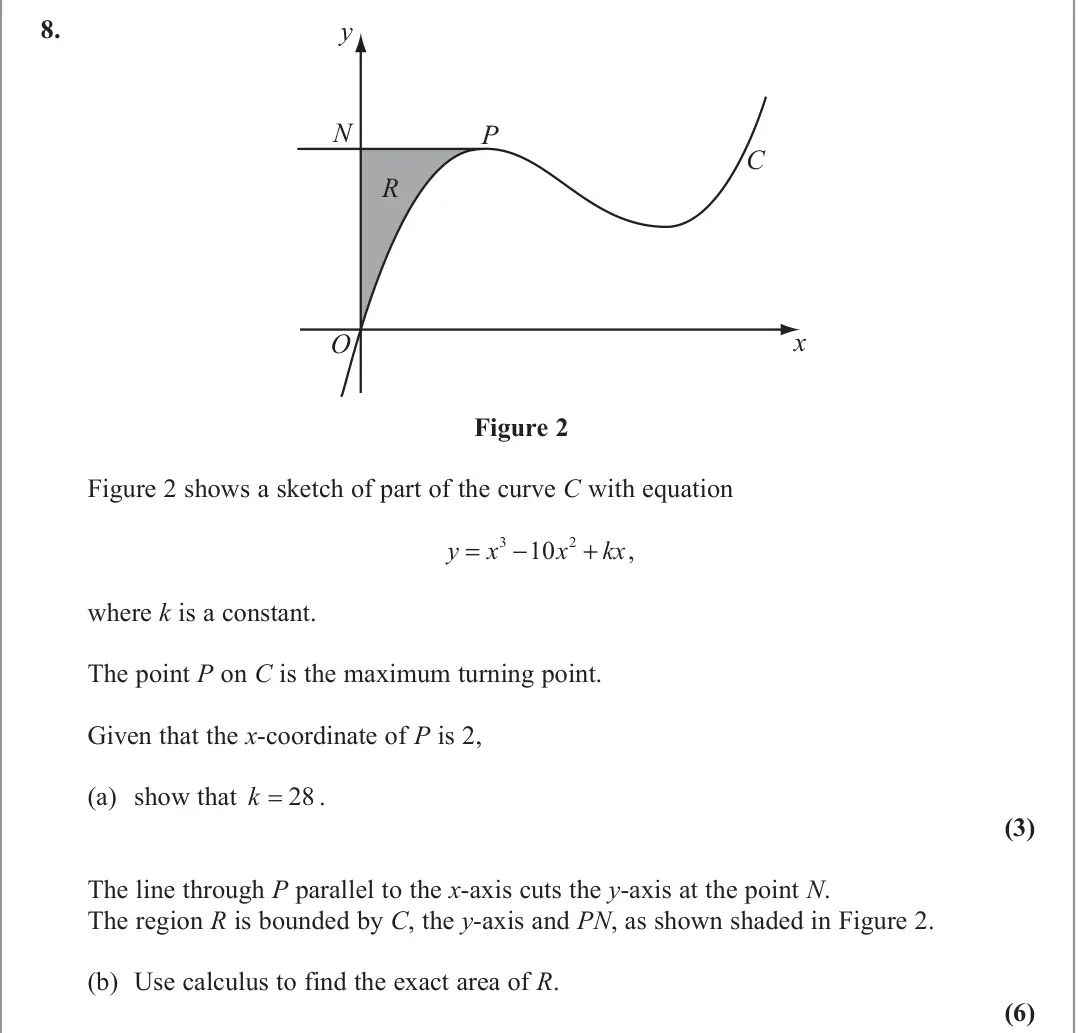
    Original question 8: Figure 2 Figure 2 shows a sketch of part of the curve C with equation y x x kx = − + 3 2 10 , where k is a constant. The point P on C is the maximum turning poi

    Loading the question…

    (Total for Question 8 is 9 marks)
  15. Q7

    January 2010 · Legacy C2 · ★★★★

    The whole paper ↗
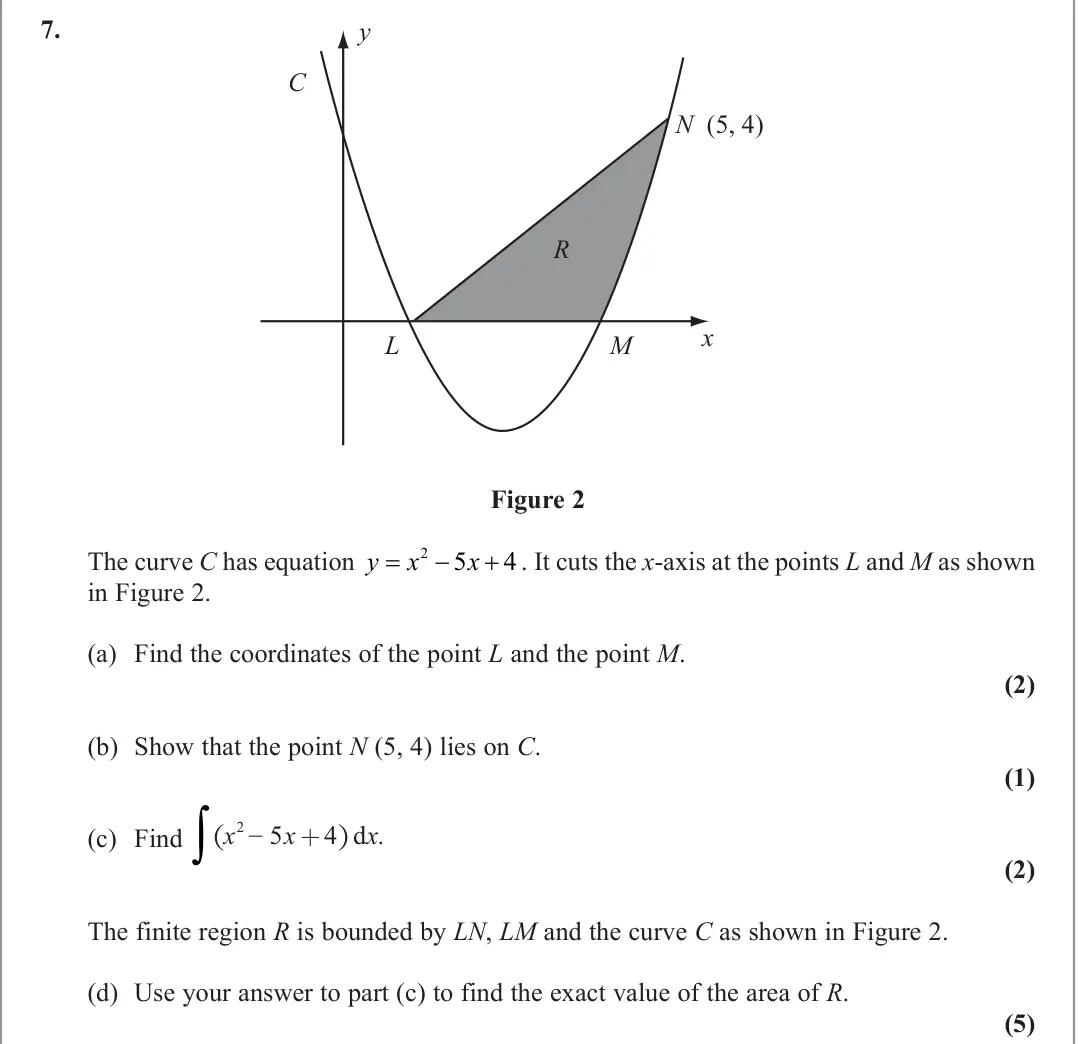
    Original question 7: Figure 2 The curve C has equation y x x = − + 2 5 4 . It cuts the x-axis at the points L and M as shown in Figure 2. (a) Find the coordinates of the point L and

    Loading the question…

    (Total for Question 7 is 10 marks)
  16. Q1

    June 2009 · Legacy C2 · ★★★

    The whole paper ↗
    Original question 1: Use calculus to find the value of 2 3 x x x + √ ( ) d 4 1∫ . (5)

    Loading the question…

    (Total for Question 1 is 5 marks)
  17. Q2

    January 2009 · Legacy C2 · ★★★

    The whole paper ↗
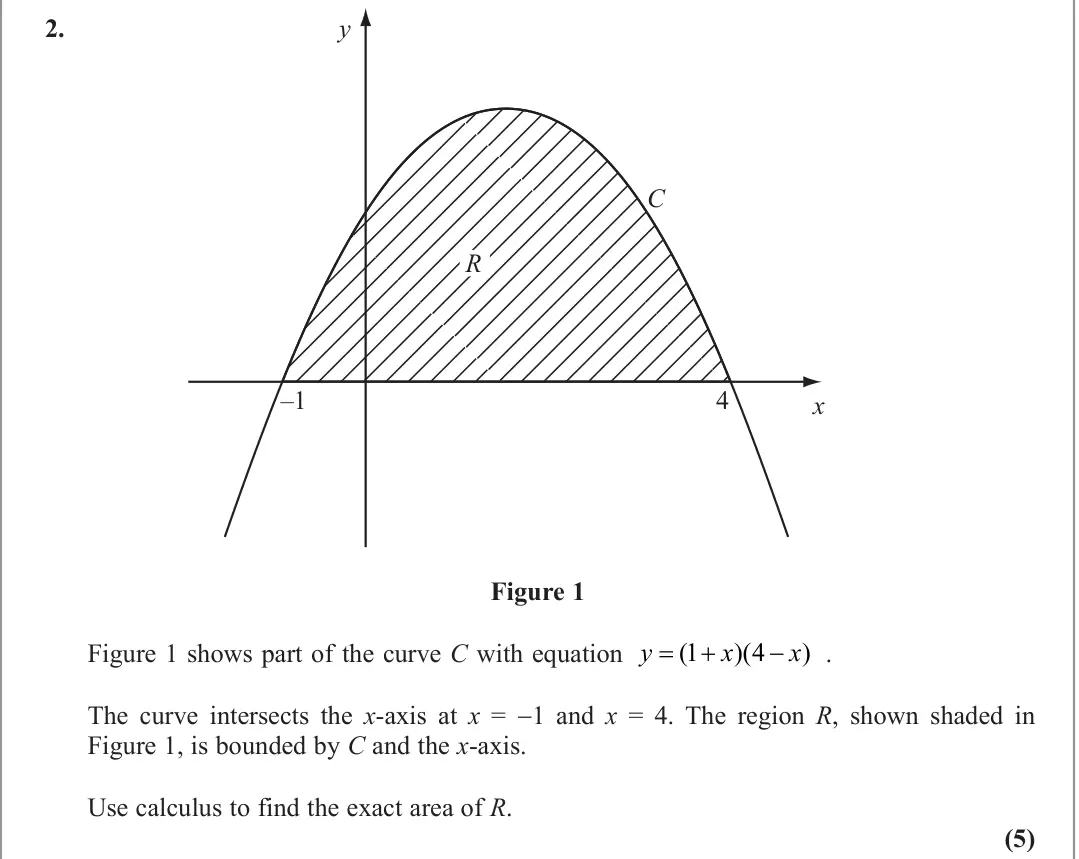
    Original question 2: Figure 1 Figure 1 shows part of the curve C with equation . The curve intersects the x-axis at x = −1 and x = 4. The region R, shown shaded in Figure 1, is boun

    Loading the question…

    (Total for Question 2 is 5 marks)
  18. Q8

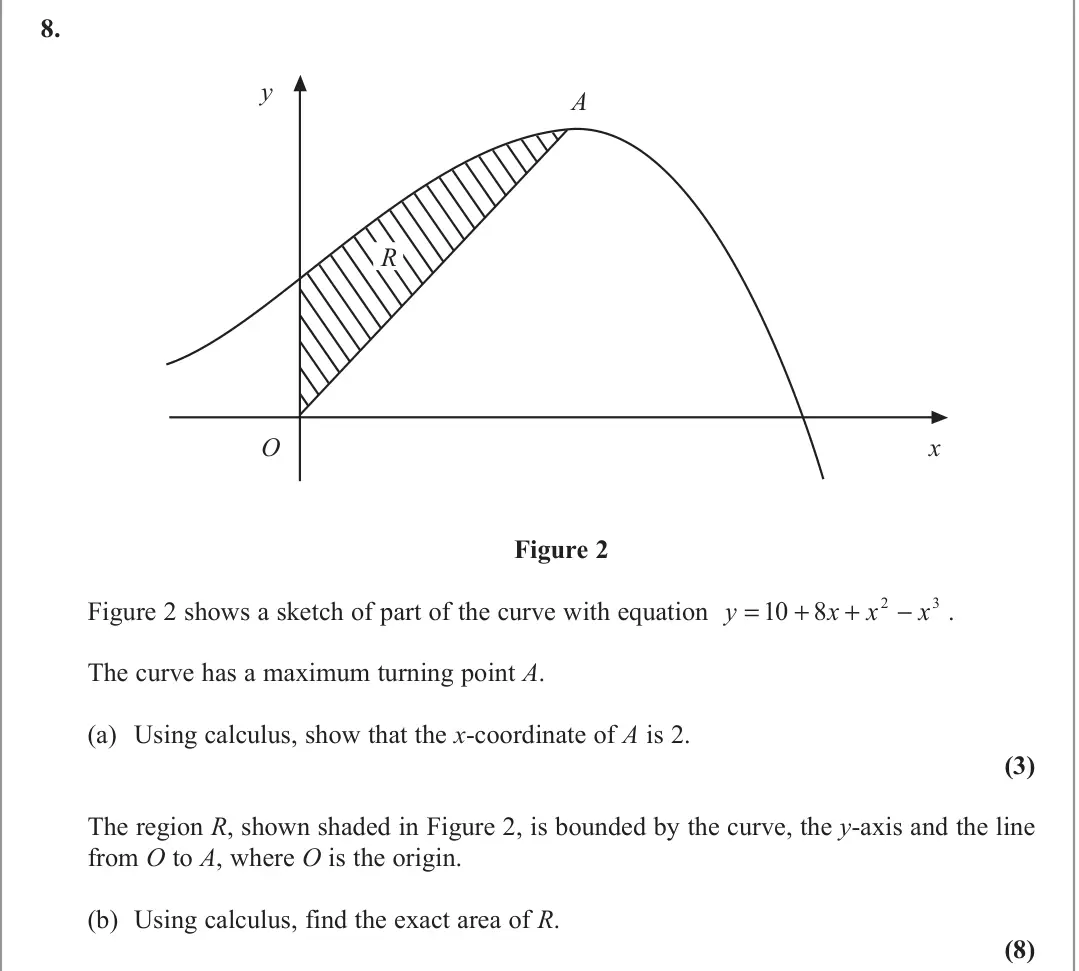
    June 2008 · Legacy C2 · ★★★★★

    The whole paper ↗
    Original question 8: Figure 2 Figure 2 shows a sketch of part of the curve with equation . The curve has a maximum turning point A. (a) Using calculus, show that the x-coordinate of

    Loading the question…

    (Total for Question 8 is 11 marks)
  19. Q7

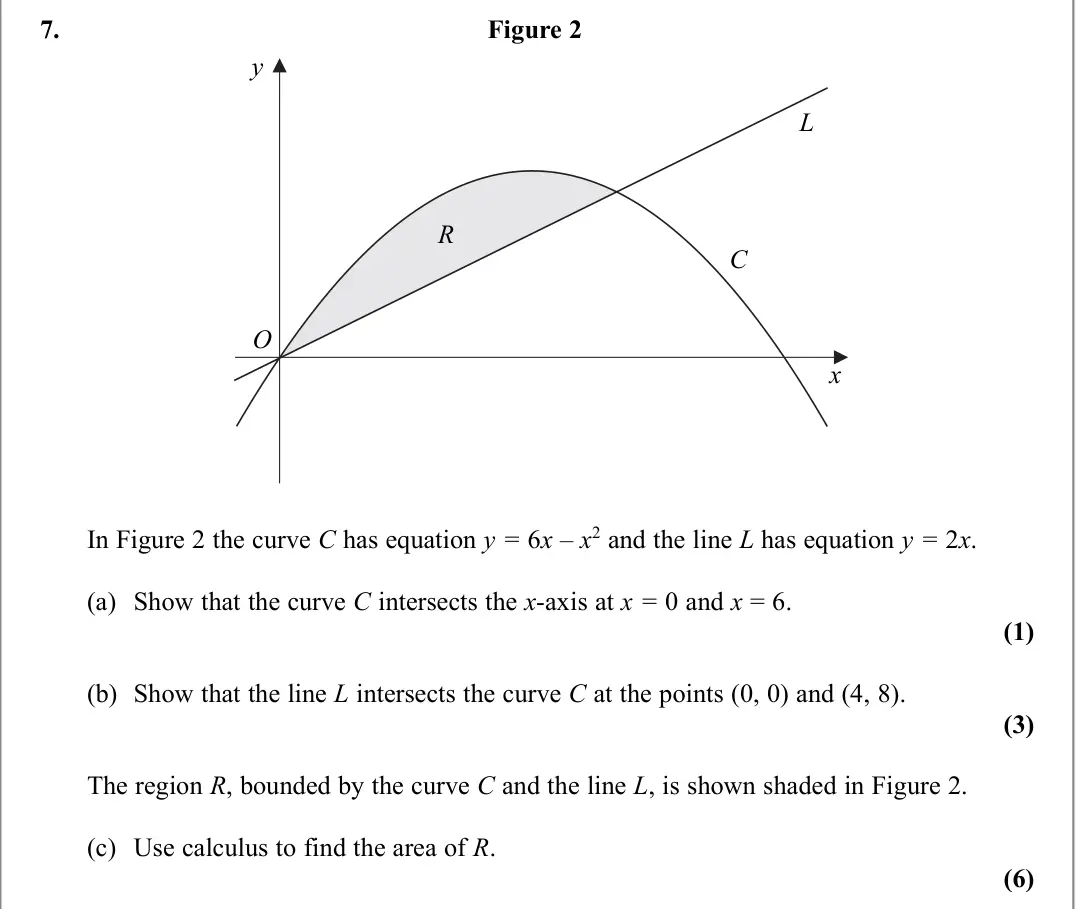
    January 2008 · Legacy C2 · ★★★★★

    The whole paper ↗
    Original question 7: Figure 2 In Figure 2 the curve C has equation y = 6x – x2 and the line L has equation y = 2x. (a) Show that the curve C intersects the x-axis at x = 0 and x = 6

    Loading the question…

    (Total for Question 7 is 10 marks)
All 19 questions on Definite integration and area, as a list
  1. June 2018, Legacy C2, Q9 (12 marks): y x O A R B Figure 3 Figure 3 shows a sketch of part of the curve with equation y = 7x 2 (5 − 2 x) , x  0 The curve has a turning point at the point A, where x
  2. June 2017, Legacy C2, Q10 (10 marks): A B C O R y x Figure 2 Figure 2 shows a sketch of part of the curve with equation y = 4x3 + 9x2 – 30x – 8, –0.5 - x - 2.2 The curve has a turning point at the p
  3. June 2016, Legacy C2, Q7 (6 marks): Figure 3 Figure 3 shows a sketch of part of the curve with equation y x x x = − 3 0 3 2, . The finite region S, bounded by the x-axis and the curve, is shown sh
  4. June 2015, Legacy C2, Q6 (9 marks): (a) Find 10 2 1 2 x x ( ) ∫ − dx giving each term in its simplest form. (4) Figure 2 Figure 2 shows a sketch of part of the curve C with equation y x x x = − 10
  5. June 2014, Legacy C2, Q4 (5 marks): Use integration to find œ1 3 3 2 6 1 3 x x x + ⎛ ⎝⎜ ⎞ ⎠⎟ d giving your answer in the form a b + 3, where a and b are constants to be determined. (5)
  6. June 2014, Legacy C2 (01R), Q6 (7 marks): Figure 3 Figure 3 shows a sketch of part of the curve C with equation y x x x = + ∈ 1 8 3 4 3 2, The curve C has a maximum turning point at the point A and a mi
  7. June 2013, Legacy C2, Q6 (8 marks): Figure 3 shows a sketch of part of the curve C with equation y = x(x + 4)(x – 2) The curve C crosses the x-axis at the origin O and at the points A and B. (a) W
  8. June 2013, Legacy C2 (01R), Q7 (9 marks): Figure 1 The line with equation y = 10 cuts the curve with equation y = x2 + 2x + 2 at the points A and B as shown in Figure 1. The figure is not drawn to scale
  9. January 2013, Legacy C2, Q9 (12 marks): Figure 2 The finite region R, as shown in Figure 2, is bounded by the x-axis and the curve with equation y x x x x = − − − > 27 2 9 16 0 2 √ , The curve crosses
  10. June 2012, Legacy C2, Q5 (12 marks): O y A B x y = 10x – x2 – 8 y = 10 – x R Figure 2 Figure 2 shows the line with equation y = 10 – x and the curve with equation y = 10x – x2 – 8 The line and the
  11. January 2012, Legacy C2, Q6 (11 marks): Figure 1 Figure 1 shows the graph of the curve with equation y x x = − + 16 2 1 2 , x 0 > The finite region R, bounded by the lines x = 1, the x-axis and the cu
  12. June 2011, Legacy C2, Q9 (11 marks): y x A B R O 4 y x = + 2 2 24 y x x = − + + Figure 3 The straight line with equation y = x+ 4 cuts the curve with equation y x x = − + + 2 2 24 at the points A a
  13. January 2011, Legacy C2, Q4 (7 marks): y C A O R B x Figure 1 Figure 1 shows a sketch of part of the curve C with equation y = (x + 1)(x – 5) The curve crosses the x-axis at the points A and B. (a) W
  14. June 2010, Legacy C2, Q8 (9 marks): Figure 2 Figure 2 shows a sketch of part of the curve C with equation y x x kx = − + 3 2 10 , where k is a constant. The point P on C is the maximum turning poi
  15. January 2010, Legacy C2, Q7 (10 marks): Figure 2 The curve C has equation y x x = − + 2 5 4 . It cuts the x-axis at the points L and M as shown in Figure 2. (a) Find the coordinates of the point L and
  16. June 2009, Legacy C2, Q1 (5 marks): Use calculus to find the value of 2 3 x x x + √ ( ) d 4 1∫ . (5)
  17. January 2009, Legacy C2, Q2 (5 marks): Figure 1 Figure 1 shows part of the curve C with equation . The curve intersects the x-axis at x = −1 and x = 4. The region R, shown shaded in Figure 1, is boun
  18. June 2008, Legacy C2, Q8 (11 marks): Figure 2 Figure 2 shows a sketch of part of the curve with equation . The curve has a maximum turning point A. (a) Using calculus, show that the x-coordinate of
  19. January 2008, Legacy C2, Q7 (10 marks): Figure 2 In Figure 2 the curve C has equation y = 6x – x2 and the line L has equation y = 2x. (a) Show that the curve C intersects the x-axis at x = 0 and x = 6

Questions, mark schemes and examiner’s reports are © Pearson Edexcel, from their published past papers. Plumi isn’t affiliated with any exam board. Want whole papers? Edexcel A-Level Maths past papers, or our free Edexcel-style practice pack.

The Plumi iPad app also offers exam-style questions with AI feedback on your handwritten working.