 plumi
Production possibility frontiers: Edexcel A‑Level Economics A questions
Every Edexcel A-Level Economics A exam question on 1.1.4 Production possibility frontiers, 2016–2025, with its mark scheme and examiner’s report.
Find questions784
Calculations
Q2(b)
The whole paper ↗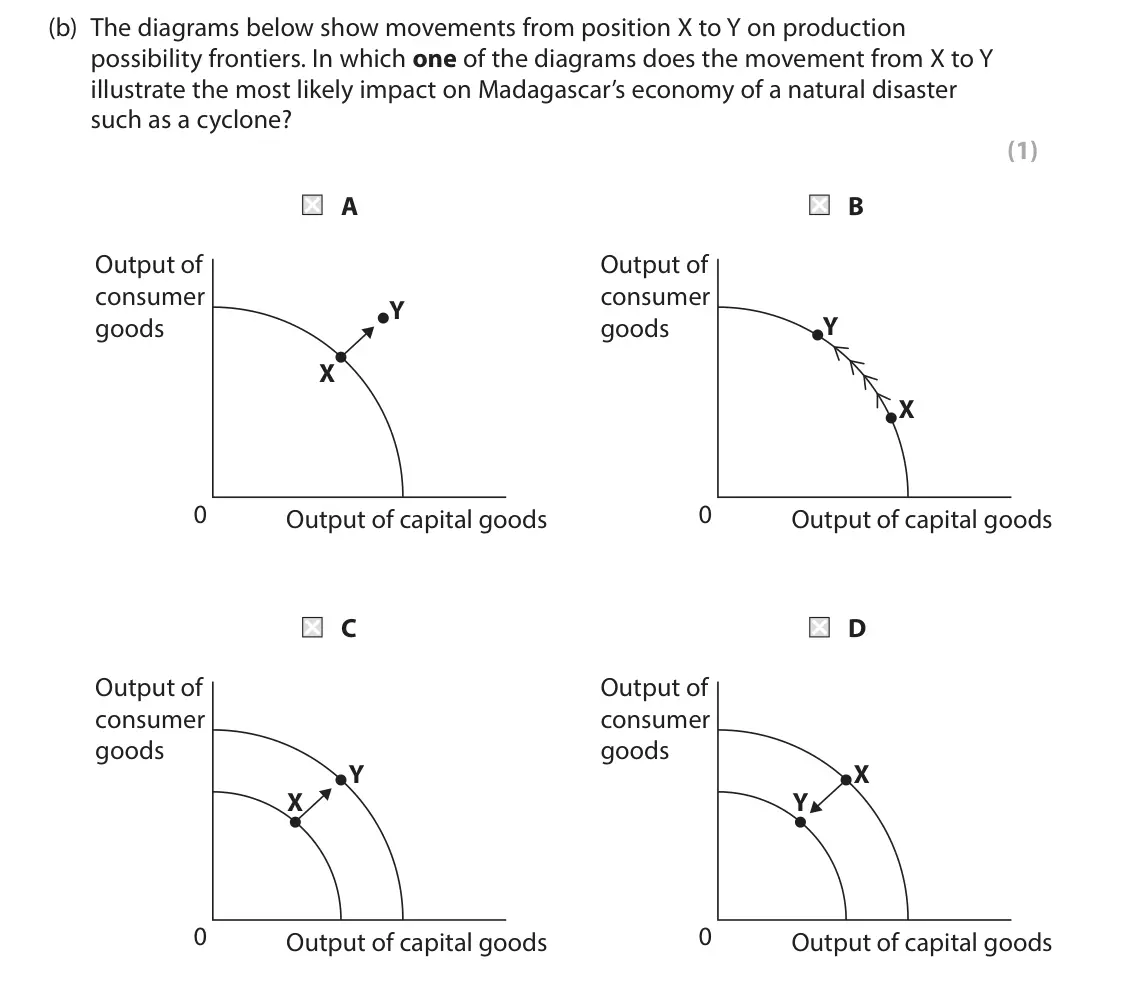
Q2(a)
The whole paper ↗
Q2(b)
The whole paper ↗
Q2(c)
The whole paper ↗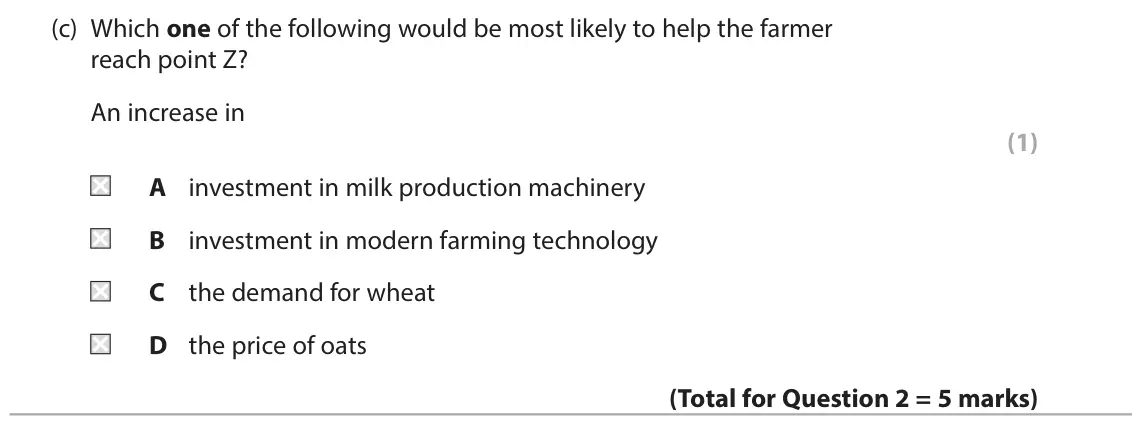
Q5(b)
The whole paper ↗
Q6(e)
The whole paper ↗
Q2(b)
The whole paper ↗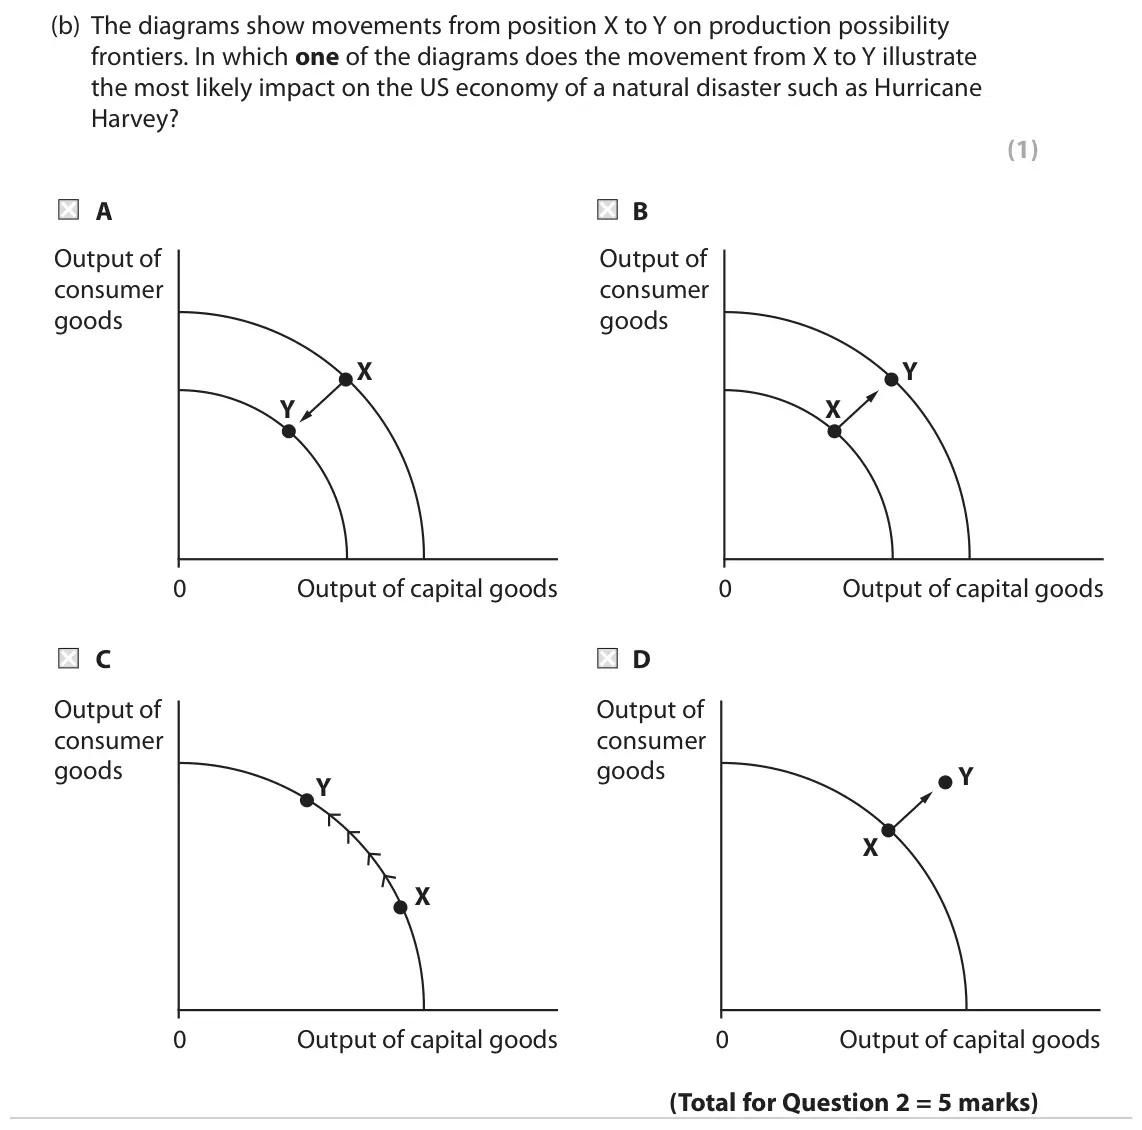
Q1(a)
The whole paper ↗
Q1(b)
The whole paper ↗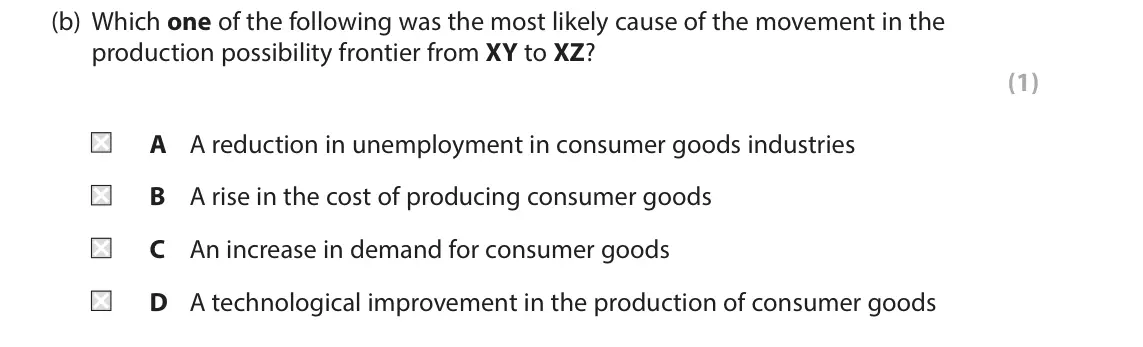
Q1(c)
The whole paper ↗
Q5(b)
The whole paper ↗
Q1(a)
The whole paper ↗
Q1(b)
The whole paper ↗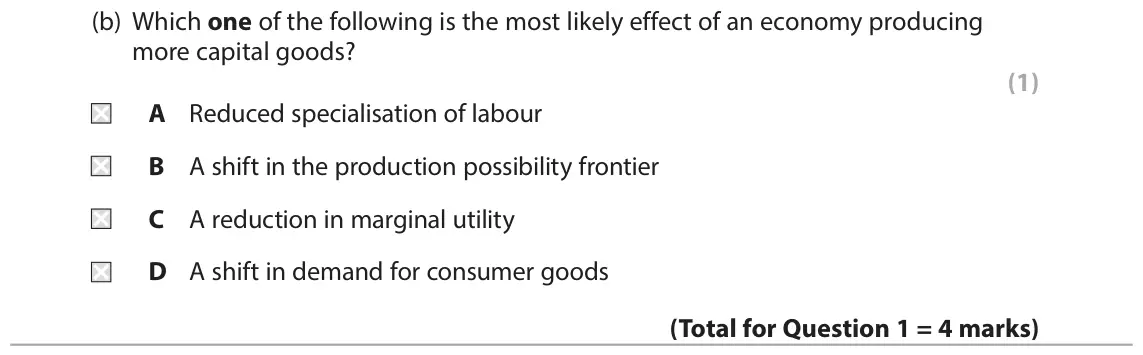
All 13 questions on Production possibility frontiers, as a list
- June 2024, AS Paper 1, Q2(b) (1 mark): The diagrams below show movements from position X to Y on production possibility frontiers. In which one of the diagrams does the movement from X to Y illustrat
- June 2023, Paper 1, Q2(a) (2 marks): Calculate the opportunity cost of the decision by the farmer to harvest 6 units of wheat this year at point Y (movement from point X to point Y). (2) 2 The prod
- June 2023, Paper 1, Q2(b) (2 marks): Explain the impact on efficiency of producing at point W in the following year. (2) 2 The production possibility frontier shows last year’s harvest for a UK far
- June 2023, Paper 1, Q2(c) (1 mark): Which one of the following would be most likely to help the farmer reach point Z? An increase in (1) A investment in milk production machinery B investment in m
- June 2023, AS Paper 1, Q5(b) (1 mark): The diagram shows the production possibility frontier of an economy. Assuming the economy is at point W, annotate the diagram to show the opportunity cost of pr
- June 2022, AS Paper 1, Q6(e) (15 marks): Discuss the likely impacts on an economy of specialising in the fishing industry. Use a production possibility frontier diagram in your answer. (15)
- June 2019, Paper 1, Q2(b) (1 mark): The diagrams show movements from position X to Y on production possibility frontiers. In which one of the diagrams does the movement from X to Y illustrate the
- June 2018, Paper 1, Q1(a) (2 marks): Calculate the original and the new opportunity cost of producing 50 capital goods. You are advised to show your working. (2) 1 The diagram refers to production
- June 2018, Paper 1, Q1(b) (1 mark): Which one of the following was the most likely cause of the movement in the production possibility frontier from XY to XZ? (1) A A reduction in unemployment in
- June 2018, Paper 1, Q1(c) (2 marks): Explain one characteristic of the economy at position W. (2) 1 The diagram refers to production possibility frontiers for a country that produces capital goods
- June 2018, AS Paper 1, Q5(b) (2 marks): The diagram shows the production possibility frontier for the BBC. Assuming the BBC is at point W, annotate the diagram to show the opportunity cost of providin
- June 2017, AS Paper 1, Q1(a) (3 marks): Explain, using marginal analysis from the table above, the concept of opportunity cost. (You may use the last column in answering the question.) (3) 1 The produ
- June 2017, AS Paper 1, Q1(b) (1 mark): Which one of the following is the most likely effect of an economy producing more capital goods? (1) A Reduced specialisation of labour B A shift in the product
Questions, mark schemes and examiner’s reports are © Pearson Edexcel, from their published past papers. Plumi isn’t affiliated with any exam board. Want whole papers? Full past papers.
Rather write your answers by hand on iPad? Plumi marks them against the same mark schemes.