 plumi
Inflation: Edexcel A‑Level Economics A questions
Every Edexcel A-Level Economics A exam question on 2.1.2 Inflation, 2016–2025, with its mark scheme and examiner’s report.
Find questions784
Calculations
Q1(d)
The whole paper ↗
Q6(f)
The whole paper ↗
Q6(a)
The whole paper ↗
Q6(d)
The whole paper ↗
Q1(b)
The whole paper ↗
Q6(b)
The whole paper ↗
Q6(d)
The whole paper ↗
Q6(e)
The whole paper ↗
Q5(a)
The whole paper ↗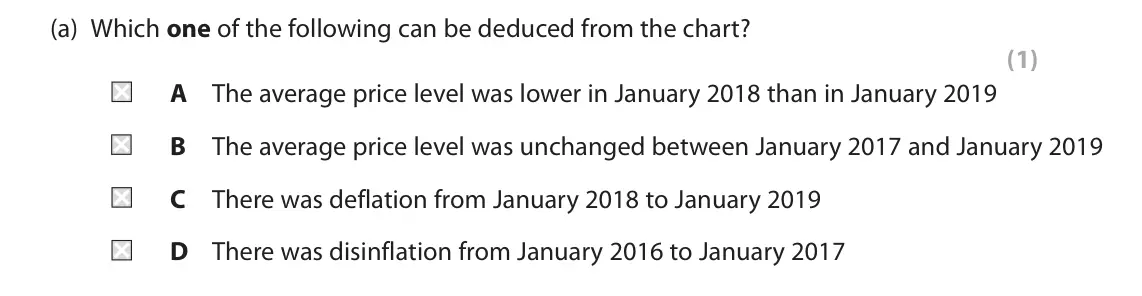
Q5(b)
The whole paper ↗
Q1(a)
The whole paper ↗
Q1(b)
The whole paper ↗
Q1(c)
The whole paper ↗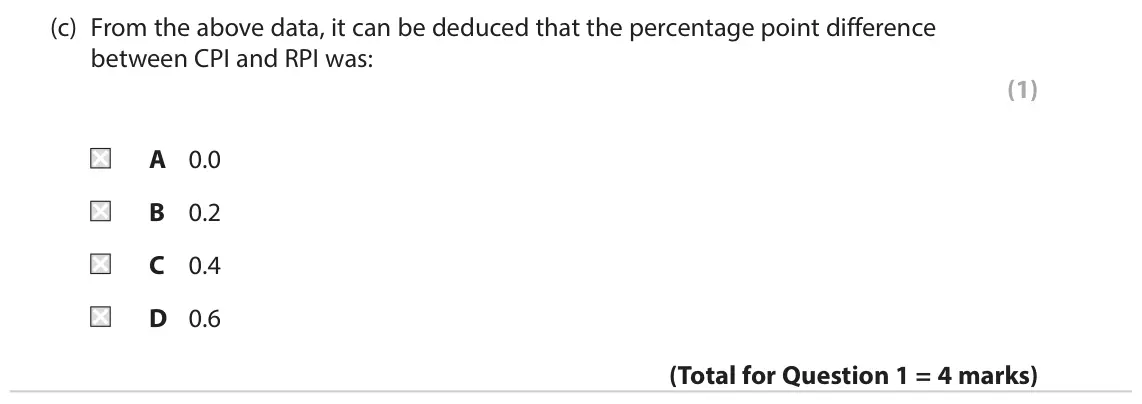
Q1(c)
The whole paper ↗
Q2(e)
The whole paper ↗
Q4(a)
The whole paper ↗
Q5(b)(i)
The whole paper ↗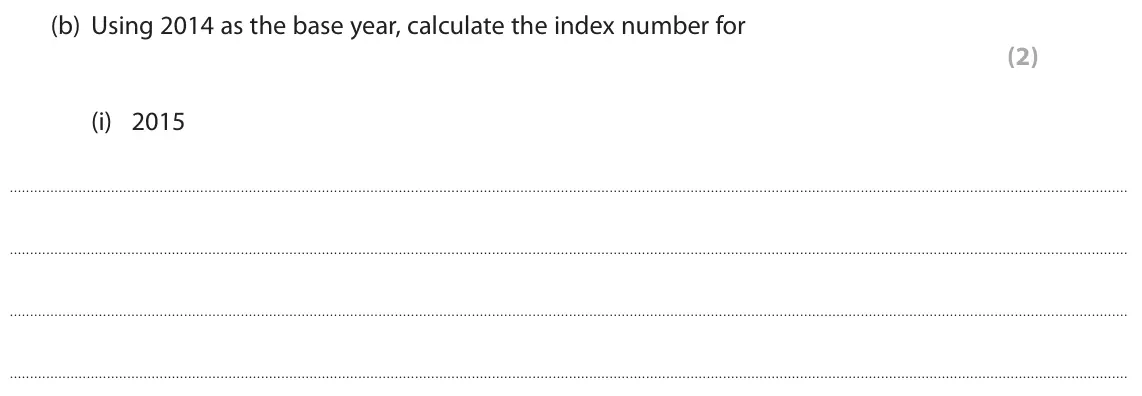
Q5(b)(ii)
The whole paper ↗
Q5(c)
The whole paper ↗
Q6(a)
The whole paper ↗
All 31 questions on Inflation, as a list
- June 2025, Paper 3, Q1(d) (25 marks): Evaluate the microeconomic and macroeconomic effects of high levels of inflation. Refer to the UK or any other developed economy in your answer. (25) Read Figur
- June 2025, AS Paper 2, Q6(f) (20 marks): Evaluate the possible causes of inflation in the UK. (20) Read Figures 1 and 2 and Extract A in the Source Booklet before answering Question 6. Answer ALL Quest
- June 2024, AS Paper 2, Q6(a) (4 marks): With reference to Figure 1, explain the term ‘inflation rate’. (4) Read Figures 1 and 2 and Extract A before answering Question 6. Answer ALL Questions 6(a) to
- June 2024, AS Paper 2, Q6(d) (5 marks): Explain one reason why ‘the fall in the exchange rate of the British pound’ (Extract A, line 21) is likely to increase inflation. (5) Read Figures 1 and 2 and E
- June 2023, Paper 3, Q1(b) (8 marks): Examine two reasons for the rise in inflation in the UK. Refer to the information provided in your answer. (8) Read Figures 1 and 2 and the following extracts (
- June 2023, AS Paper 2, Q6(b) (5 marks): With reference to Figure 2, explain how the CPI inflation rate is measured. Refer to the concept of weights in your answer. (5) Read Figures 1 and 2 below and E
- June 2023, AS Paper 2, Q6(d) (6 marks): With reference to Extract B, explain two reasons for the increase in the rate of UK inflation. (6) Read Figures 1 and 2 below and Extracts A and B before answer
- June 2023, AS Paper 2, Q6(e) (15 marks): Discuss the likely economic effects of the high rate of UK inflation on consumers and workers. . (15) Read Figures 1 and 2 below and Extracts A and B before ans
- June 2022, AS Paper 2, Q5(a) (1 mark): Which one of the following can be deduced from the chart? (1) A The average price level was lower in January 2018 than in January 2019 B The average price level
- June 2022, AS Paper 2, Q5(b) (3 marks): Explain one limitation of CPI in measuring the rate of inflation. (3) 5 Annual rate of UK inflation, as measured by the Consumer Prices Index (CPI), January 201
- October 2020, AS Paper 2, Q1(a) (1 mark): Define the term ‘inflation’. (1) 1 In October 2019 the annual rate of inflation in the UK was 1.5%, as measured by the Consumer Prices Index (CPI), and 2.1%, as
- October 2020, AS Paper 2, Q1(b) (2 marks): Explain one likely cause of inflation. (2) 1 In October 2019 the annual rate of inflation in the UK was 1.5%, as measured by the Consumer Prices Index (CPI), an
- October 2020, AS Paper 2, Q1(c) (1 mark): From the above data, it can be deduced that the percentage point difference between CPI and RPI was: (1) A 0.0 B 0.2 C 0.4 D 0.6 1 In October 2019 the annual ra
- June 2019, Paper 2, Q1(c) (2 marks): Explain one possible link between an increase in credit card lending and the rate of inflation. (2) 1 Monthly additions to UK credit card lending, £ billions, 2
- June 2019, Paper 3, Q2(e) (25 marks): Evaluate the likely microeconomic and macroeconomic effects of relatively high inflation rates in many African countries. (25) Read Figures 2, 3 and the followi
- June 2019, AS Paper 2, Q4(a) (1 mark): Define the term ‘price level’. (1) 4 The diagram below shows the aggregate demand (AD) and a possible long-run aggregate supply (LRAS) for the UK. Price LRAS le
- June 2019, AS Paper 2, Q5(b)(i) (2 marks): 2015 5 The table below shows average UK house prices between July 2014 and July 2017. Year Average house prices Index numbers of (£) average UK house prices (20
- June 2019, AS Paper 2, Q5(b)(ii): 2016. 5 The table below shows average UK house prices between July 2014 and July 2017. Year Average house prices Index numbers of (£) average UK house prices (2
- June 2019, AS Paper 2, Q5(c) (1 mark): Define the term ‘index number’. (1) 5 The table below shows average UK house prices between July 2014 and July 2017. Year Average house prices Index numbers of
- June 2019, AS Paper 2, Q6(a) (4 marks): With reference to the first paragraph of Extract A and Figure 1, explain how the change in the exchange rate of the pound has ‘contributed to rising inflation’
- June 2019, AS Paper 2, Q6(b) (6 marks): With reference to Extract A, explain two likely economic effects of the higher rate of UK inflation. (6) Read Figures 1 to 4 and extracts (A and B) before answe
- June 2019, AS Paper 2, Q6(c) (5 marks): With reference to the last paragraph of Extract A and Figure 2, explain one reason why it is necessary to regularly update the CPI basket of goods and services.
- June 2018, AS Paper 2, Q6(g) (20 marks): Evaluate the likely impact of high inflation on the UK government’s macroeconomic objectives. (20) Read Figures 1 to 3 and the following extracts (A and B) befo
- June 2017, Paper 2, Q3(a) (1 mark): Which one of the following statements is correct about the UK’s inflation record between September 2011 and January 2013? Based on the data shown, the UK experi
- June 2017, Paper 2, Q3(b) (4 marks): With reference to the data provided, explain the process of calculating the rate of inflation in the UK using the Consumer Prices Index. Refer to the concept of
- June 2017, Paper 2, Q6(b) (8 marks): With reference to the information provided and your own knowledge, examine two factors which might explain the change in the rate of Eurozone inflation as shown
- June 2017, AS Paper 2, Q1(a) (2 marks): Calculate the percentage change in the UK Consumer Prices Index from September 2014 to September 2015. You are advised to show your working. (2) 1 UK Consumer P
- June 2017, AS Paper 2, Q1(b) (1 mark): Define the term ‘deflation’. (1) 1 UK Consumer Prices Index (the base year 2005=100) September 2013 126.8 September 2014 128.4 September 2015 128.2 (Source: htt
- June 2017, AS Paper 2, Q1(c) (1 mark): Which one of the following is most likely to be a cause of deflation? A fall in: (1) A oil prices B unemployment C income tax rates D interest rates 1 UK Consum
- June 2016, AS Paper 2, Q6(d) (6 marks): With reference to the data, explain two likely reasons for the UK’s falling inflation rate. (6) Read Figures 1 and 2 below and read extracts A and B before answ
- June 2016, AS Paper 2, Q6(e) (15 marks): With reference to Extracts A and B and your own knowledge, discuss whether the MPC should be concerned about the risk of deflation in the UK economy. (15) Answe
Questions, mark schemes and examiner’s reports are © Pearson Edexcel, from their published past papers. Plumi isn’t affiliated with any exam board. Want whole papers? Full past papers.
Rather write your answers by hand on iPad? Plumi marks them against the same mark schemes.