 plumi
Inequality: Edexcel A‑Level Economics A questions
Every Edexcel A-Level Economics A exam question on 4.2.2 Inequality, 2016–2025, with its mark scheme and examiner’s report.
Find questions784
Calculations
Q1(d)
The whole paper ↗
Q1(d)
The whole paper ↗
Q6(a)
The whole paper ↗
Q6(b)
The whole paper ↗
Q5(a)
The whole paper ↗
Q5(b)
The whole paper ↗
Q5(c)
The whole paper ↗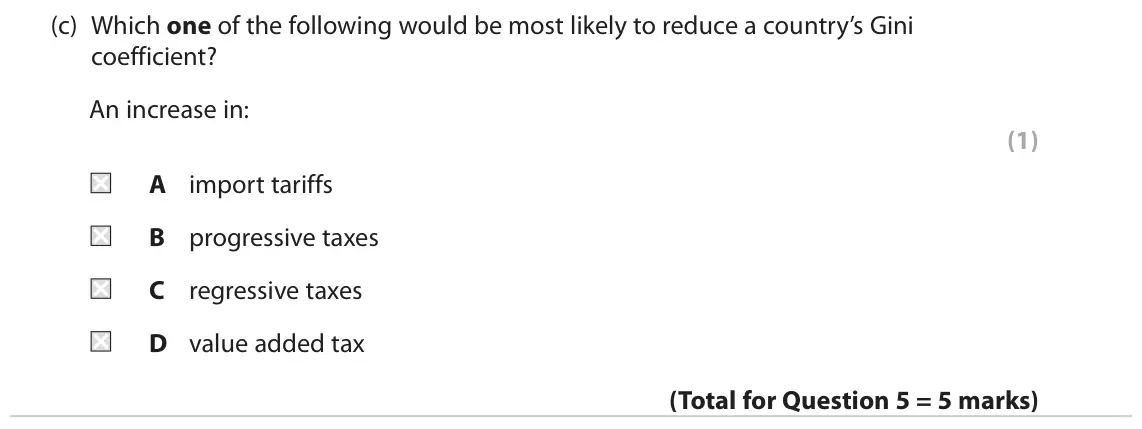
Q1(b)
The whole paper ↗
Q6(d)
The whole paper ↗
Q4(a)
The whole paper ↗
Q4(b)
The whole paper ↗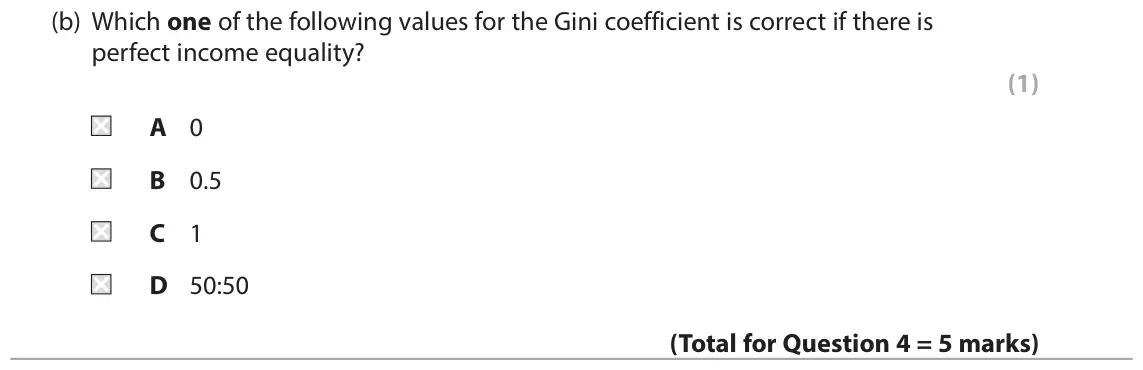
All 12 questions on Inequality, as a list
- June 2024, Paper 3, Q1(d) (25 marks): Evaluate the microeconomic and macroeconomic factors that explain gender-based wage differences in the UK oil and gas industry. (25) Read Figures 1 and 2 and th
- June 2023, Paper 3, Q1(d) (25 marks): Evaluate microeconomic and macroeconomic policies that could be used to reduce inequality in the UK. (25) Read Figures 1 and 2 and the following extracts (A and
- June 2022, Paper 2, Q6(a) (5 marks): Using a Lorenz curve diagram, explain how income inequality is measured using the Gini coefficient. Refer to Extract A in your answer. (5) Read Figures 1 and 2
- June 2022, Paper 2, Q6(b) (8 marks): With reference to Figure 1 and Extract A, examine two likely causes of income inequality within the UK. (8) Read Figures 1 and 2 and the following extracts (A t
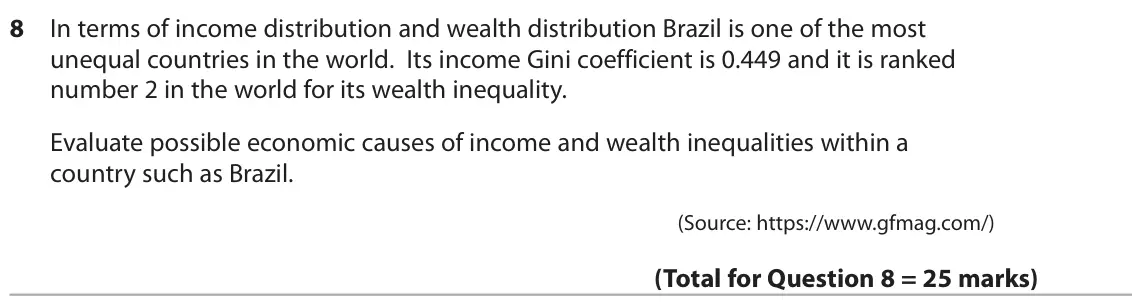
- October 2020, Paper 2, Q8 (25 marks): In terms of income distribution and wealth distribution Brazil is one of the most unequal countries in the world. Its income Gini coefficient is 0.449 and it is
- June 2019, Paper 2, Q5(a) (2 marks): Explain the distinction between income and wealth. (2) 5 According to the charity Oxfam, the combined wealth of the 62 richest people in the world is the same a
- June 2019, Paper 2, Q5(b) (2 marks): Explain one likely reason why global wealth inequality has increased. (2) 5 According to the charity Oxfam, the combined wealth of the 62 richest people in the
- June 2019, Paper 2, Q5(c) (1 mark): Which one of the following would be most likely to reduce a country’s Gini coefficient? An increase in: (1) A import tariffs B progressive taxes C regressive ta
- June 2019, Paper 3, Q1(b) (8 marks): Apart from changes in indirect taxes and subsidies, examine two causes of income inequality within a developed economy such as the UK. (8) Read Figure 1 and the
- June 2018, Paper 2, Q6(d) (10 marks): Assess the view that ‘some level of inequality is desirable to maintain an appropriate incentive structure in the economy’ (Extract B, lines 19 and 20). (10) Re
- June 2017, Paper 2, Q4(a) (4 marks): Explain one likely reason for the change in UK income inequality since 2007. (4) 4 The chart below shows the UK Gini coefficient of incomes, 2007 to 2013. 0.40
- June 2017, Paper 2, Q4(b) (1 mark): Which one of the following values for the Gini coefficient is correct if there is perfect income equality? (1) A 0 B 0.5 C 1 D 50:50 4 The chart below shows the
Questions, mark schemes and examiner’s reports are © Pearson Edexcel, from their published past papers. Plumi isn’t affiliated with any exam board. Want whole papers? Full past papers.
Rather write your answers by hand on iPad? Plumi marks them against the same mark schemes.