 plumi
Indirect taxes and subsidies: Edexcel A‑Level Economics A questions
Every Edexcel A-Level Economics A exam question on 1.2.9 Indirect taxes and subsidies, 2016–2025, with its mark scheme and examiner’s report.
Find questions784
Calculations
Q2(a)
The whole paper ↗
Q6(f)
The whole paper ↗
Q6(g)
The whole paper ↗
Q6(f)
The whole paper ↗
Q1(a)
The whole paper ↗
Q1(b)
The whole paper ↗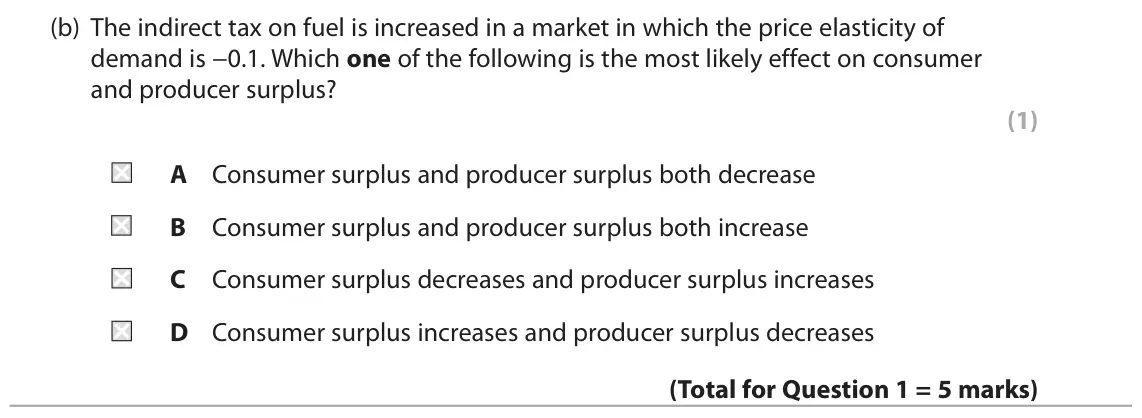
Q6(a)
The whole paper ↗
Q3(a)
The whole paper ↗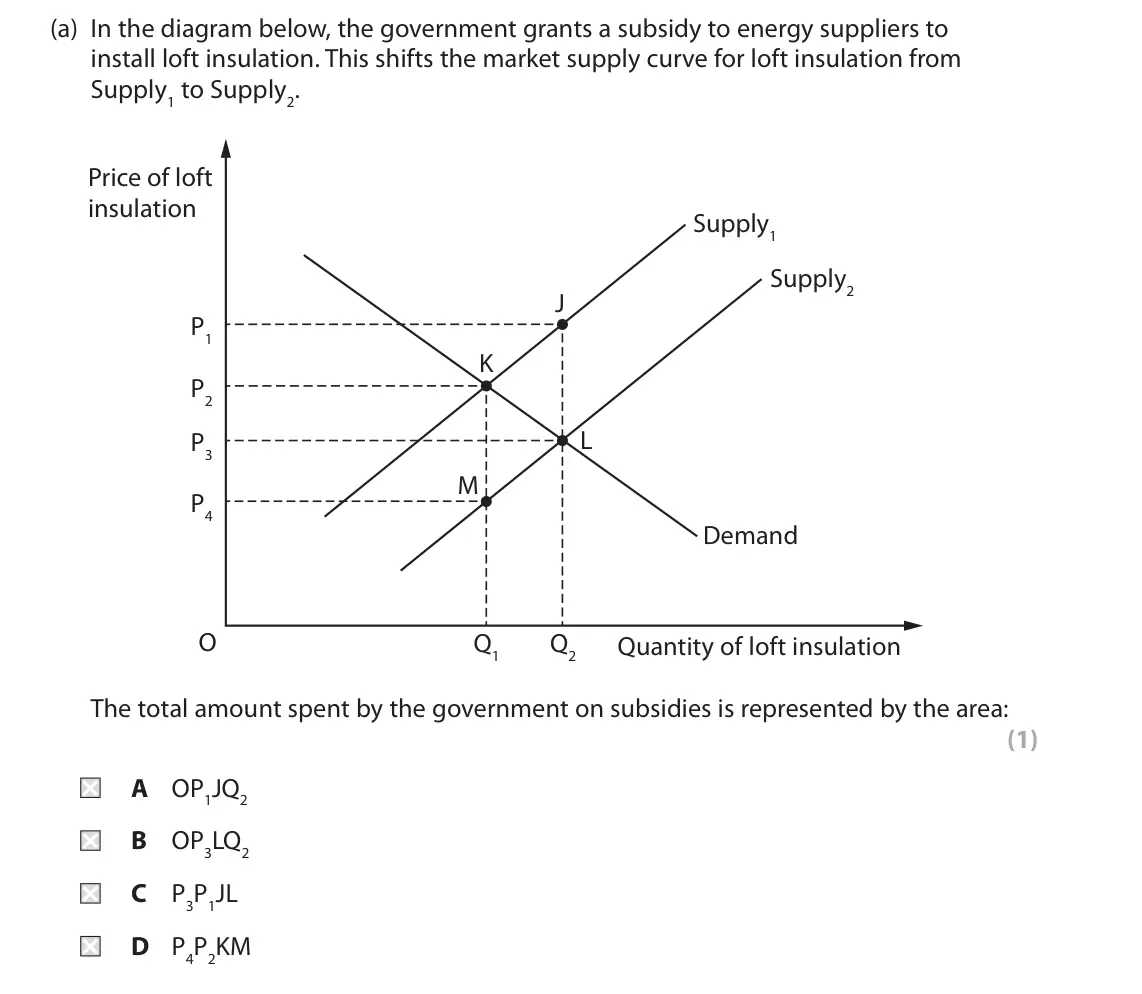
Q4(a)
The whole paper ↗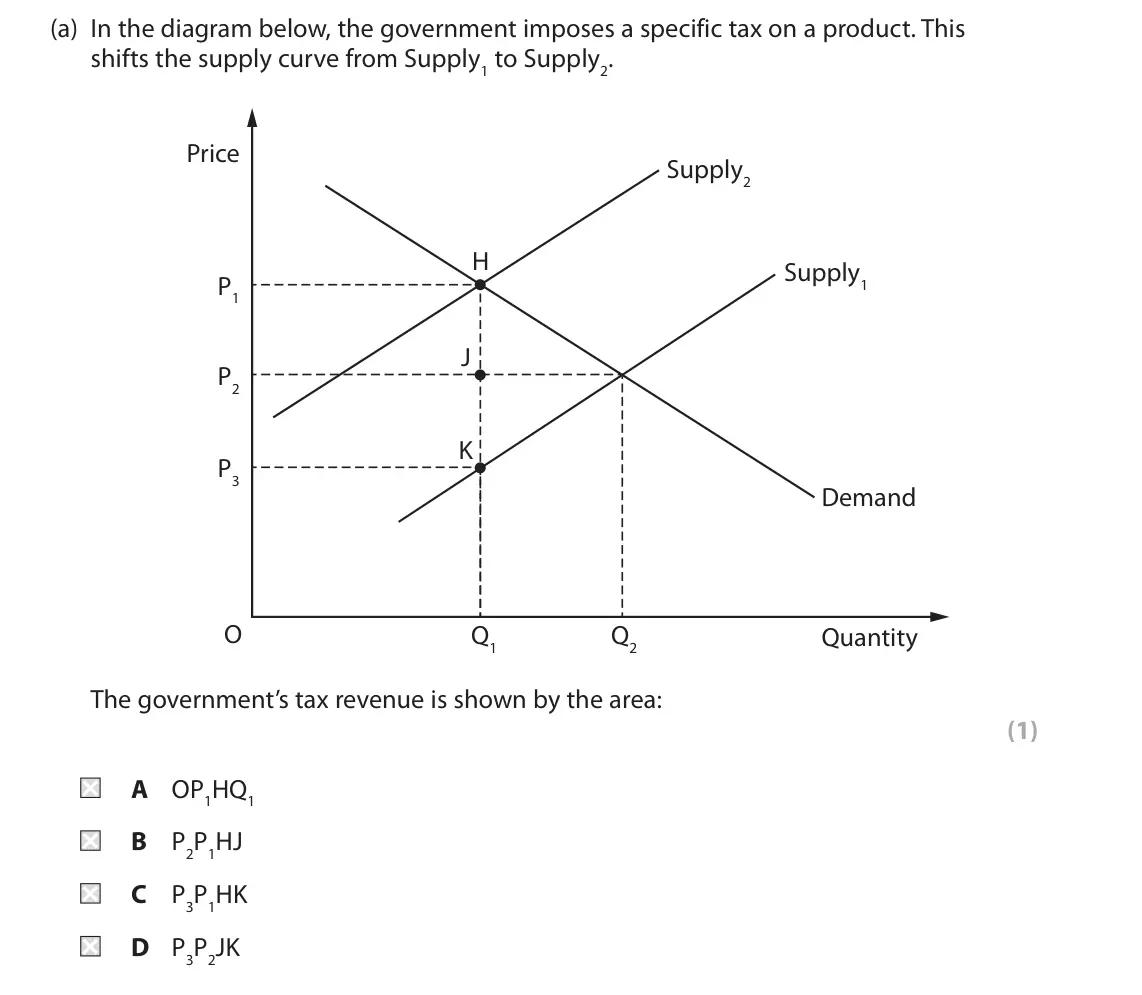
Q4(a)
The whole paper ↗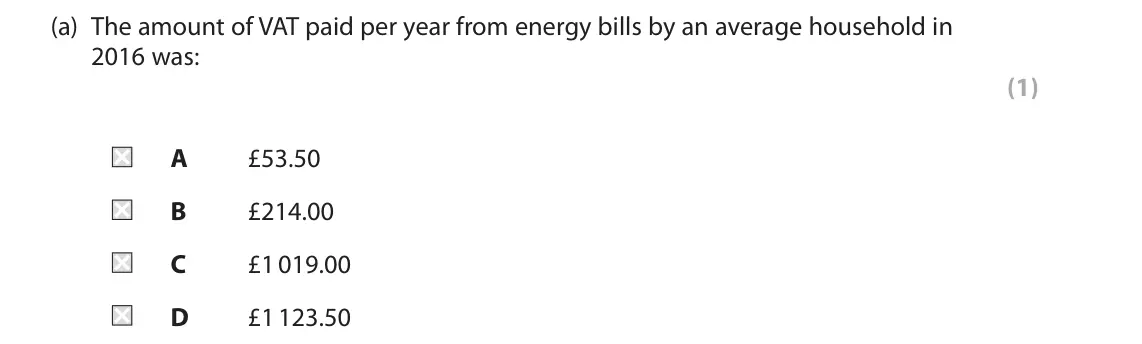
Q4(b)
The whole paper ↗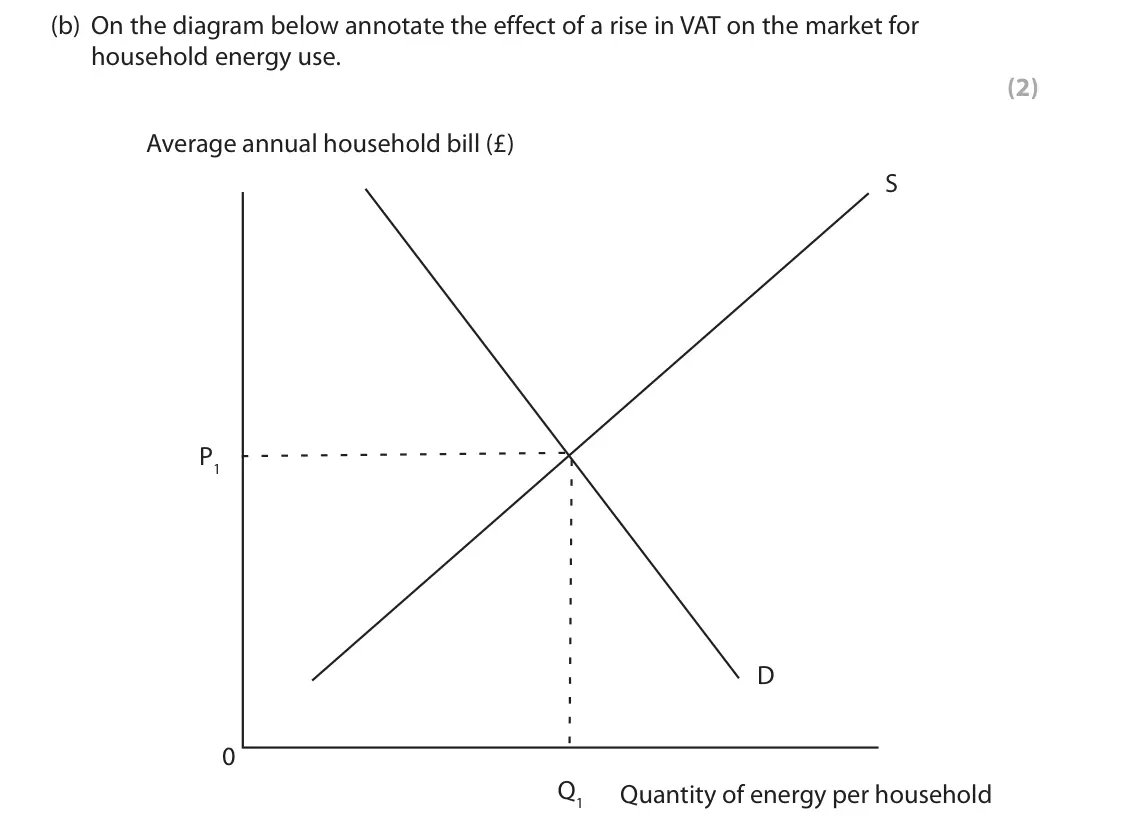
Q4(c)
The whole paper ↗
Q2(a)
The whole paper ↗
Q3(a)
The whole paper ↗
Q3(b)(i)
The whole paper ↗
Q3(b)(ii)
The whole paper ↗
Q3(c)
The whole paper ↗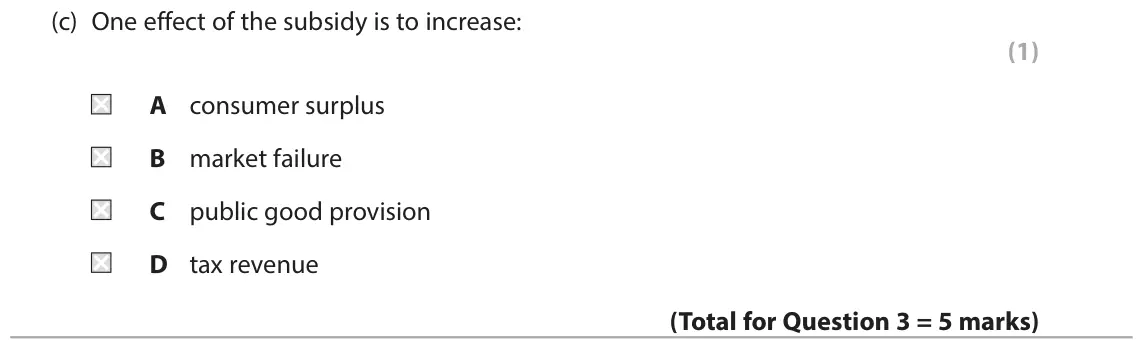

Q3(a)
The whole paper ↗
Q3(b)
The whole paper ↗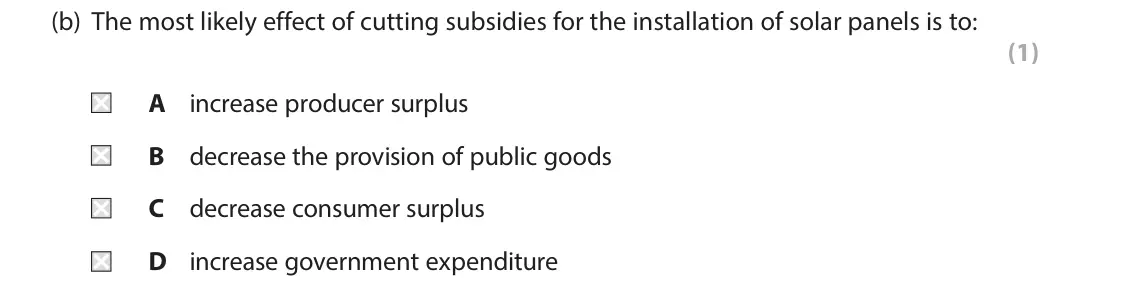
All 21 questions on Indirect taxes and subsidies, as a list
- June 2025, Paper 3, Q2(a) (5 marks): Using a demand and supply diagram, explain the cost of a subsidy on the market for cooking oil to the Indian government (Extract E, line 6). (5) Read Figure 3 a
- June 2025, AS Paper 1, Q6(f) (20 marks): Evaluate the likely microeconomic effects of a reduction in subsidies to farmers of animal products (Figure 1 and Extract B, line 14). Use a relevant diagram to
- June 2025, AS Paper 1, Q6(g) (20 marks): Evaluate the likely microeconomic effects of an increase in indirect tax on animal products (Figure 2 and Extract A, line 17). Use a relevant diagram to support
- June 2024, AS Paper 1, Q6(f) (20 marks): Evaluate the likely impact of a tax on plastic food-packaging. Use a diagram to support your answer. (20) Read Figure 1 and the following extracts (A, B and C)
- October 2020, Paper 1, Q1(a) (4 marks): Draw a supply and demand diagram to show the incidence of a specific petrol tax on consumers and producers. (4) 1 Fuel duty is an excise tax imposed on the sale
- October 2020, Paper 1, Q1(b) (1 mark): The indirect tax on fuel is increased in a market in which the price elasticity of demand is −0.1. Which one of the following is the most likely effect on consu
- October 2020, Paper 1, Q6(a) (5 marks): Refer to Figure 1. Explain the likely effect of the change in subsidy levels between 2017 and 2018 on rail fares. Include a supply and demand diagram in your an
- October 2020, AS Paper 1, Q3(a) (1 mark): In the diagram below, the government grants a subsidy to energy suppliers to install loft insulation. This shifts the market supply curve for loft insulation fr
- October 2020, AS Paper 1, Q4(a) (1 mark): In the diagram below, the government imposes a specific tax on a product. This shifts the supply curve from Supply1 to Supply2. Price Supply2 H Supply1 P1 J P2
- June 2019, AS Paper 1, Q4(a) (1 mark): The amount of VAT paid per year from energy bills by an average household in 2016 was: (1) A £53.50 B £214.00 C £1 019.00 D £1 123.50 4 In 2016 the average ener
- June 2019, AS Paper 1, Q4(b) (2 marks): On the diagram below annotate the effect of a rise in VAT on the market for household energy use. (2) Average annual household bill (£) S P1 D 0 Q1 Quantity of
- June 2019, AS Paper 1, Q4(c) (1 mark): Define the term ‘indirect tax’. (1) 4 In 2016 the average energy bill per household was £1 070 per year, excluding VAT, an indirect tax charged at 5%. (Source:
- June 2018, Paper 1, Q2(a) (2 marks): Calculate the weekly revenue received by Camelot after paying the tax to the government. You are advised to show your working. (2) 2 The number of individual we
- June 2017, Paper 1, Q3(a) (2 marks): Calculate the total domestic cooking gas subsidy paid daily by the Indian government. You are advised to show your working. (2) 3 The Indian government has intr
- June 2017, Paper 1, Q3(b)(i) (1 mark): consumers (1) 3 The Indian government has introduced a subsidy on domestic cooking gas cylinders in the city of Mumbai. The diagram below shows the effect follo
- June 2017, Paper 1, Q3(b)(ii) (1 mark): producers (1) 3 The Indian government has introduced a subsidy on domestic cooking gas cylinders in the city of Mumbai. The diagram below shows the effect follo
- June 2017, Paper 1, Q3(c) (1 mark): One effect of the subsidy is to increase: (1) A consumer surplus B market failure C public good provision D tax revenue 3 The Indian government has introduced a
- June 2017, Paper 1, Q7 (25 marks): In 2015 a report by Public Health England recommended the imposition of a 20% tax on the sale of soft drinks that contain high levels of sugar. Evaluate the lik
- June 2017, AS Paper 1, Q3(a) (1 mark): Define the term ‘subsidies’. (1) 3 In 2015 the UK government cut subsidies for the installation of solar energy panels.
- June 2017, AS Paper 1, Q3(b) (1 mark): The most likely effect of cutting subsidies for the installation of solar panels is to: (1) A increase producer surplus B decrease the provision of public goods
- June 2017, AS Paper 1, Q3(c) (2 marks): Annotate the diagram below to show the effect of removing the solar panel installation subsidy on the equilibrium price and quantity. (2) 3 In 2015 the UK gover
Questions, mark schemes and examiner’s reports are © Pearson Edexcel, from their published past papers. Plumi isn’t affiliated with any exam board. Want whole papers? Full past papers.
Rather write your answers by hand on iPad? Plumi marks them against the same mark schemes.