 plumi
Statistical charts and diagrams: CAIE IGCSE Maths questions
Every CAIE IGCSE Maths exam question on 9.4 Statistical charts and diagrams, June 2024 and the specimen papers, with its mark scheme and examiner’s report.
Find questions228
All 7 questions on Statistical charts and diagrams, as a list
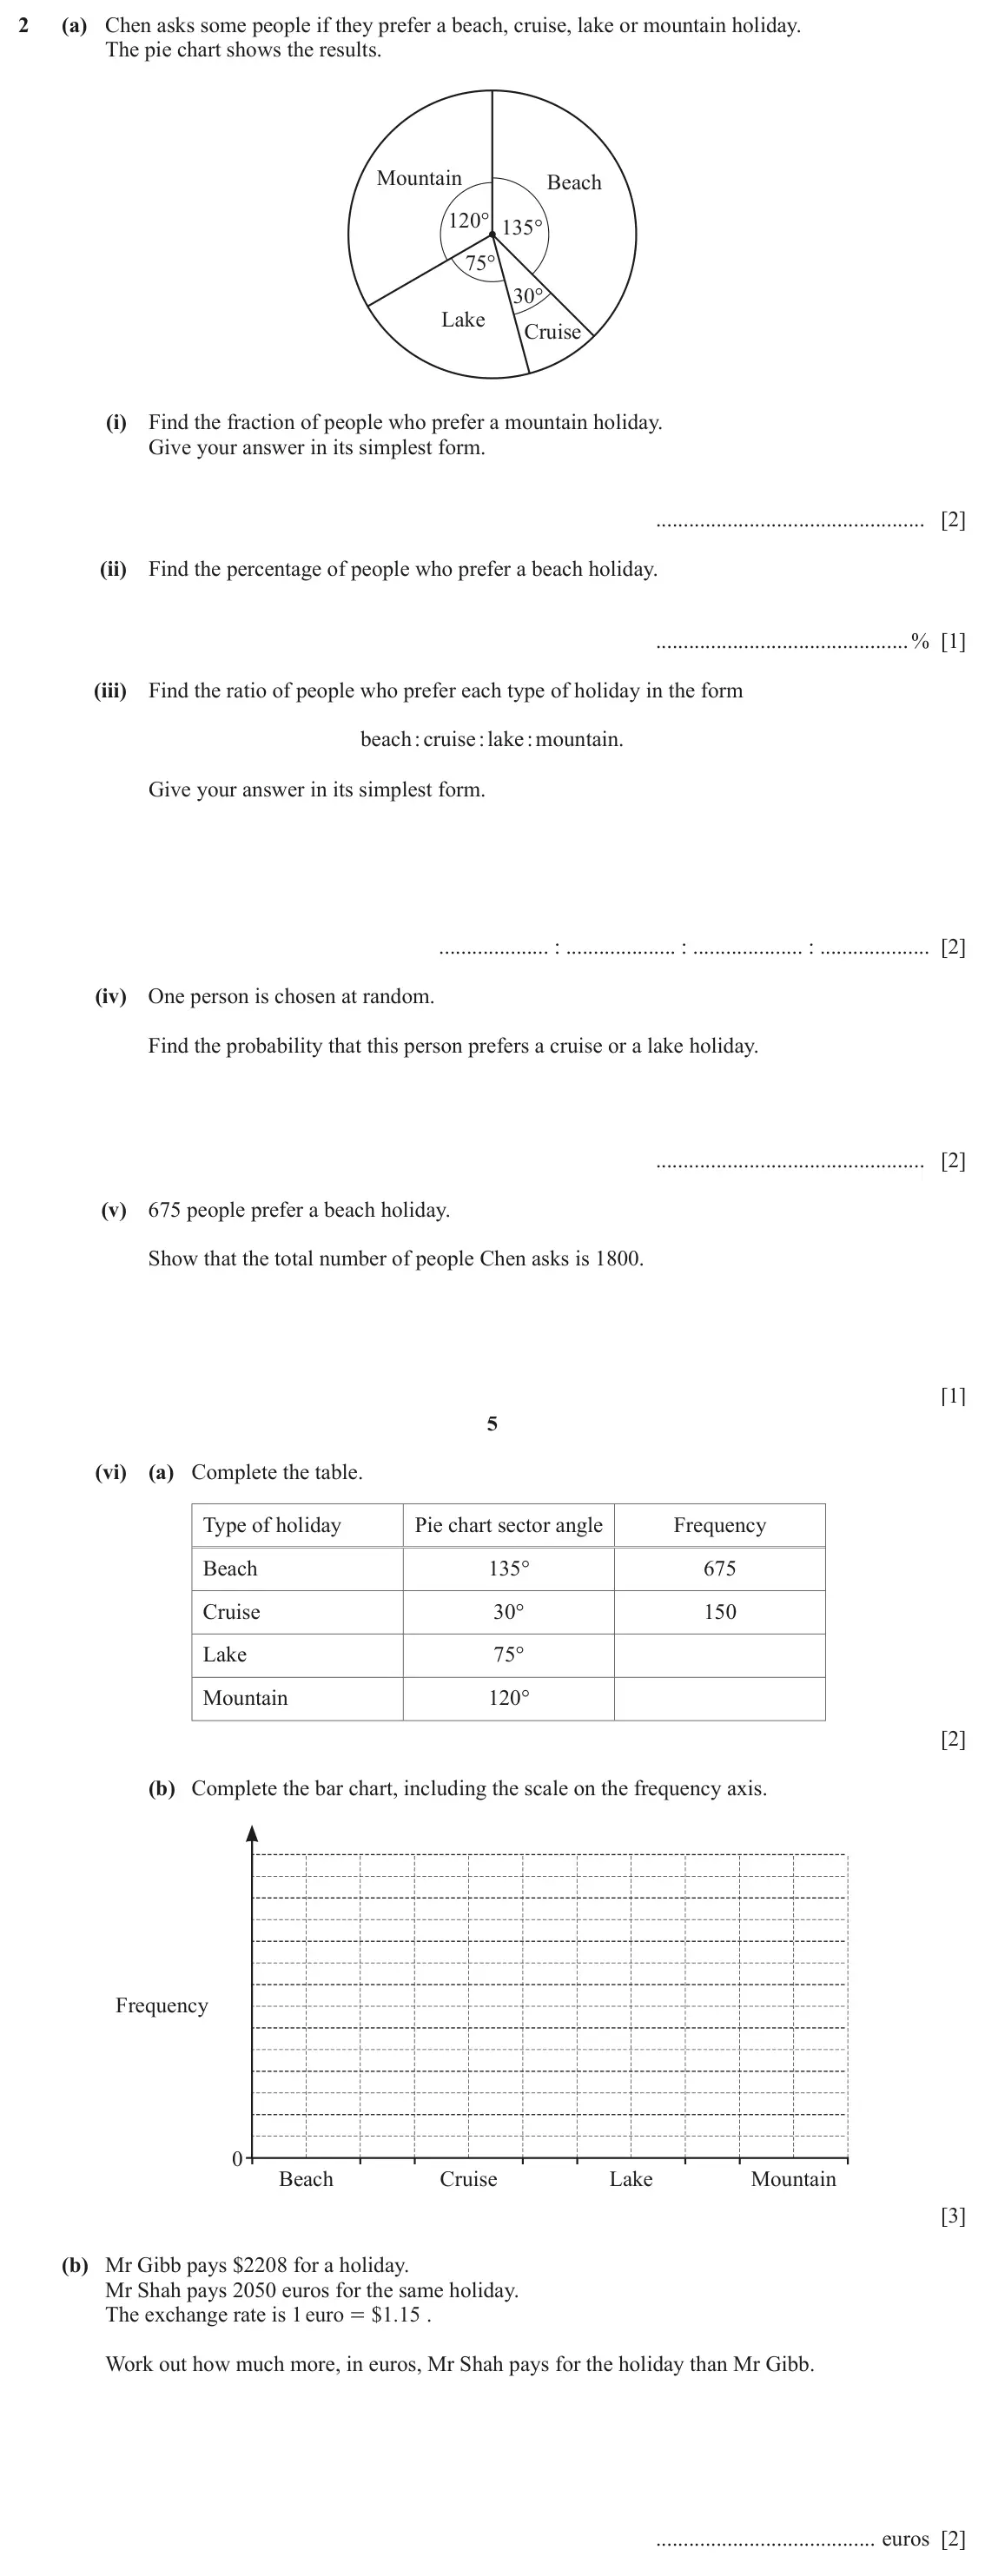
- June 2024, Paper 3, Q2 (15 marks): (a) Chen asks some people if they prefer a beach, cruise, lake or mountain holiday. The pie chart shows the results. Mountain Beach 120° 135° 75° 30° Lake Cruis
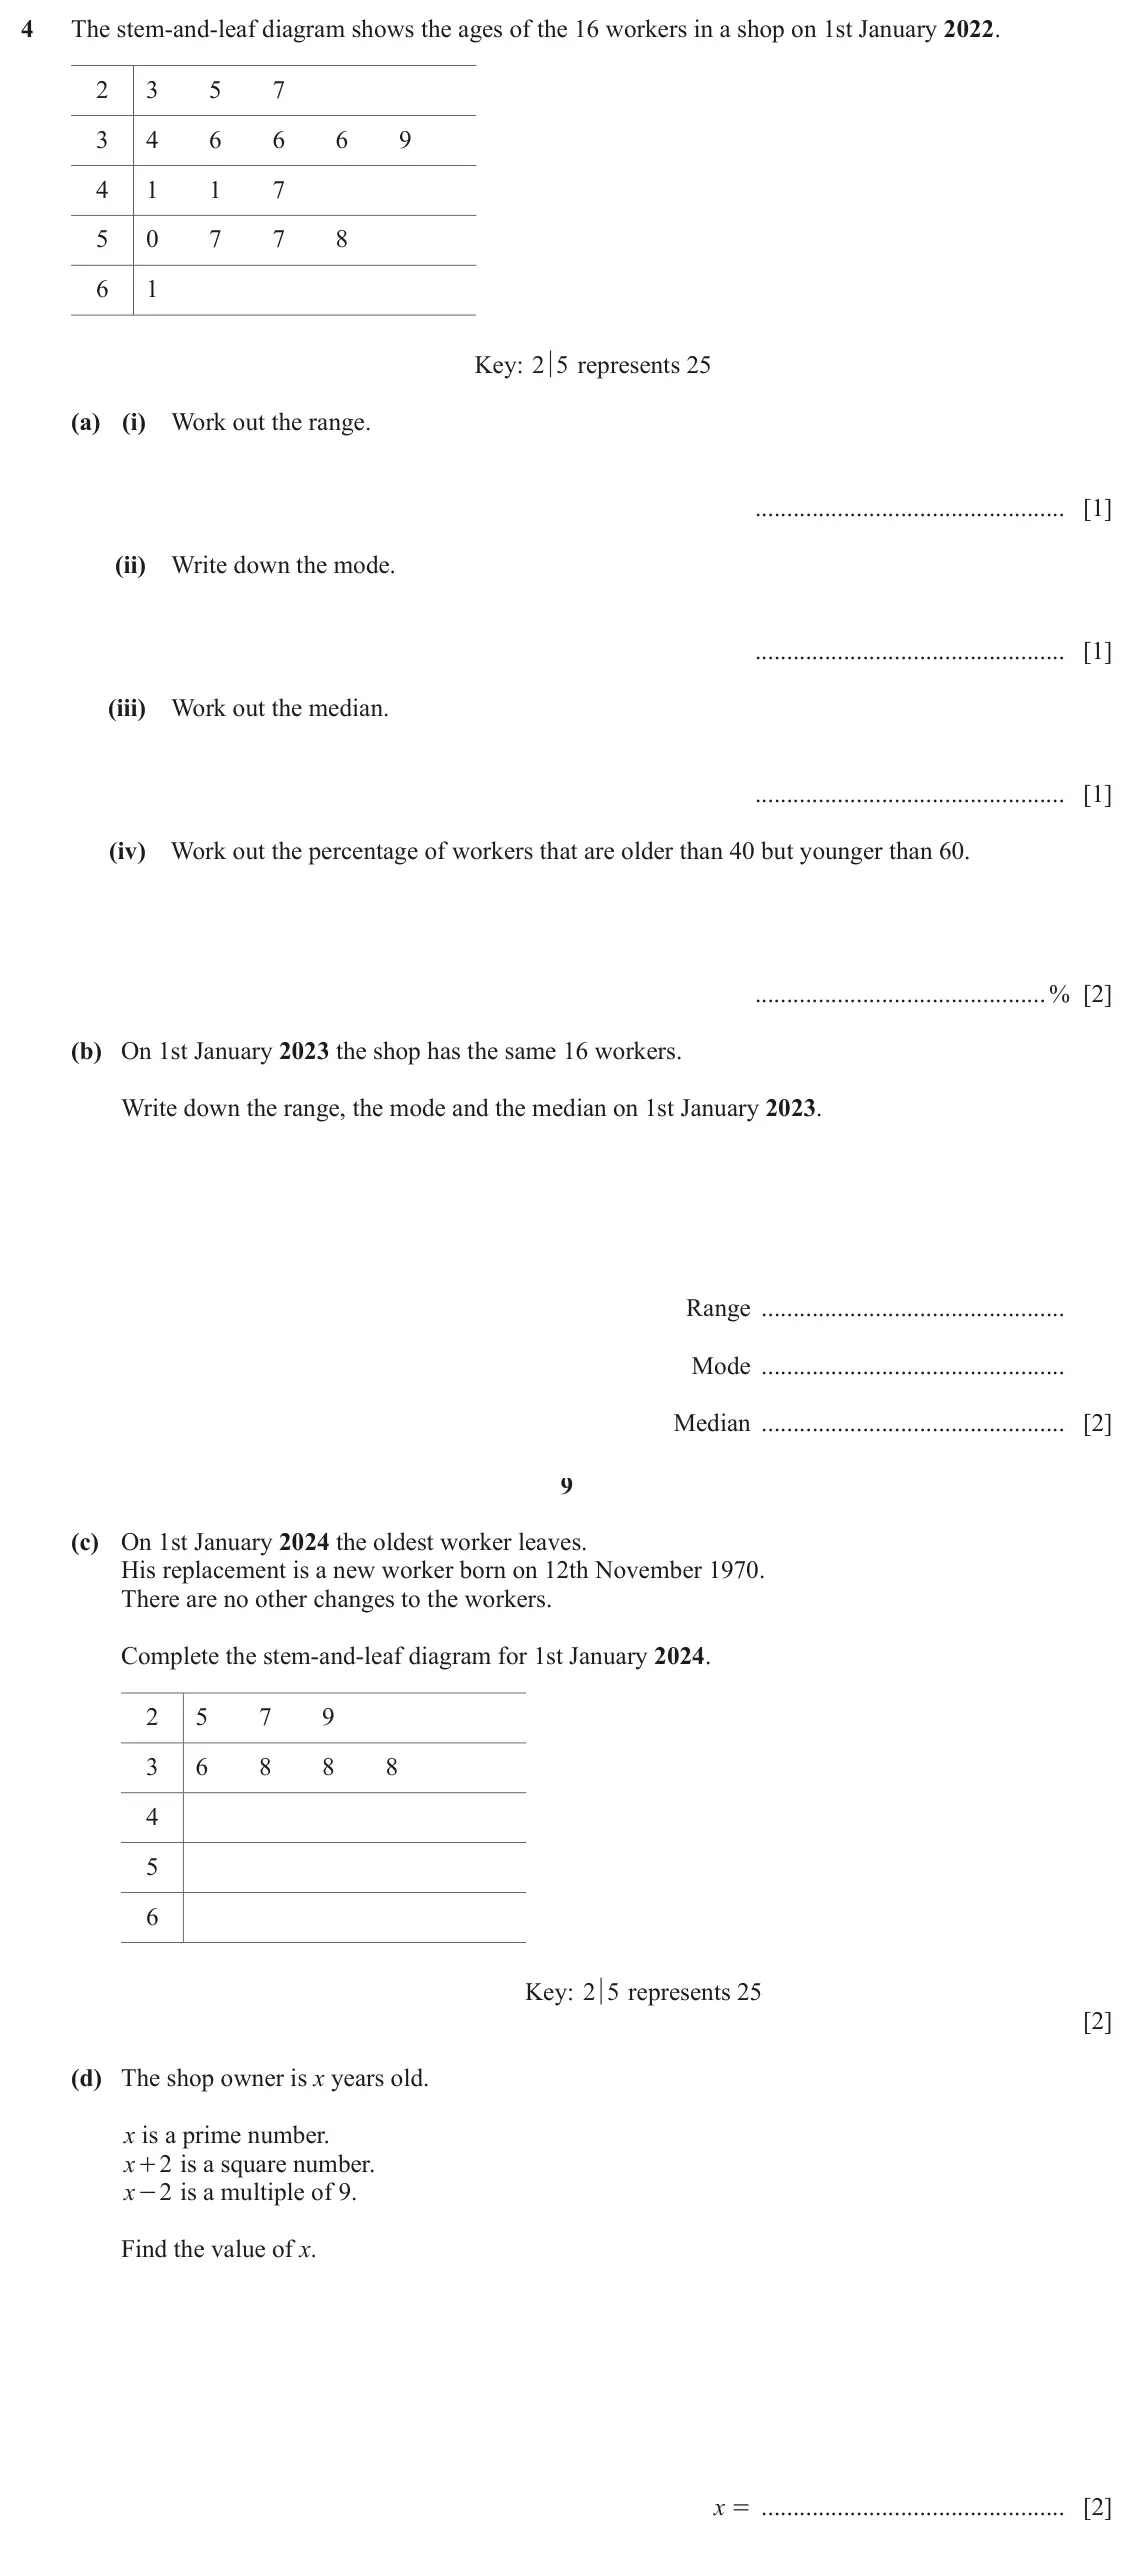
- June 2024, Paper 3, Q4 (11 marks): The stem-and-leaf diagram shows the ages of the 16 workers in a shop on 1st January 2022. 2 3 5 7 3 4 6 6 6 9 4 1 1 7 5 0 7 7 8 6 1 Key: 2 5 represents 25 (a) (
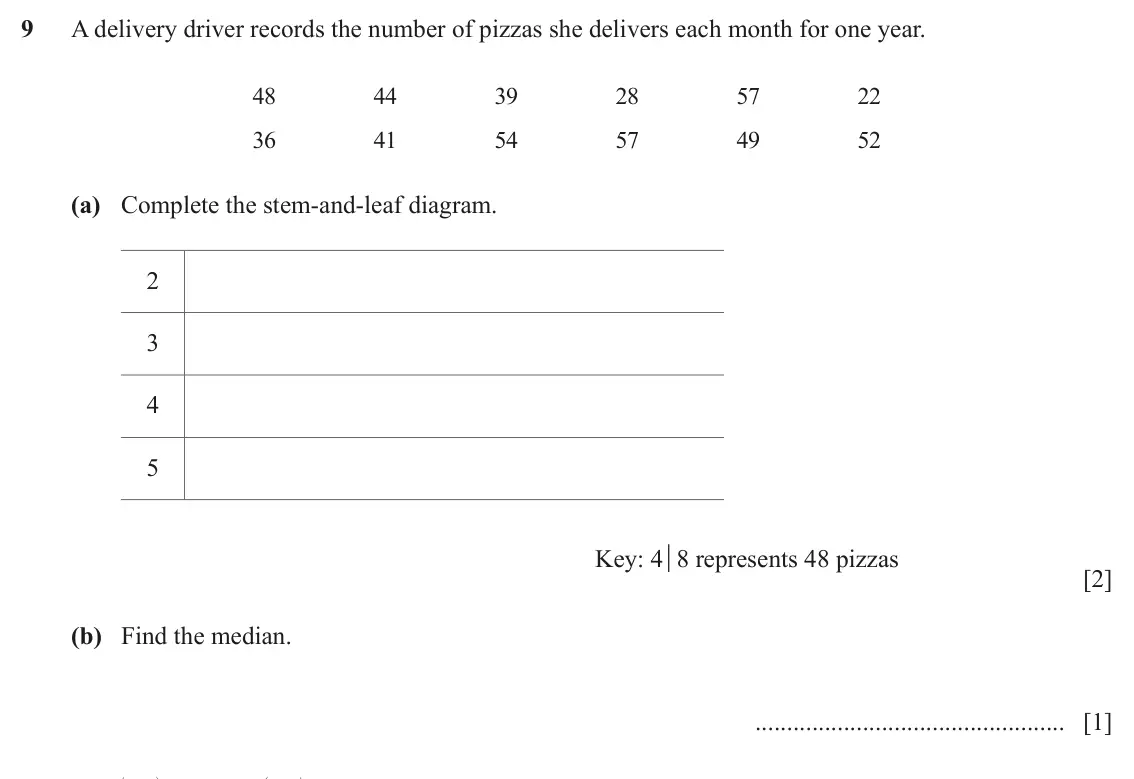
- June 2024 (0980), Paper 1, Q9 (3 marks): A delivery driver records the number of pizzas she delivers each month for one year. 48 44 39 28 57 22 36 41 54 57 49 52 (a) Complete the stem-and-leaf diagram.
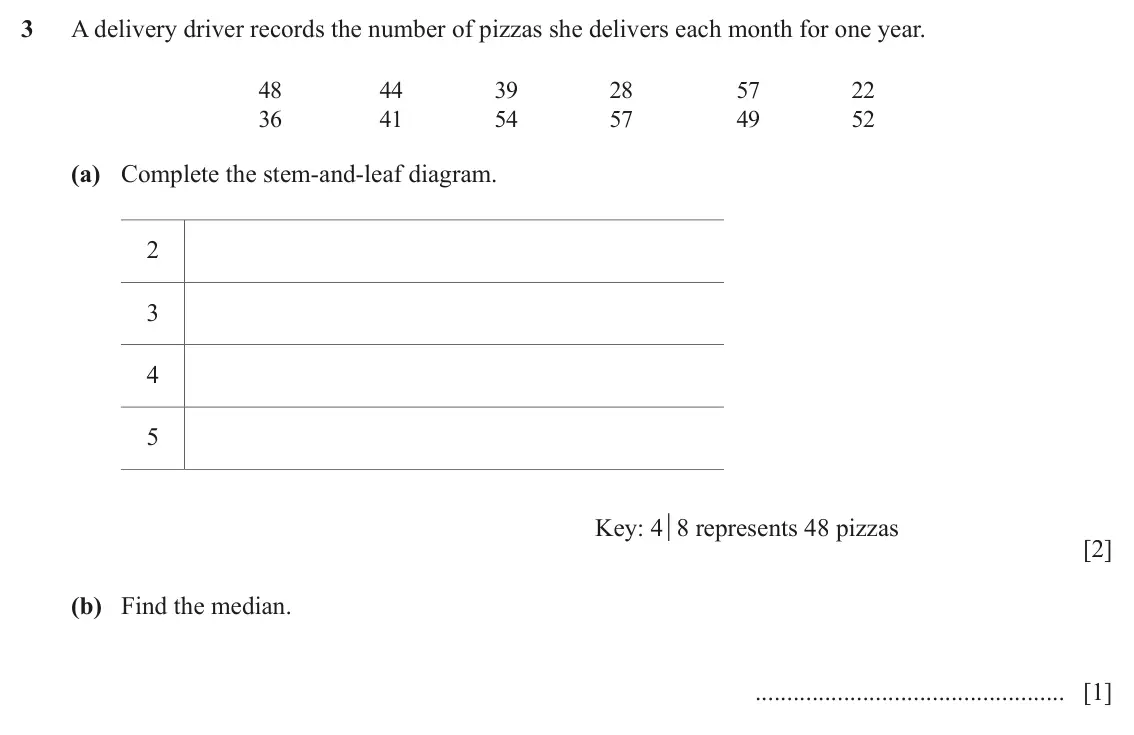
- June 2024 (0980), Paper 2, Q3 (3 marks): A delivery driver records the number of pizzas she delivers each month for one year. 48 44 39 28 57 22 36 41 54 57 49 52 (a) Complete the stem-and-leaf diagram.
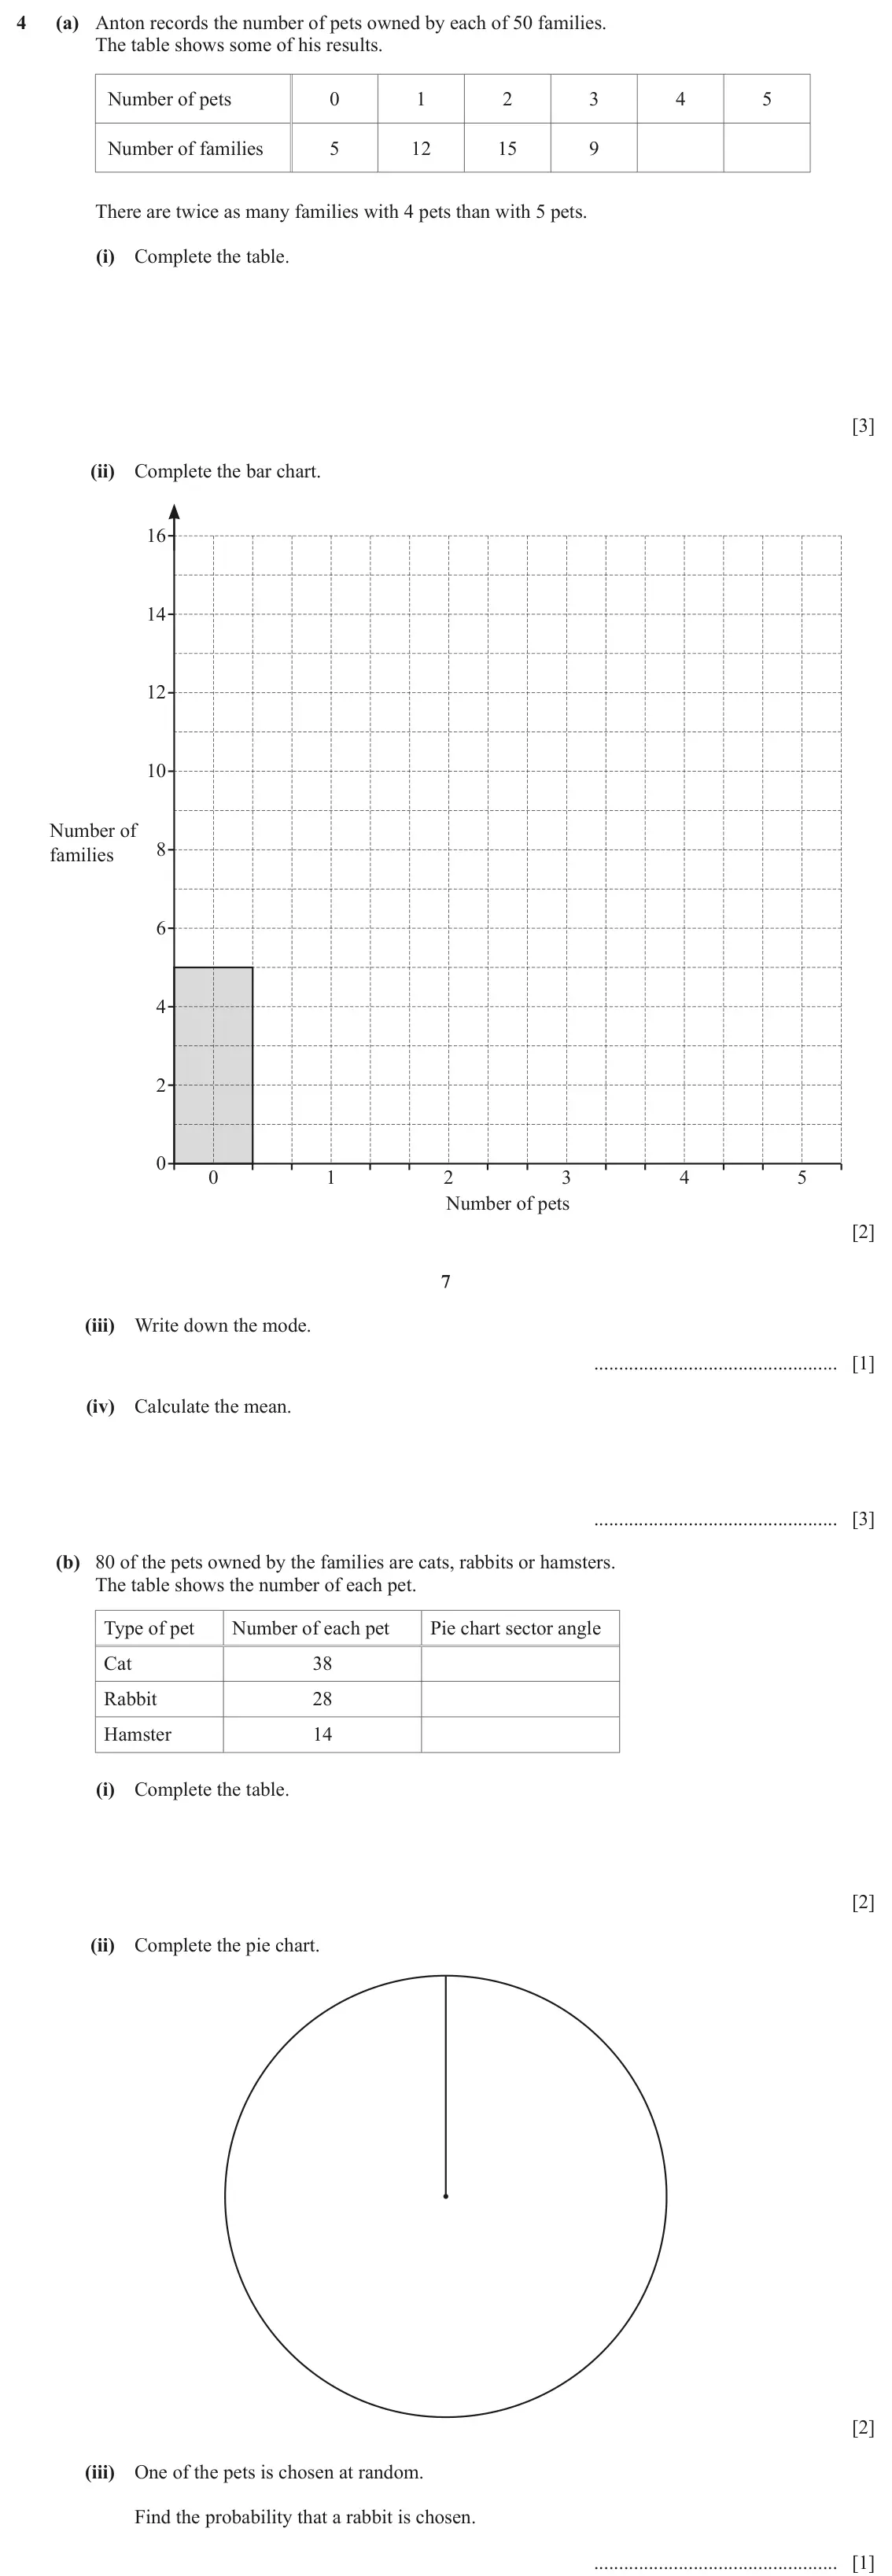
- June 2024 (0980), Paper 3, Q4 (14 marks): (a) Anton records the number of pets owned by each of 50 families. The table shows some of his results. Number of pets 0 1 2 3 4 5 Number of families 5 12 15 9
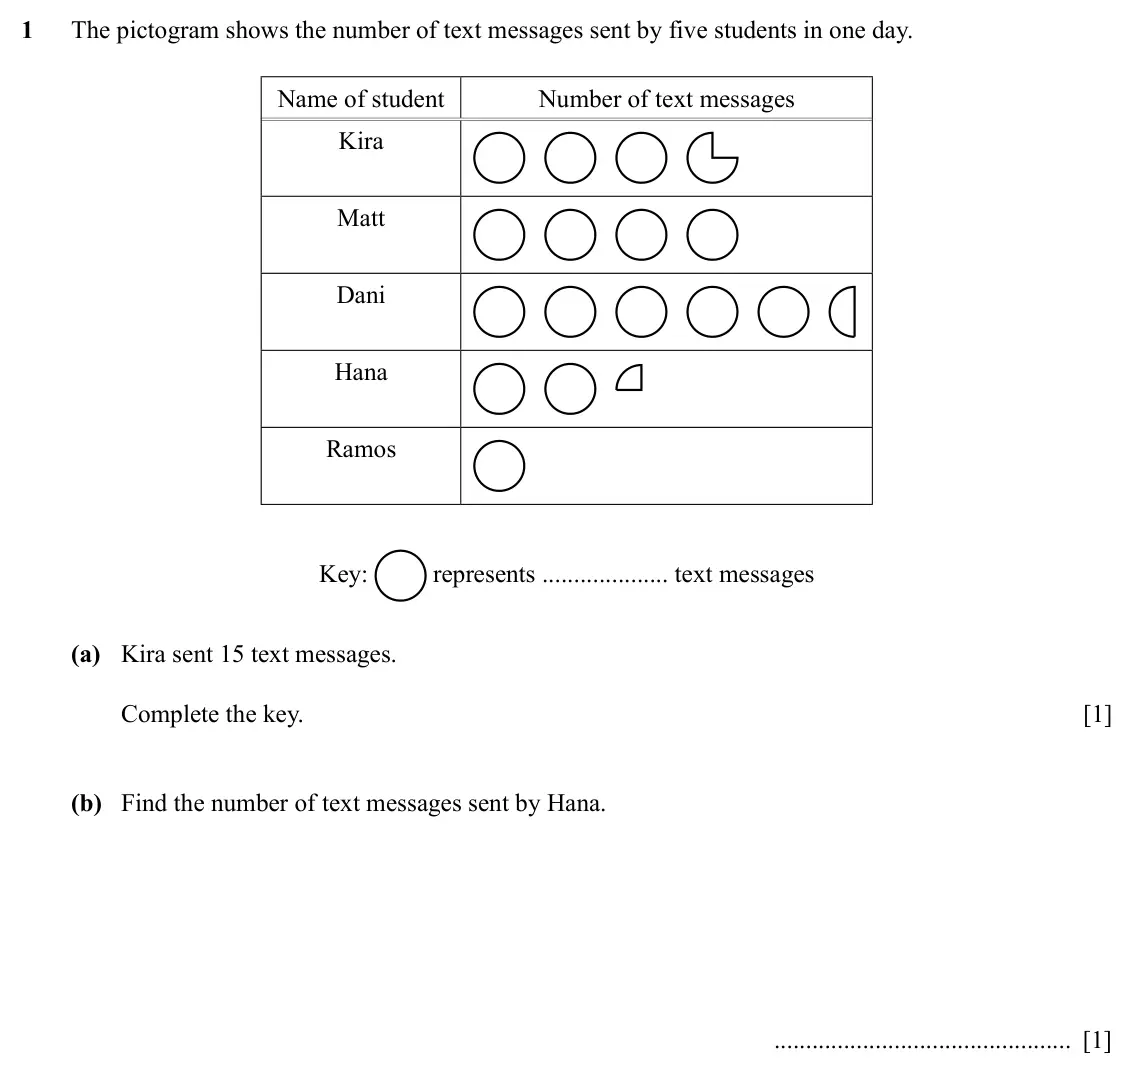
- Specimen, Paper 3, Q1 (2 marks): The pictogram shows the number of text messages sent by five students in one day. Name of student Number of text messages Kira Matt Dani Hana Ramos Key: represe
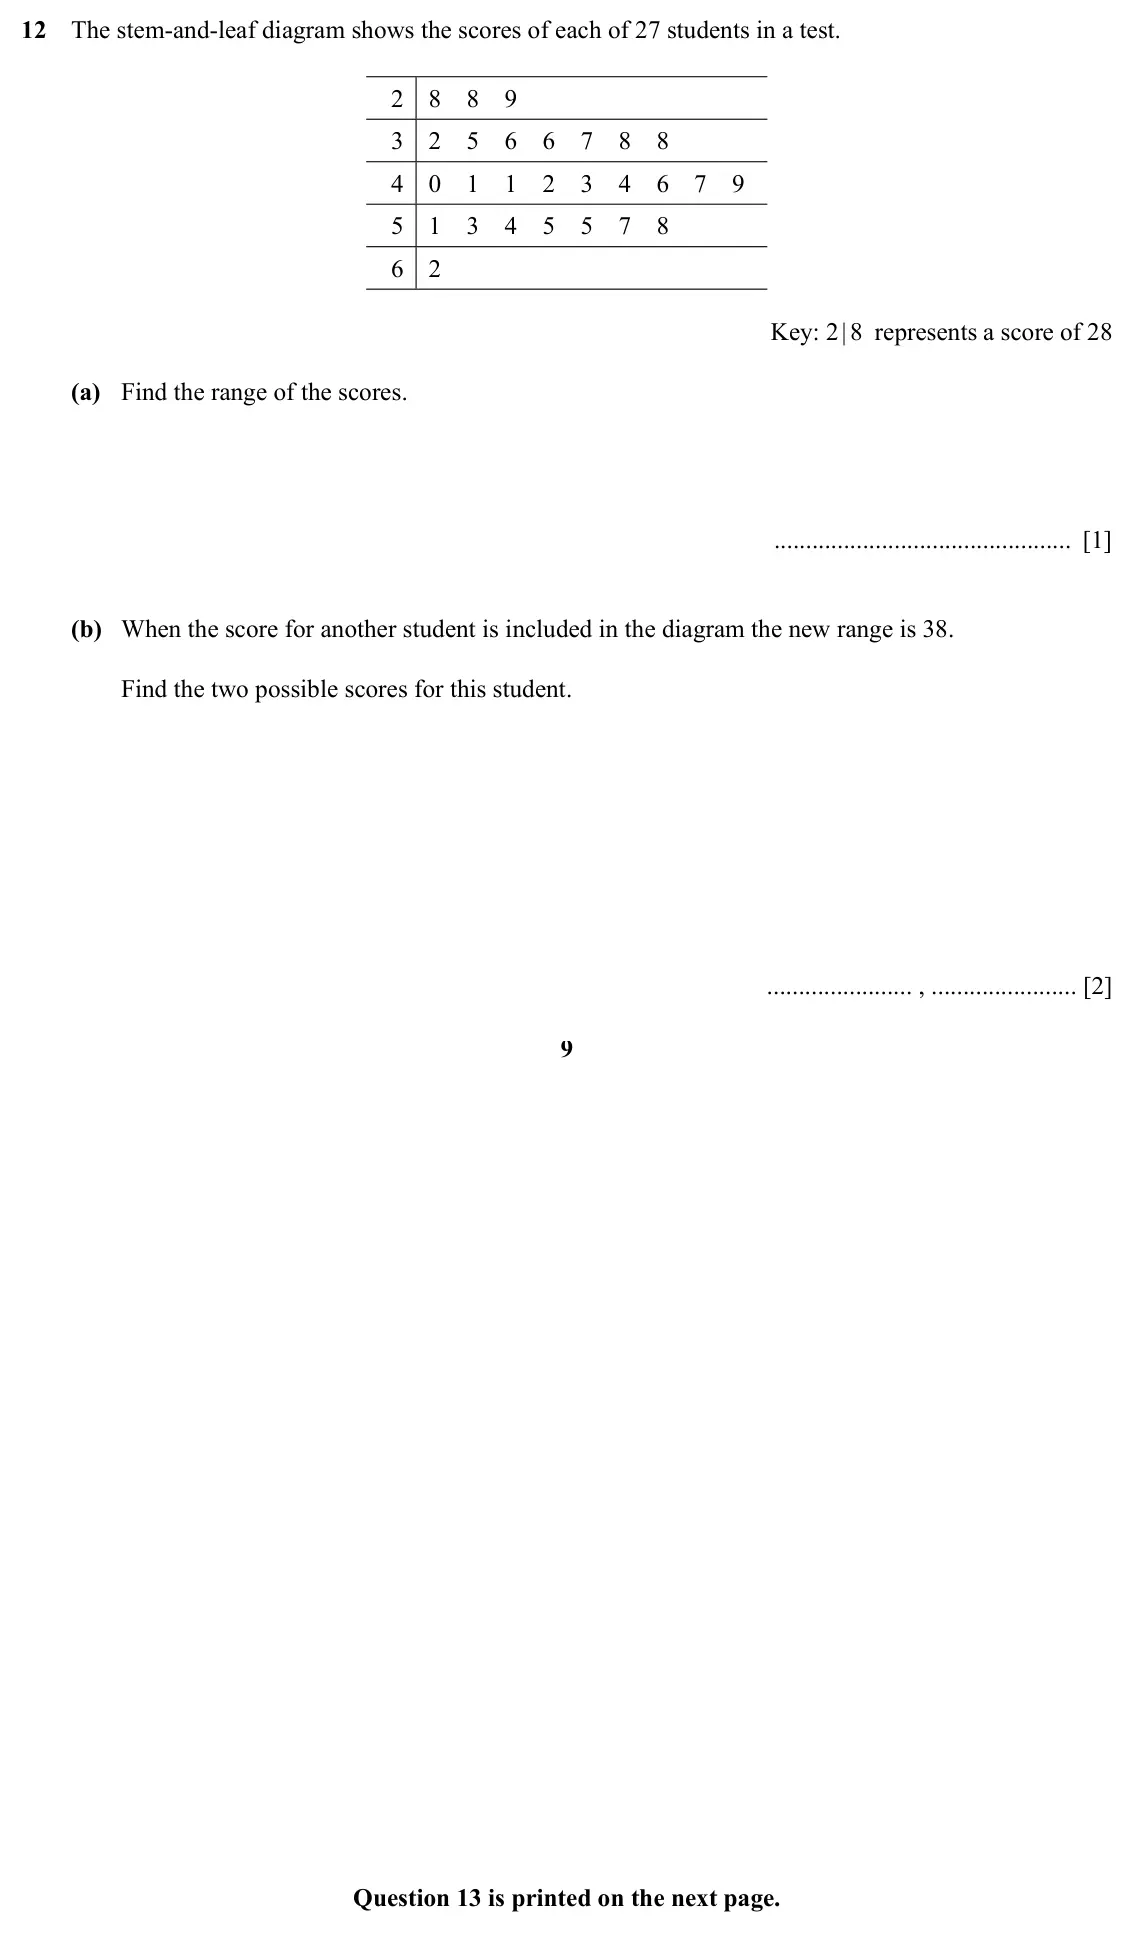
- Specimen, Paper 3, Q12 (3 marks): The stem-and-leaf diagram shows the scores of each of 27 students in a test. 2 8 8 9 3 2 5 6 6 7 8 8 4 0 1 1 2 3 4 6 7 9 5 1 3 4 5 5 7 8 6 2 Key: 2 | 8 represen
Questions, mark schemes and examiner’s reports are © Cambridge University Press & Assessment, from their published past papers. Plumi isn’t affiliated with any exam board. Want whole papers? Every CAIE IGCSE Maths paper.
Rather write your answers by hand on iPad? Plumi marks them against the same mark schemes.