 plumi
Graphs in practical situations: CAIE IGCSE Maths questions
Every CAIE IGCSE Maths exam question on 2.9 Graphs in practical situations, June 2024 and the specimen papers, with its mark scheme and examiner’s report.
Find questions228
All 4 questions on Graphs in practical situations, as a list
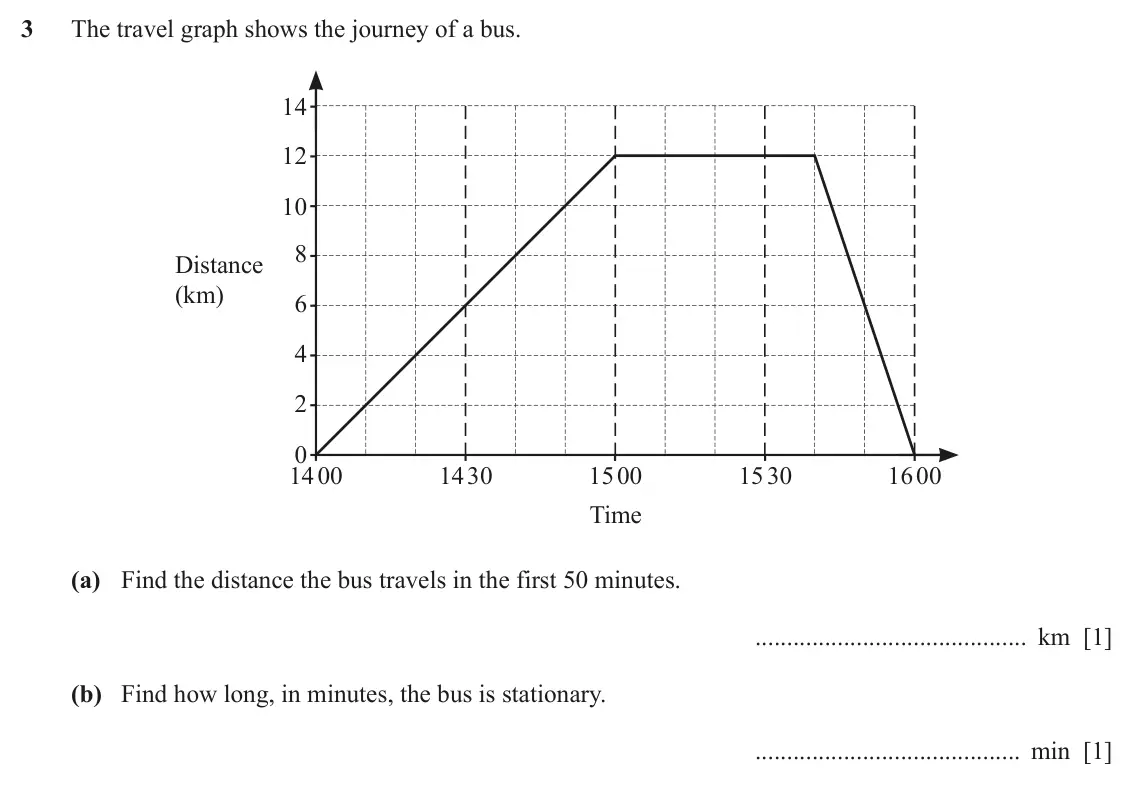
- June 2024, Paper 1, Q3 (2 marks): The travel graph shows the journey of a bus. 14 12 10 8 Distance (km) 6 4 2 0 1400 1430 1500 1530 1600 Time (a) Find the distance the bus travels in the first 5
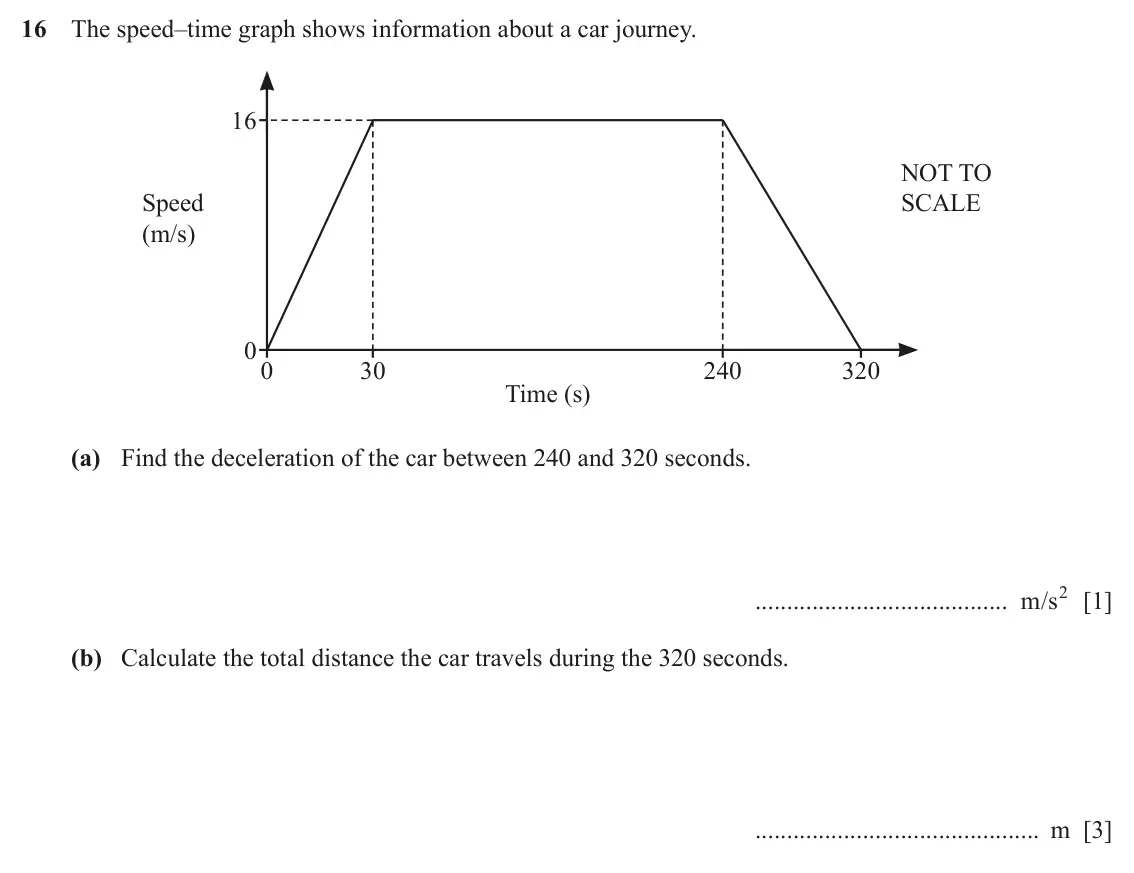
- June 2024 (0980), Paper 2, Q16 (4 marks): The speed–time graph shows information about a car journey. 16 NOT TO Speed SCALE (m/s) 0 0 30 240 320 Time (s) (a) Find the deceleration of the car between 240
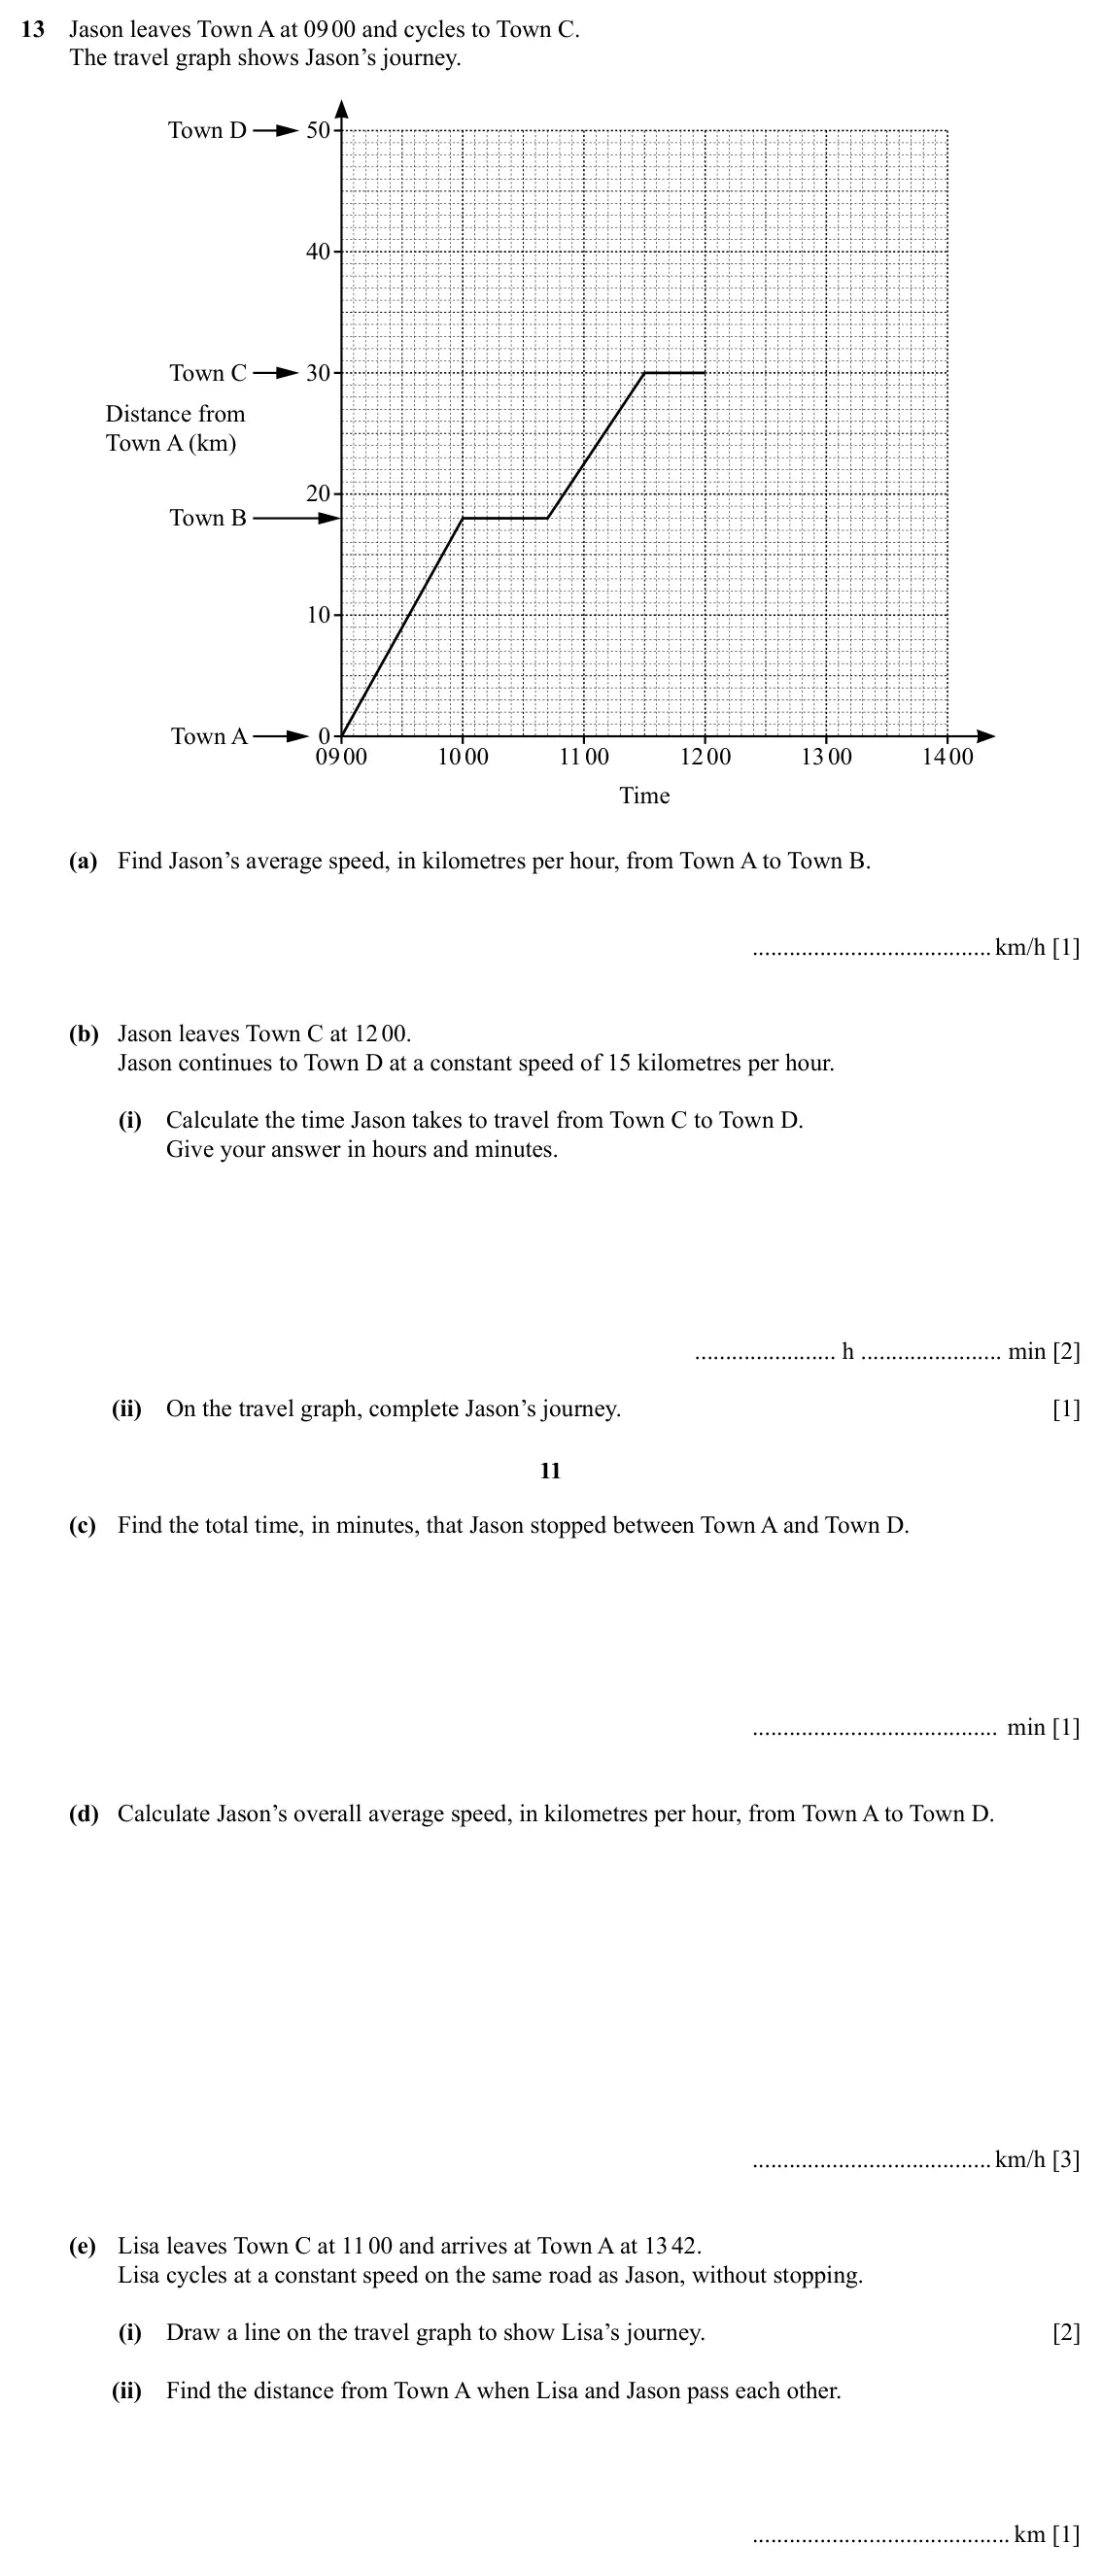
- Specimen, Paper 3, Q13 (11 marks): Jason leaves Town A at 09 00 and cycles to Town C. The travel graph shows Jason’s journey. Town D 50 40 Town C 30 Distance from Town A (km) 20 Town B 10 Town A
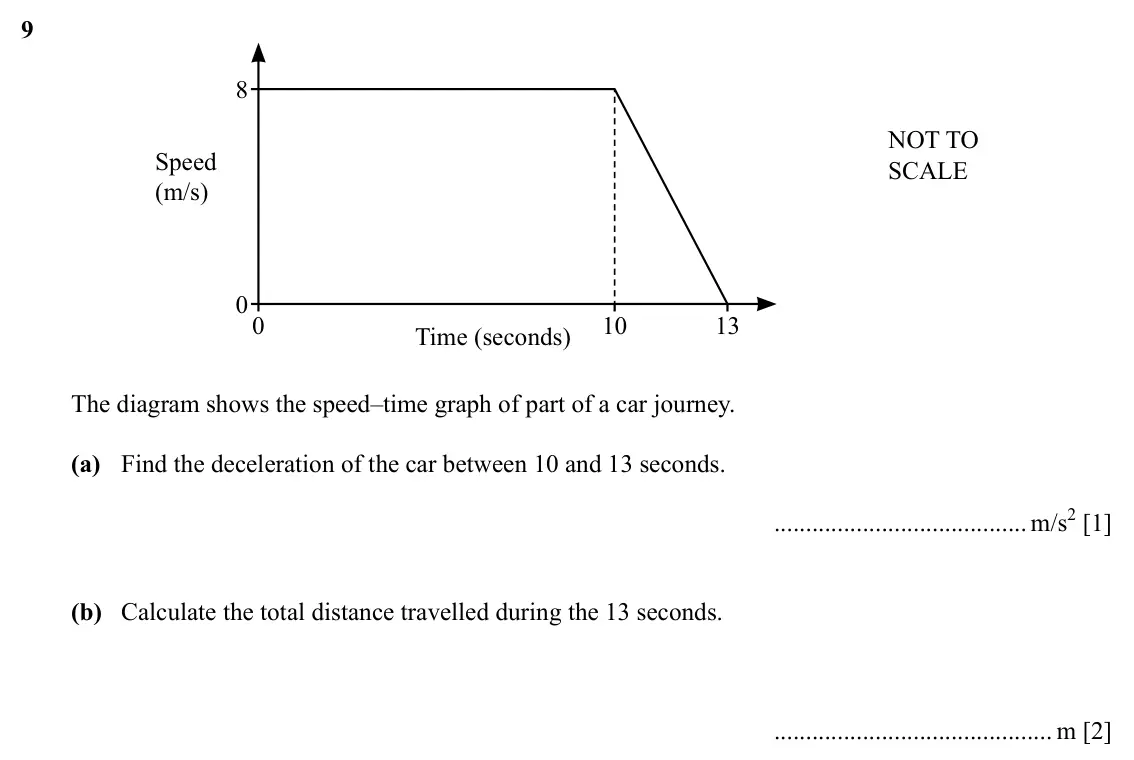
- Specimen, Paper 4, Q9 (3 marks): 8 NOT TO Speed SCALE (m/s) 0 0 10 13 Time (seconds) The diagram shows the speed–time graph of part of a car journey. (a) Find the deceleration of the car betwee
Questions, mark schemes and examiner’s reports are © Cambridge University Press & Assessment, from their published past papers. Plumi isn’t affiliated with any exam board. Want whole papers? Every CAIE IGCSE Maths paper.
Rather write your answers by hand on iPad? Plumi marks them against the same mark schemes.