 plumi
Representing data diagrammatically: AQA Level 3 Core Maths questions
AQA Level 3 Core Maths past-paper questions on D4 Representing data diagrammatically, 2016–2025, with mark schemes and examiner’s reports where available.
Paper
All papers
Exam
All years
Loading the full question list…
All 16 questions on Representing data diagrammatically, as a list
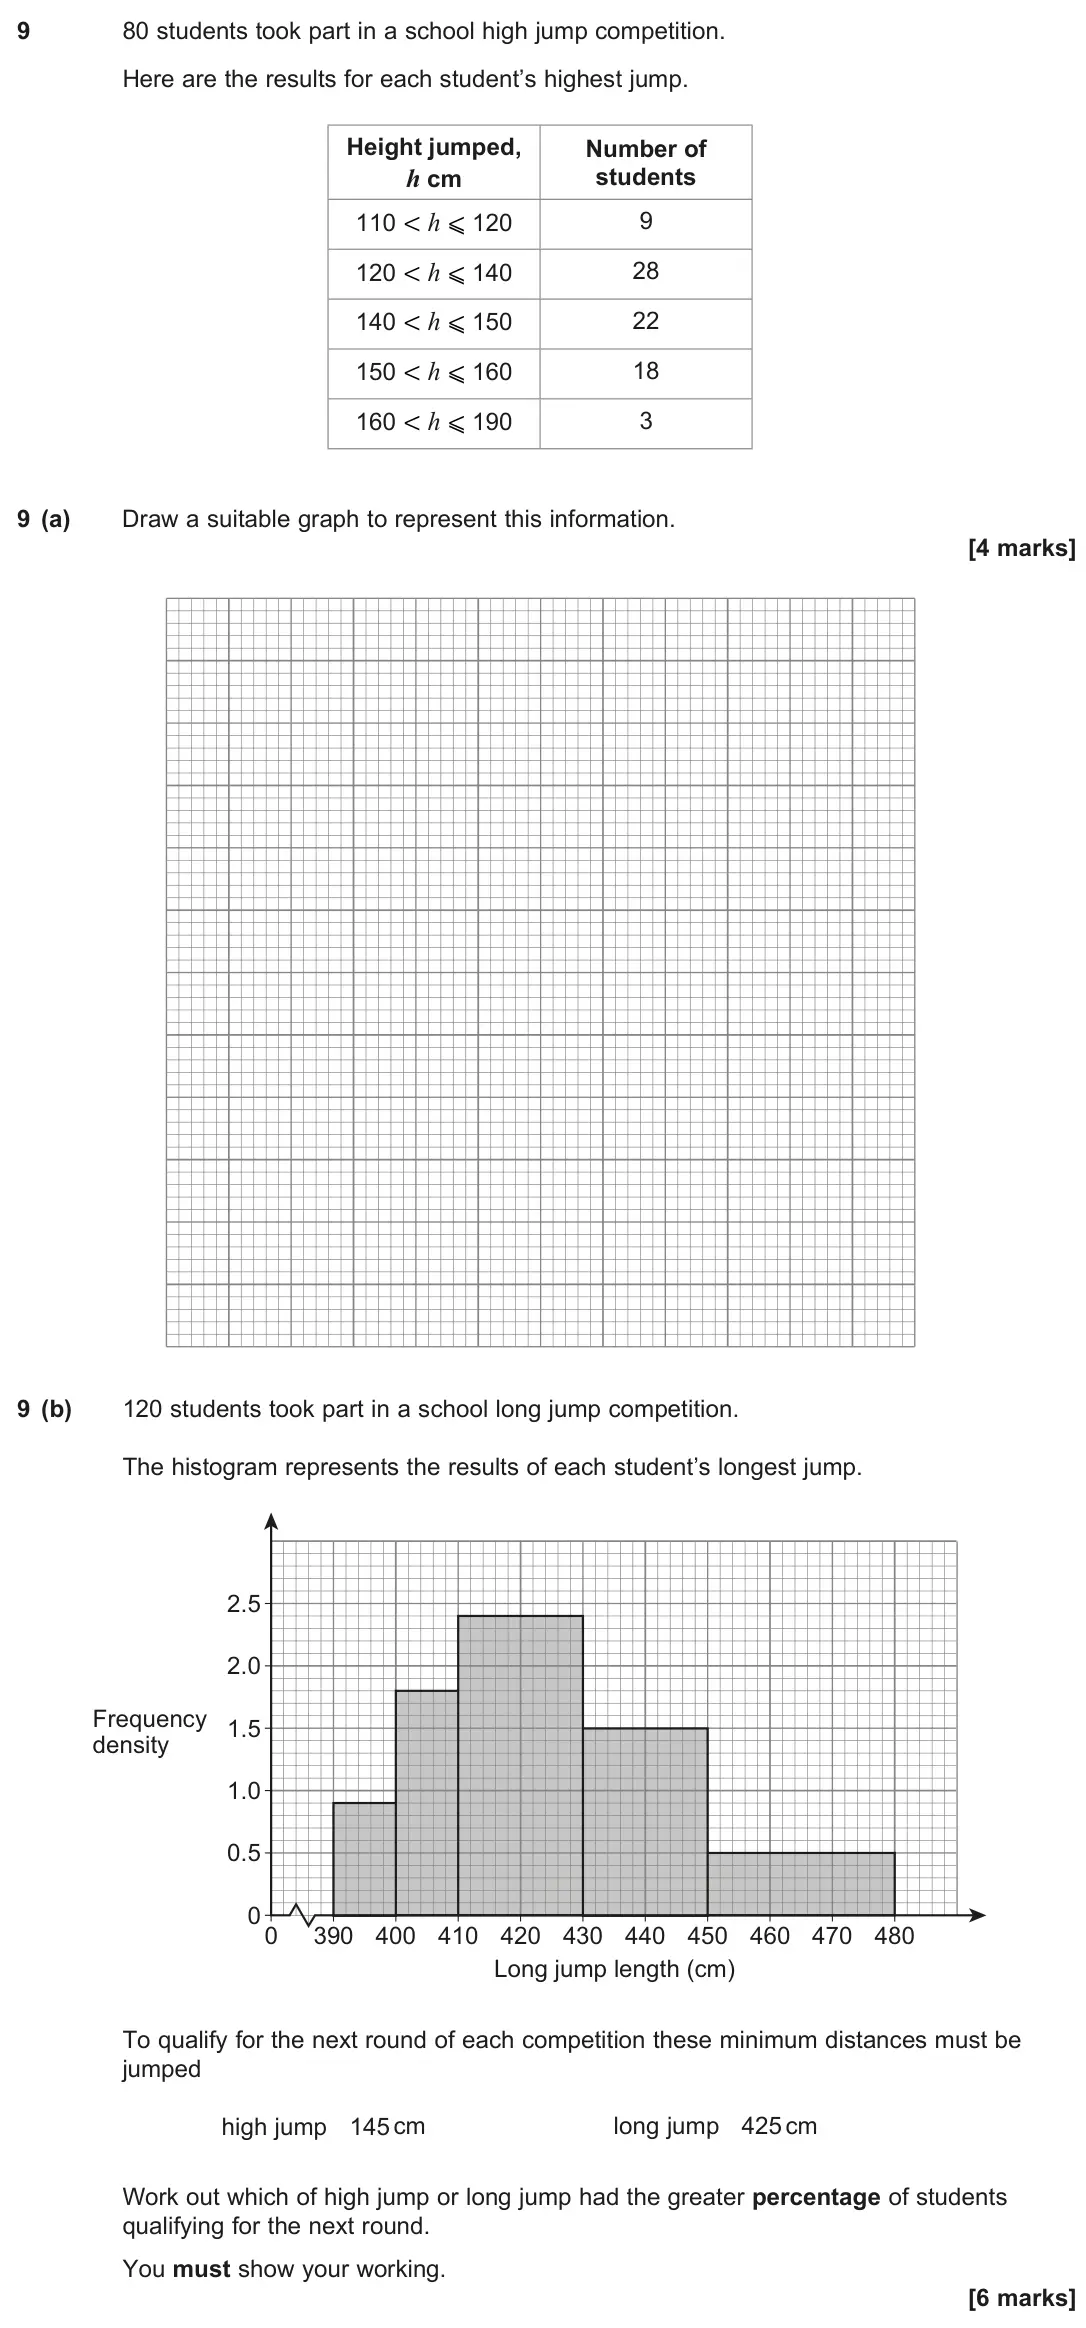
- June 2025, Paper 1, Q9 (10 marks): 80 students took part in a school high jump competition. Here are the results for each student’s highest jump. Height jumped, h cm Number of students 110 < h ⩽
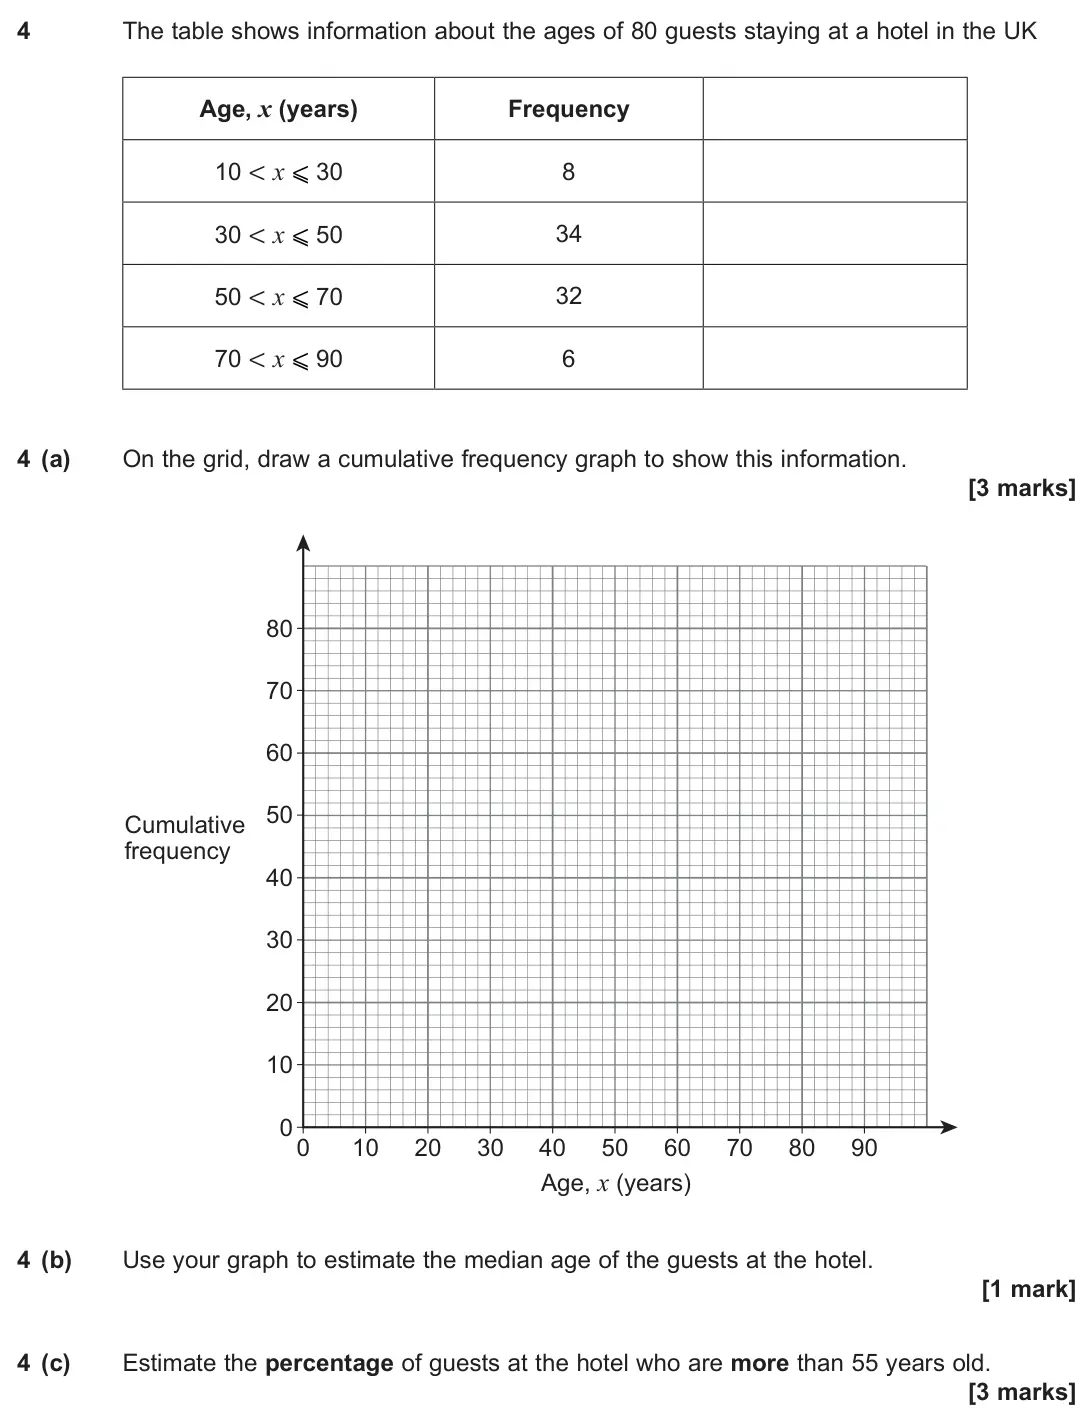
- June 2024, Paper 1, Q4 (7 marks): The table shows information about the ages of 80 guests staying at a hotel in the UK Age, x (years) Frequency 10 < x ⩽ 30 8 30 < x ⩽ 50 34 50 < x ⩽ 70 32 70 < x
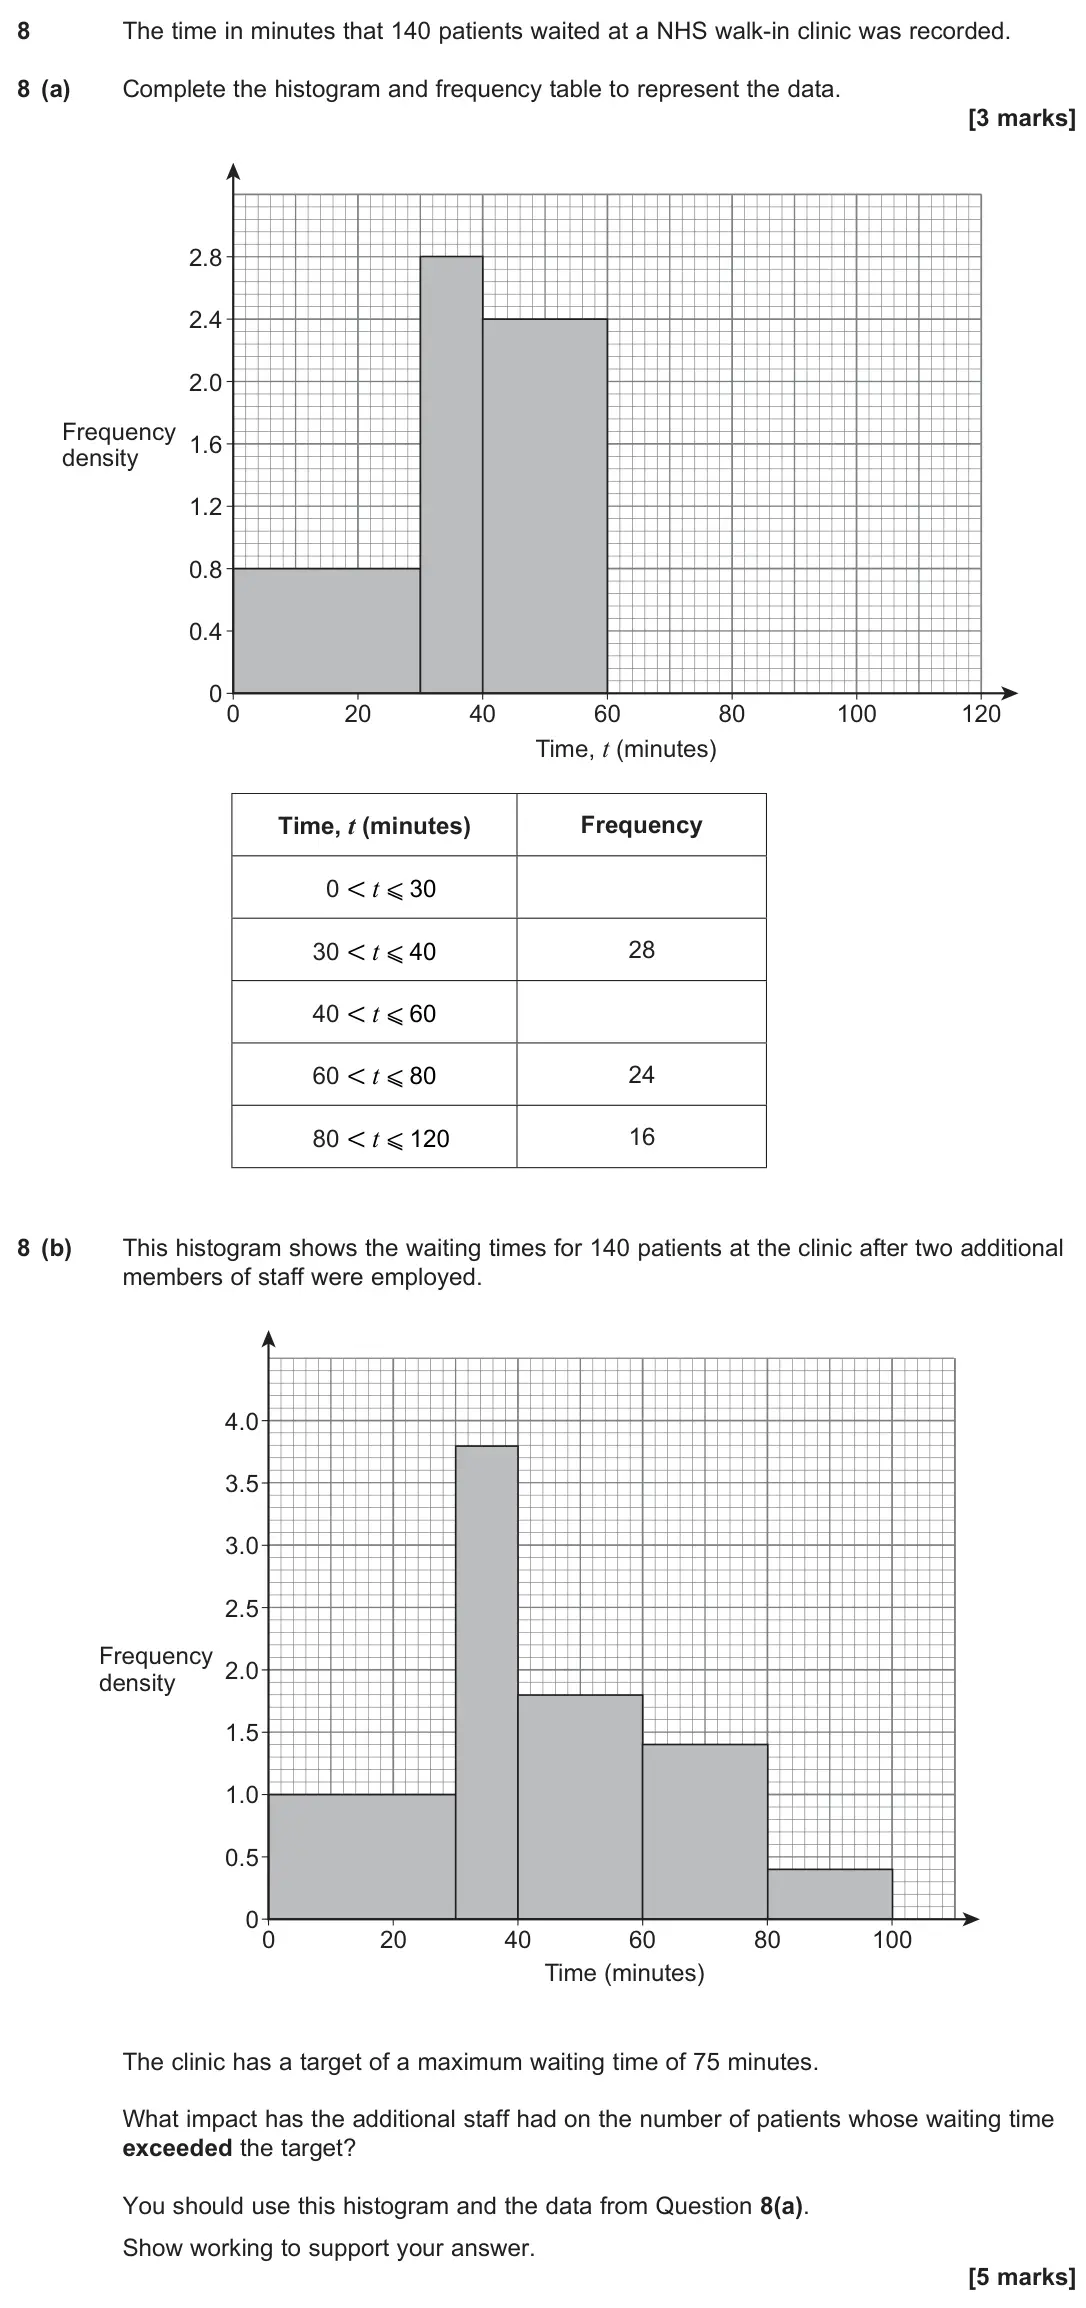
- June 2024, Paper 1, Q8 (8 marks): The time in minutes that 140 patients waited at a NHS walk-in clinic was recorded. 8 (a) Complete the histogram and frequency table to represent the data. 40 60
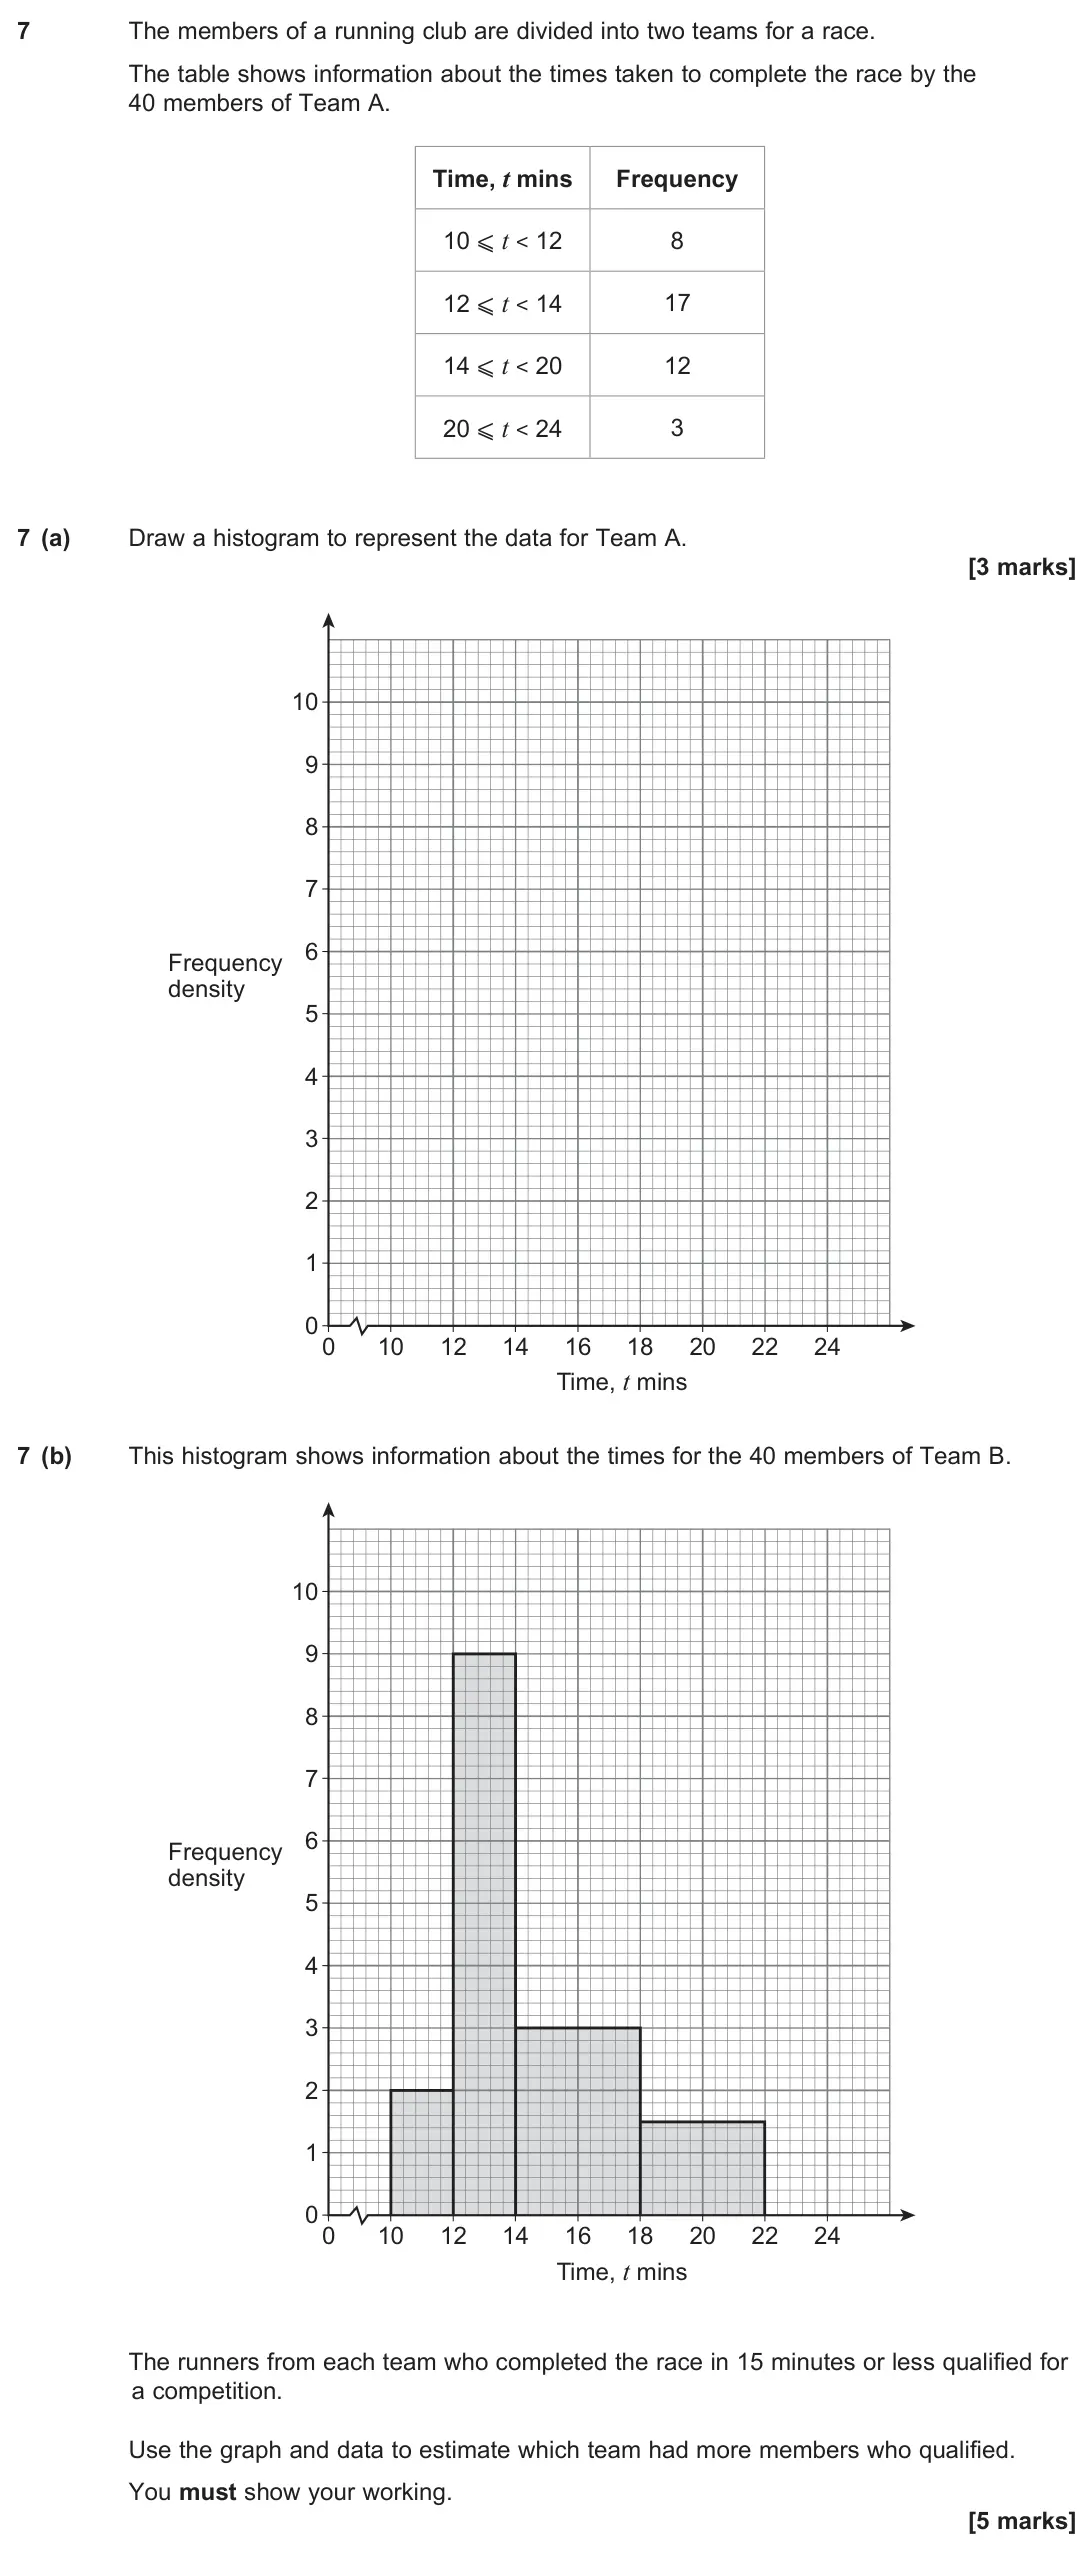
- June 2023, Paper 1, Q7 (8 marks): The members of a running club are divided into two teams for a race. The table shows information about the times taken to complete the race by the 40 members of
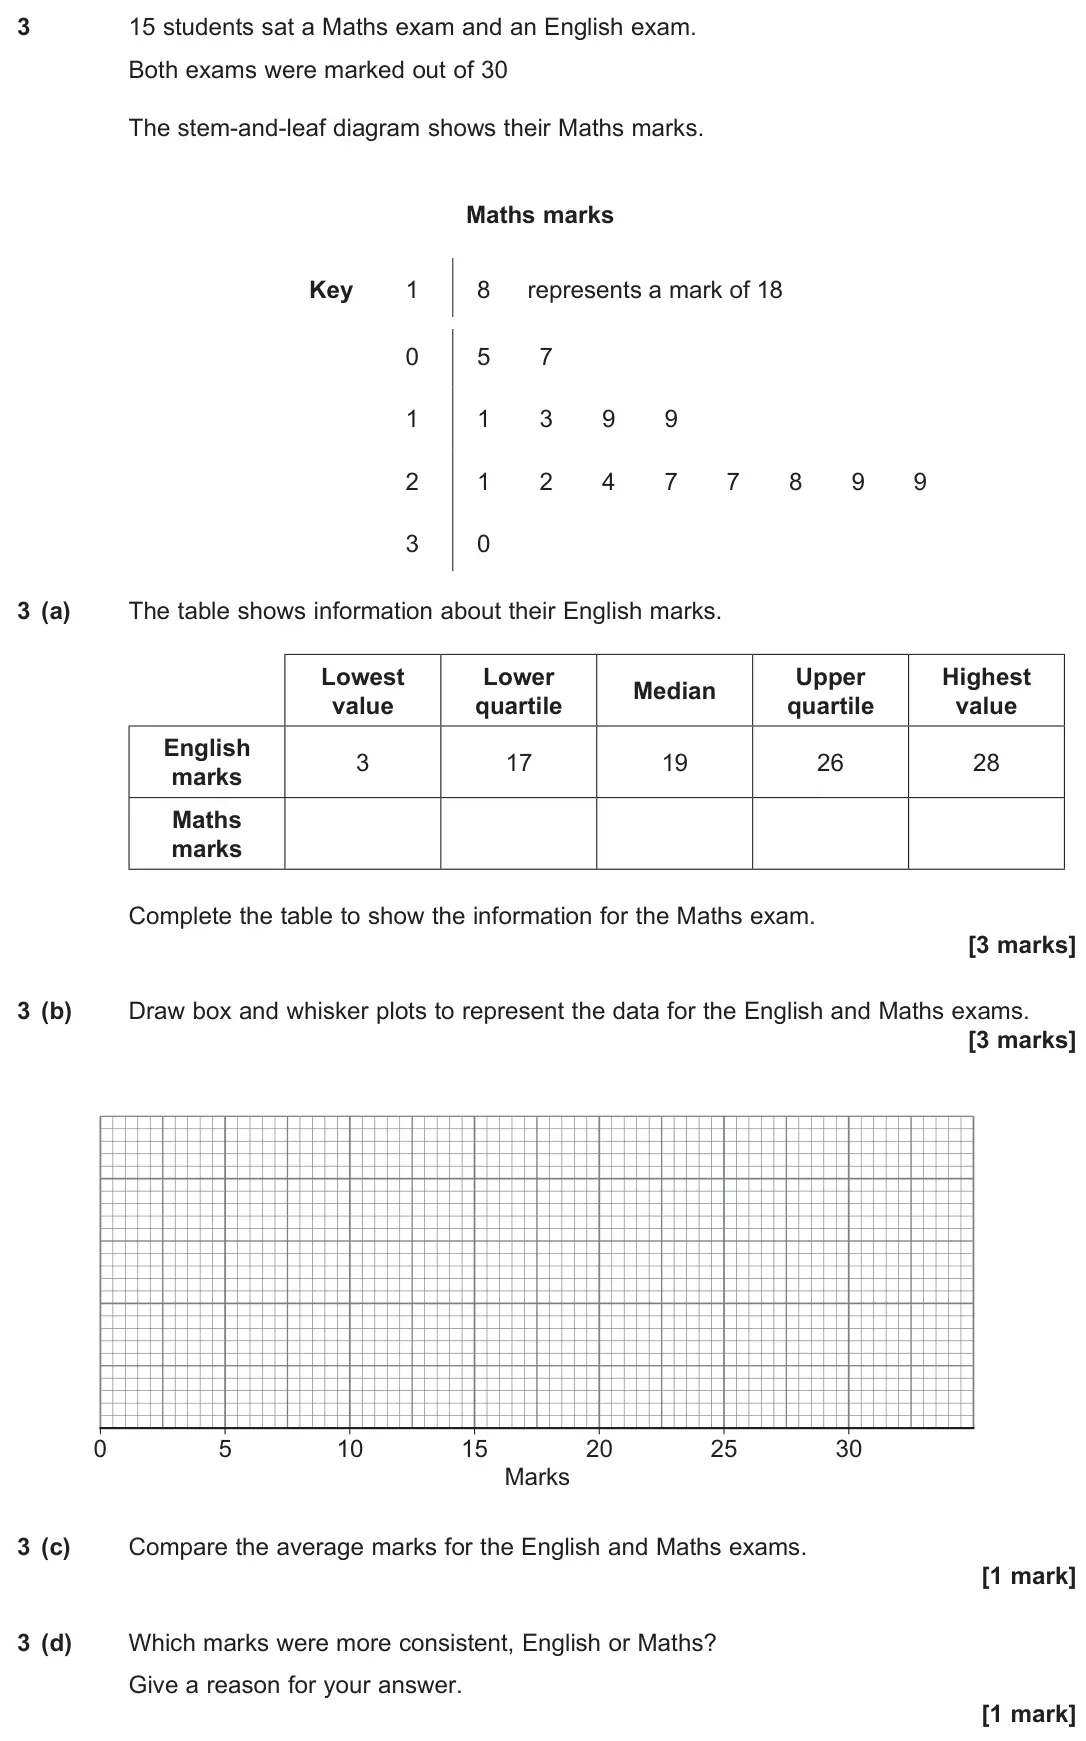
- June 2022, Paper 1, Q3 (8 marks): 15 students sat a Maths exam and an English exam. Both exams were marked out of 30 The stem-and-leaf diagram shows their Maths marks. Maths marks Key 1 8 repres
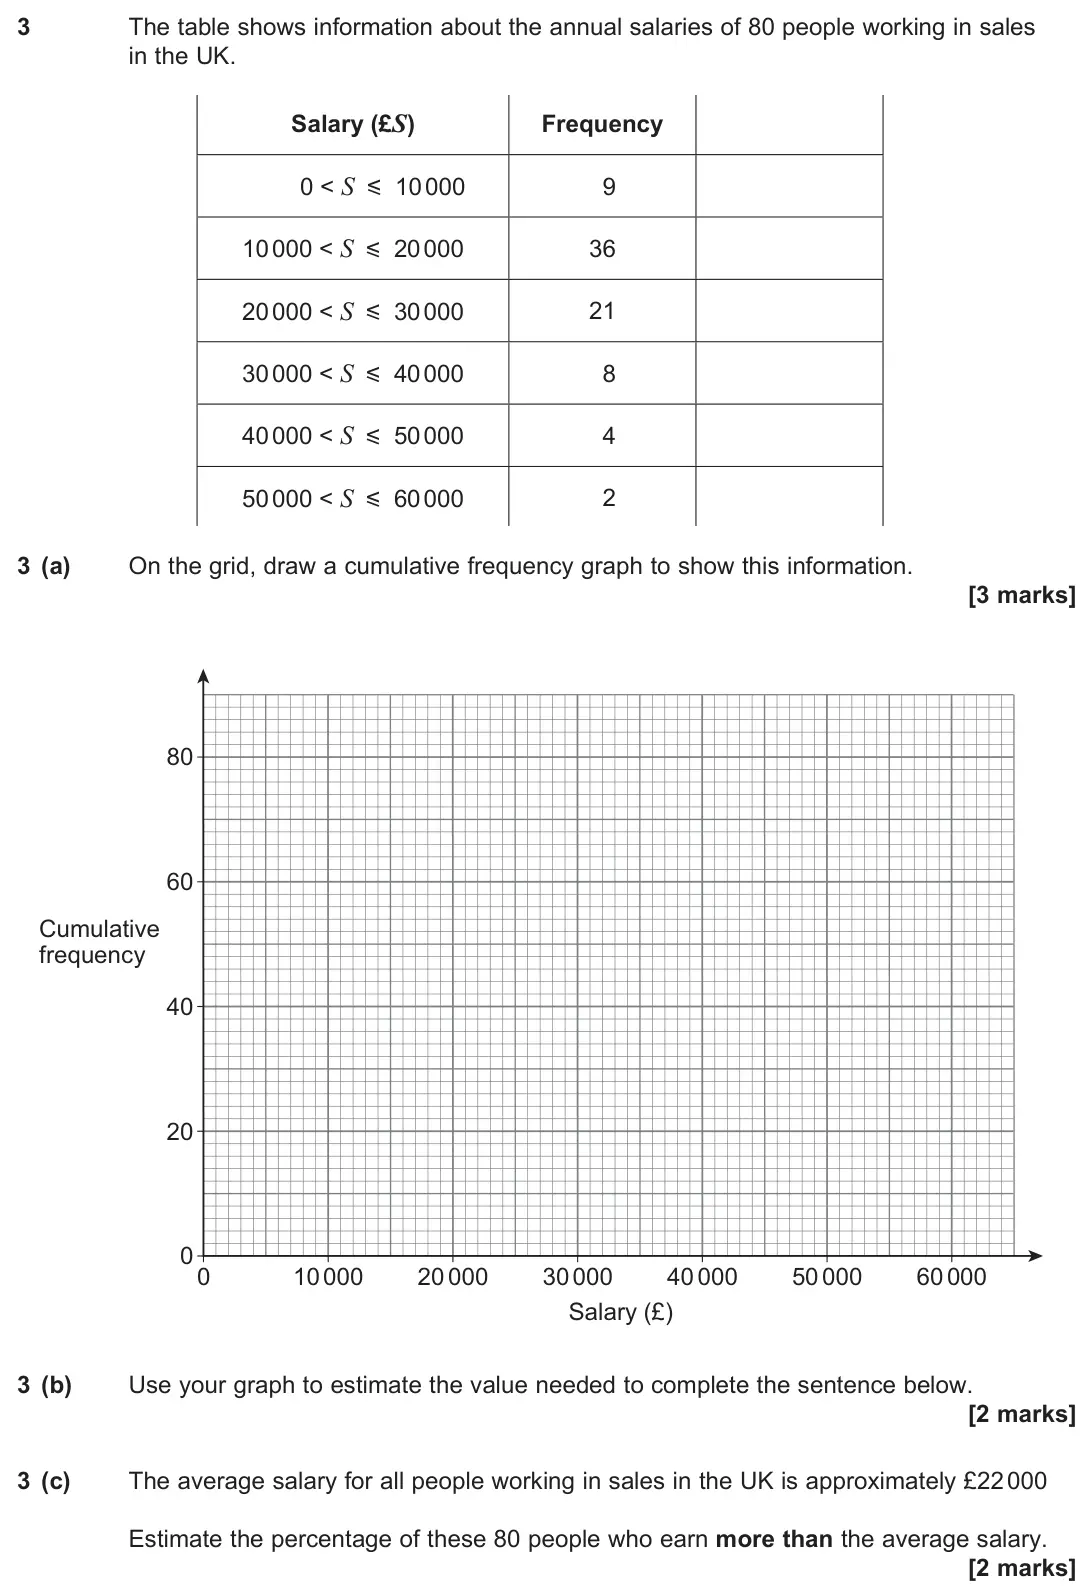
- November 2021, Paper 1, Q3 (7 marks): The table shows information about the annual salaries of 80 people working in sales in the UK. Salary (£S) Frequency 0 < S v 10 000 9 10 000 < S v 20 000 36 20
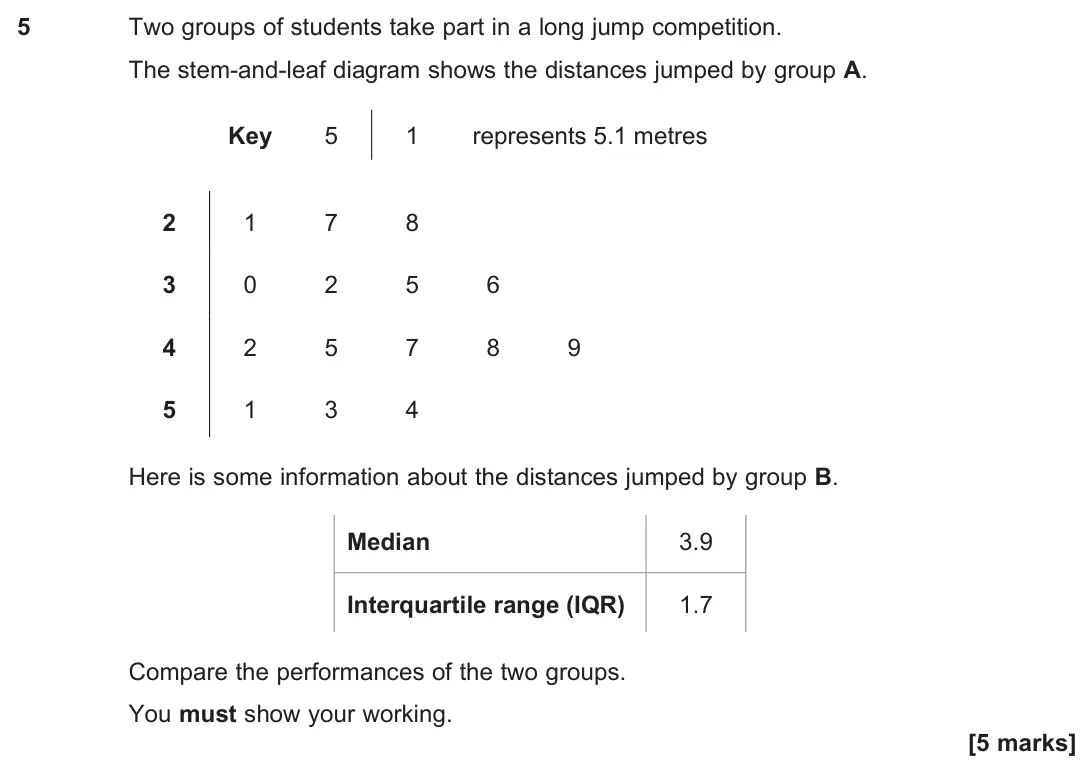
- November 2021, Paper 1, Q5 (5 marks): Two groups of students take part in a long jump competition. The stem-and-leaf diagram shows the distances jumped by group A. Key 5 1 represents 5.1 metres 2 1
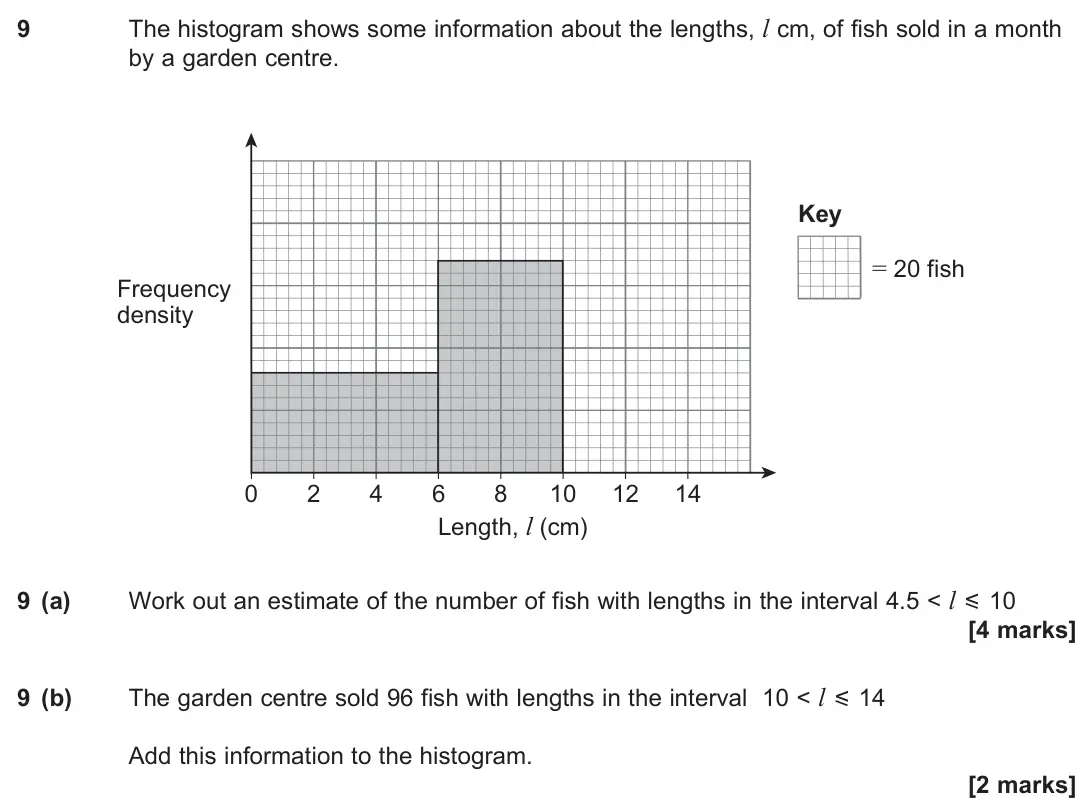
- November 2021, Paper 1, Q9 (6 marks): The histogram shows some information about the lengths, l cm, of fish sold in a month by a garden centre. 4 Length, l (cm) Frequency density Key = 20 fish 0 2 8
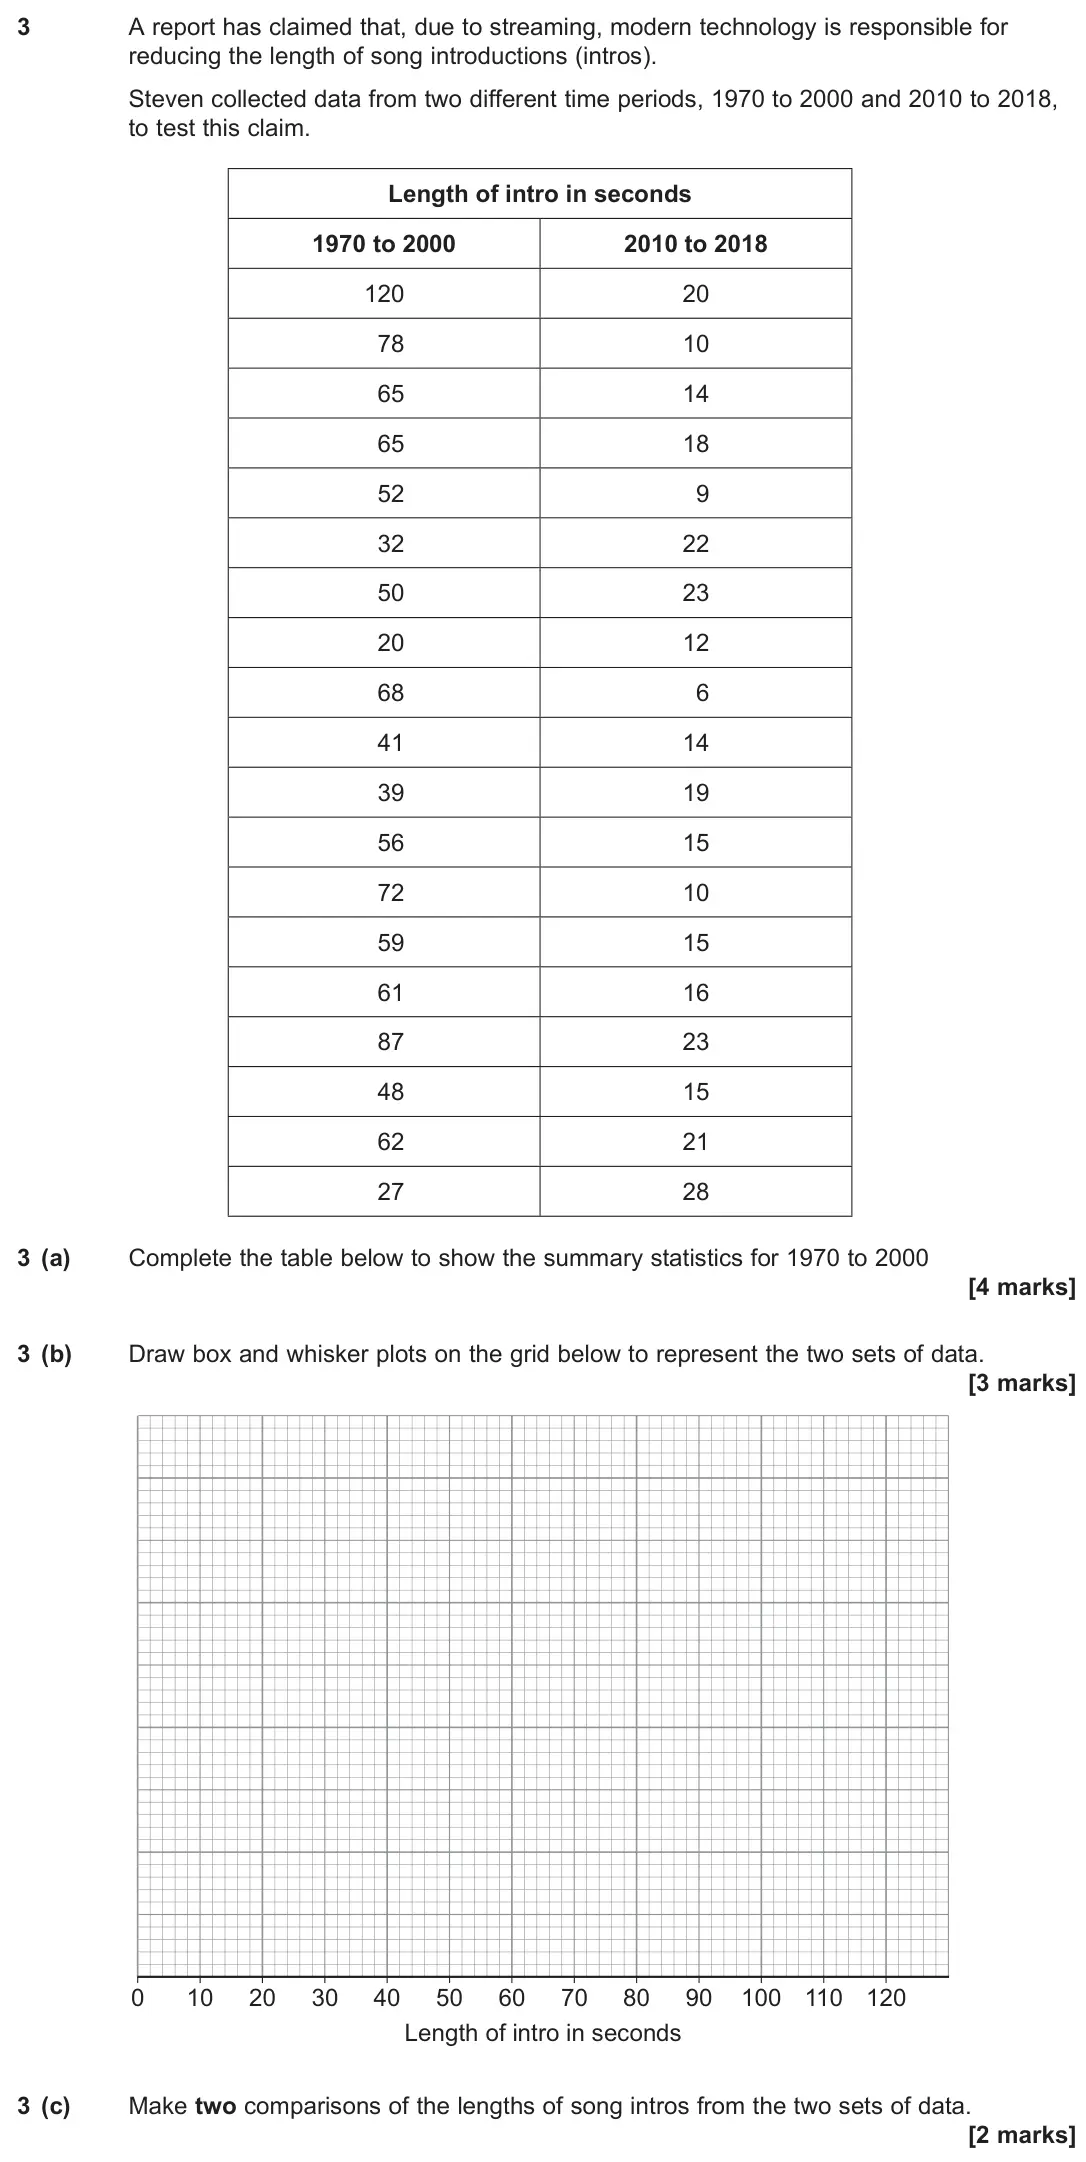
- June 2019, Paper 1, Q3 (9 marks): A report has claimed that, due to streaming, modern technology is responsible for reducing the length of song introductions (intros). Steven collected data from
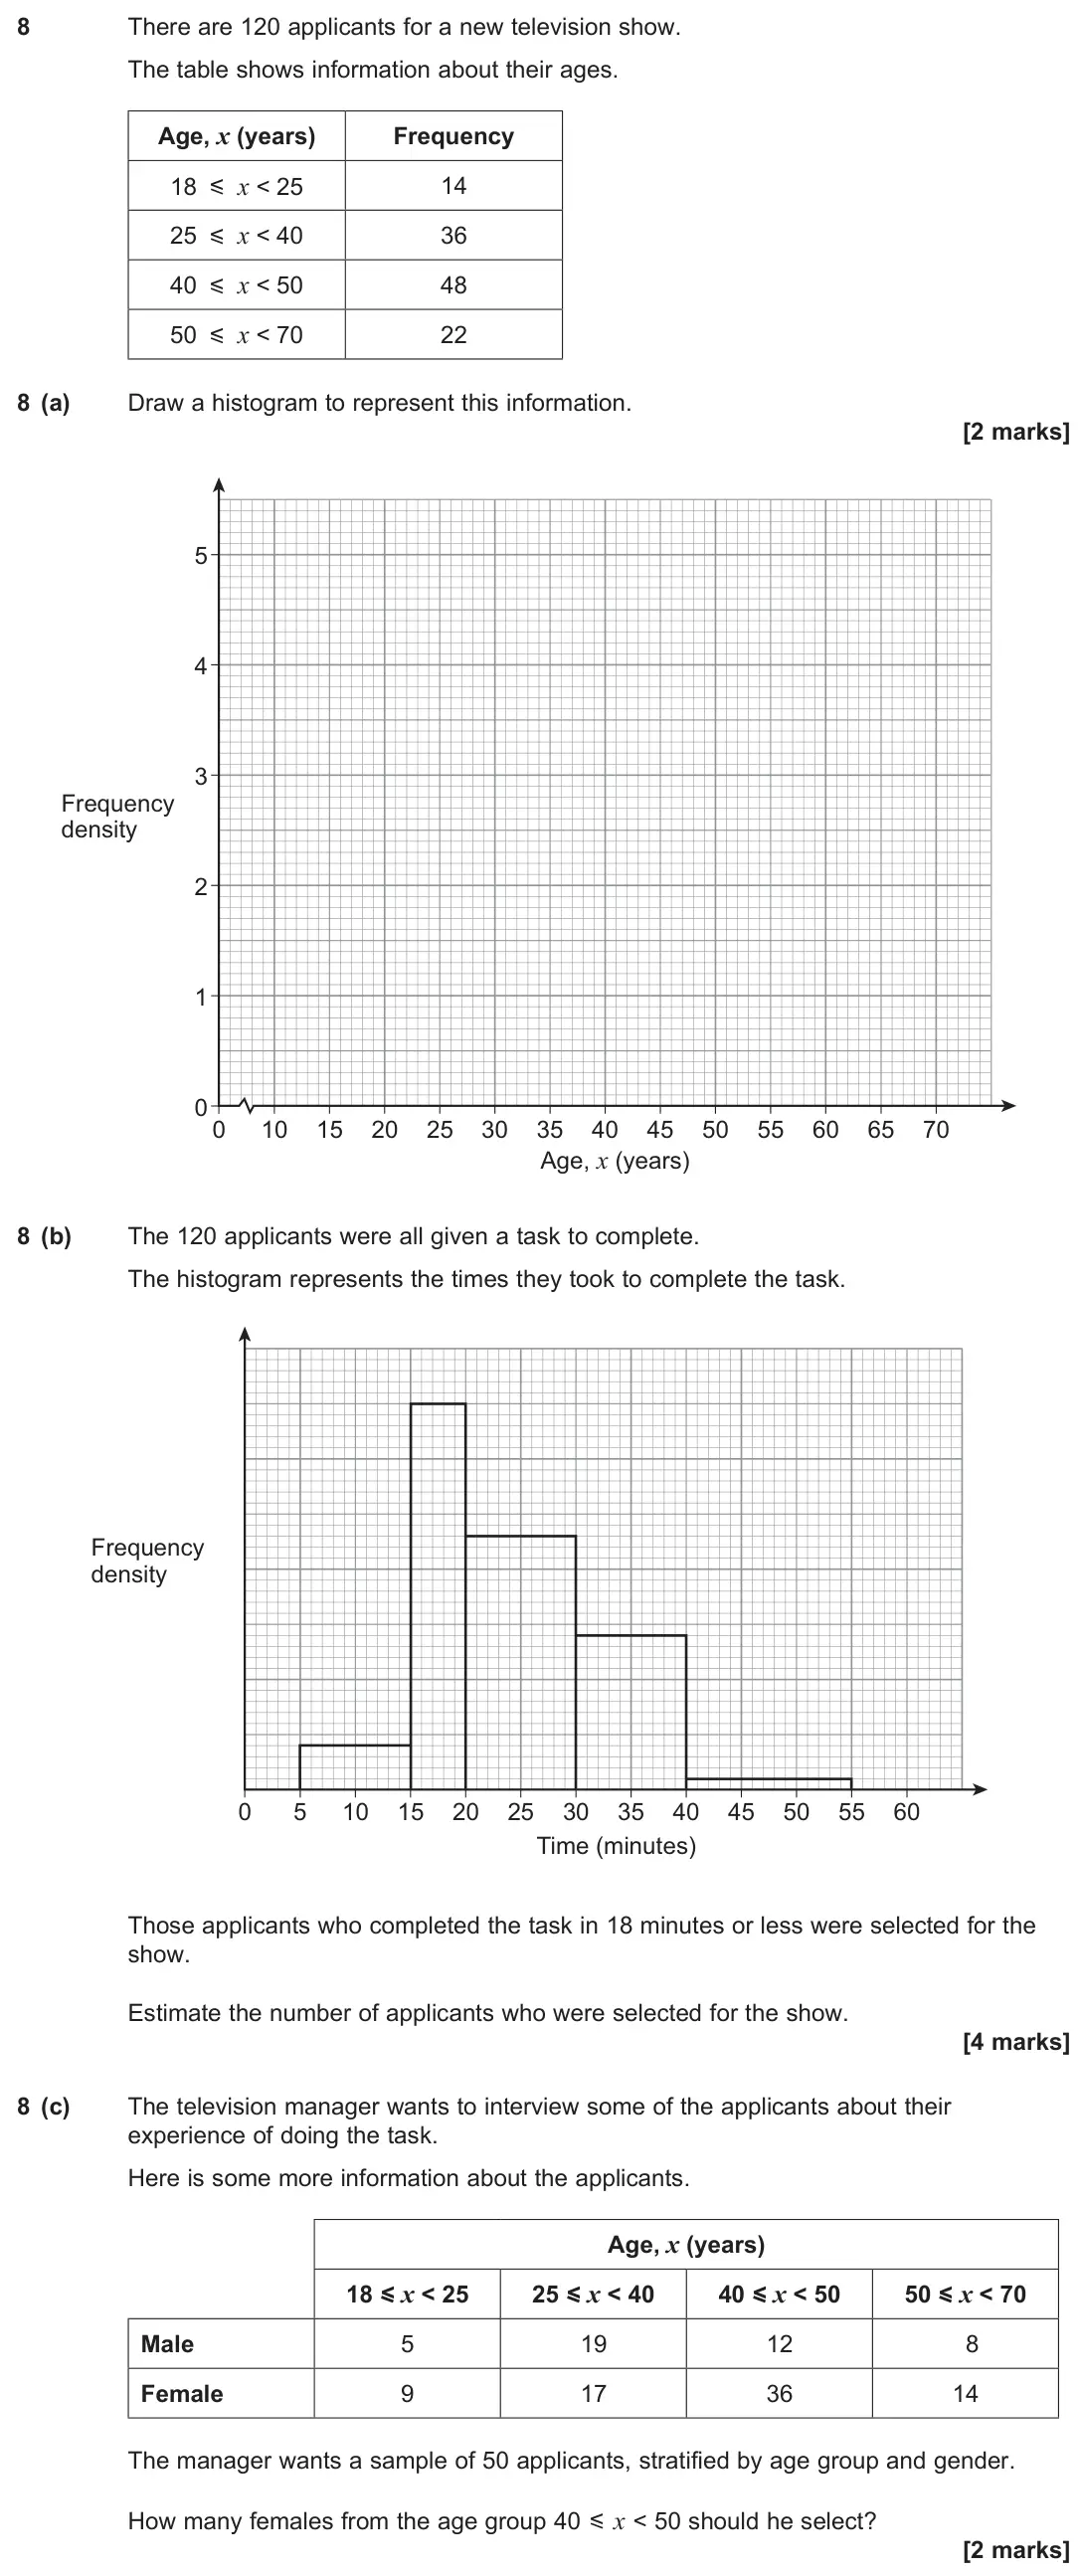
- June 2019, Paper 1, Q8 (8 marks): There are 120 applicants for a new television show. The table shows information about their ages. Age, x (years) Frequency 18 v x < 25 14 25 v x < 40 36 40 v x
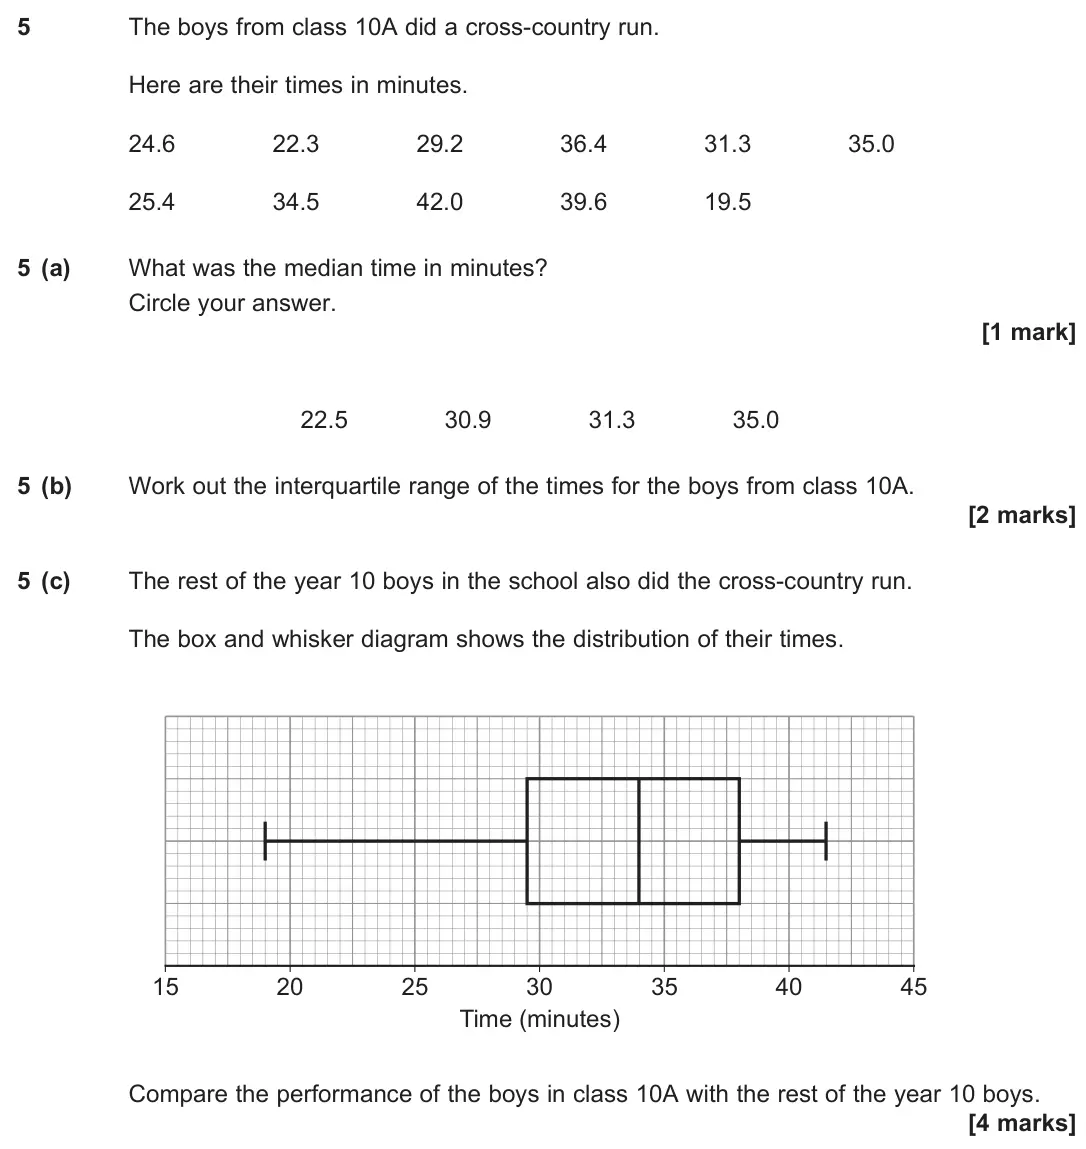
- June 2018, Paper 1, Q5 (7 marks): The boys from class 10A did a cross-country run. Here are their times in minutes. 24.6 22.3 29.2 36.4 31.3 35.0 25.4 34.5 42.0 39.6 19.5 5 (a) What was the medi
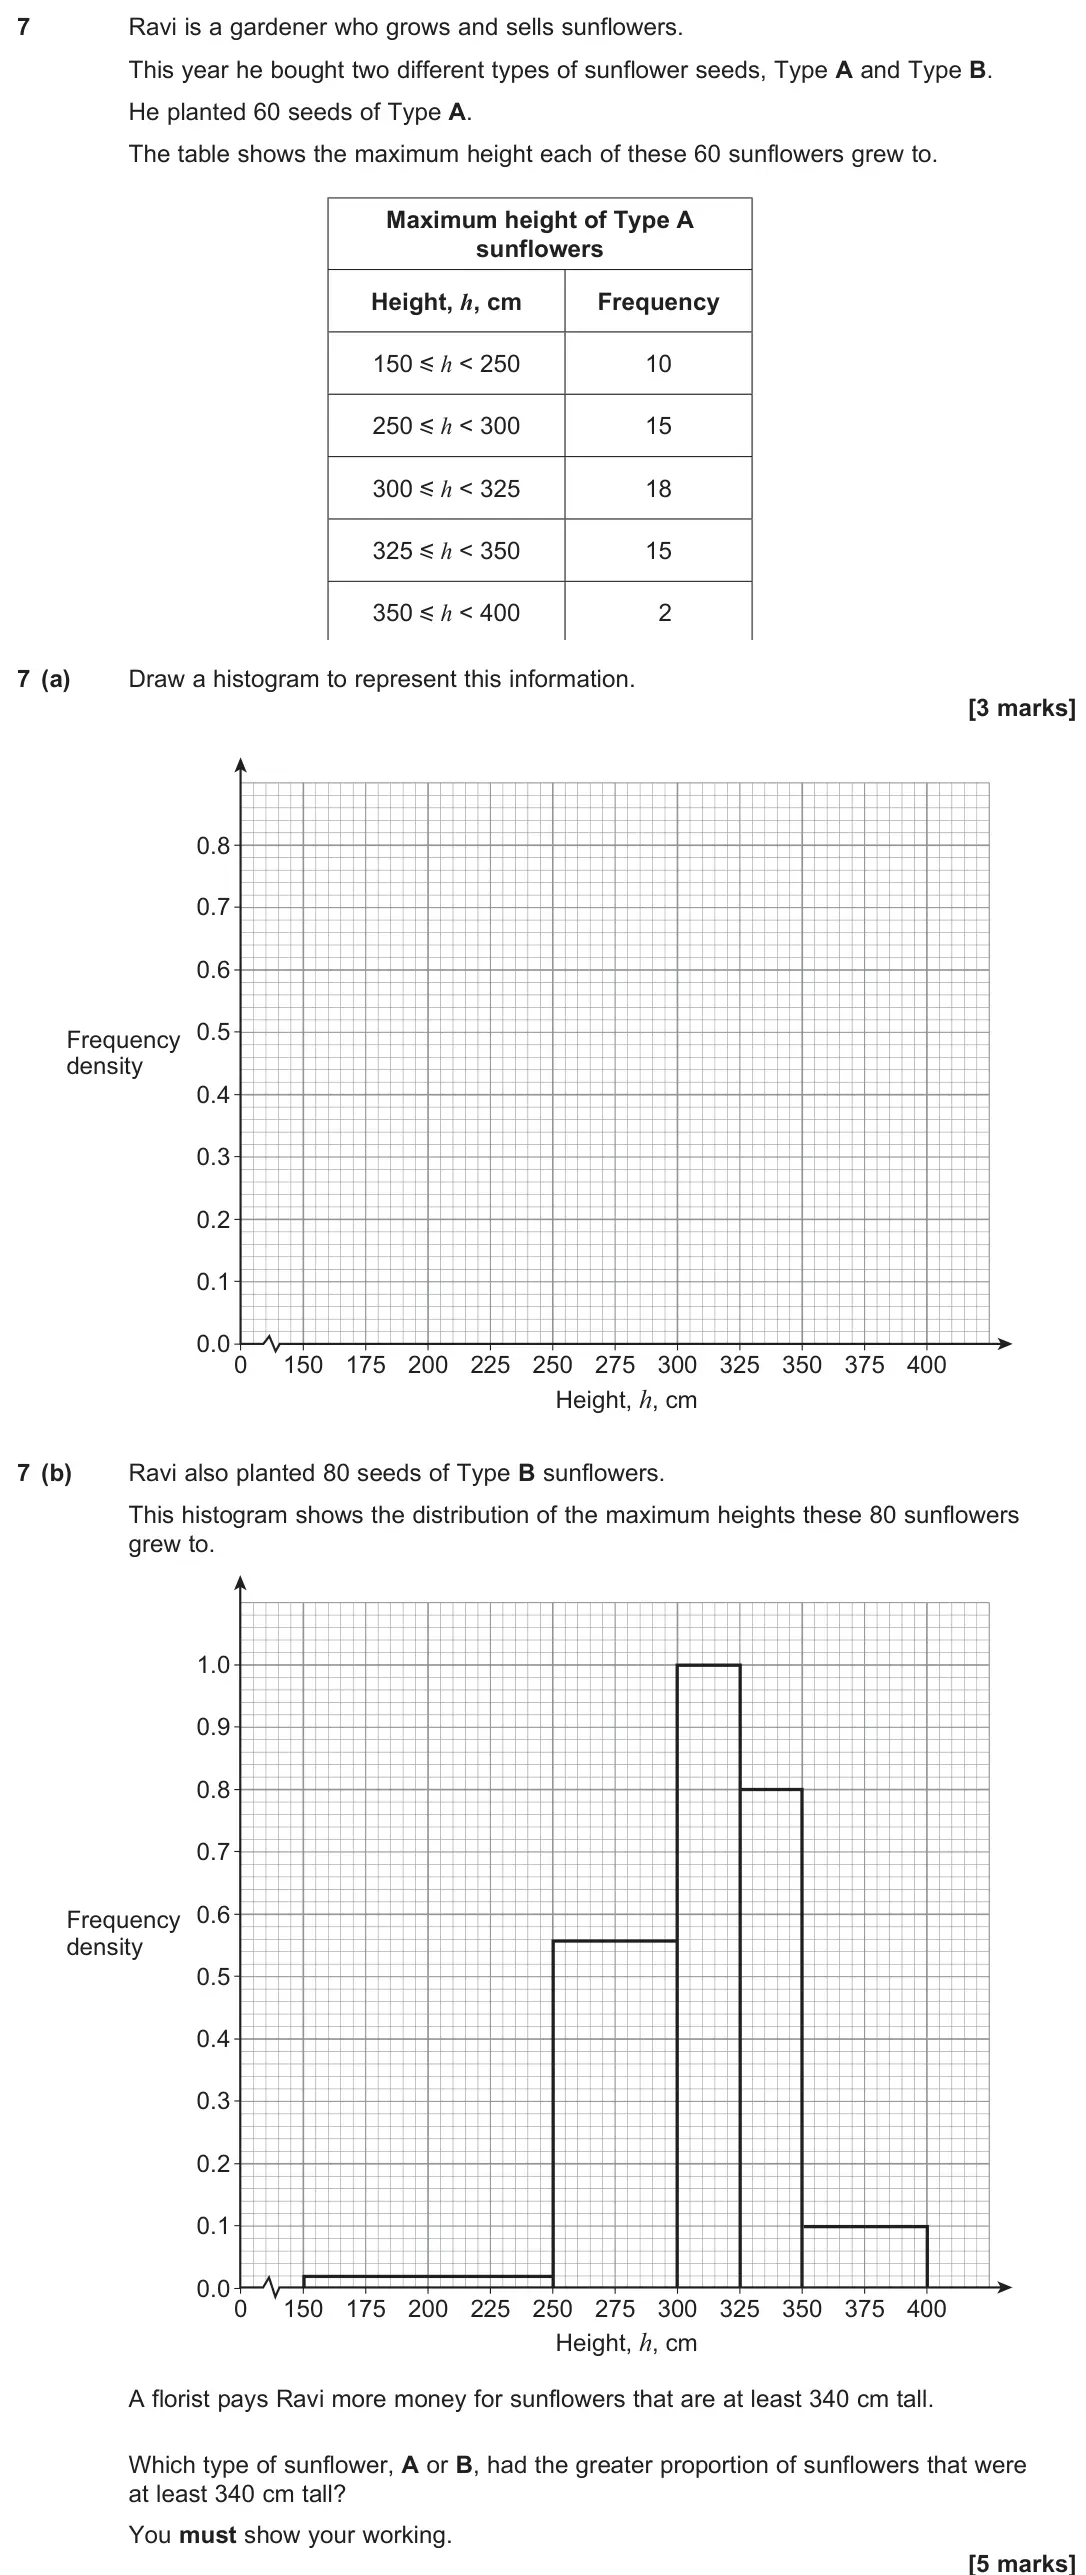
- June 2018, Paper 1, Q7 (8 marks): Ravi is a gardener who grows and sells sunflowers. This year he bought two different types of sunflower seeds, Type A and Type B. He planted 60 seeds of Type A.
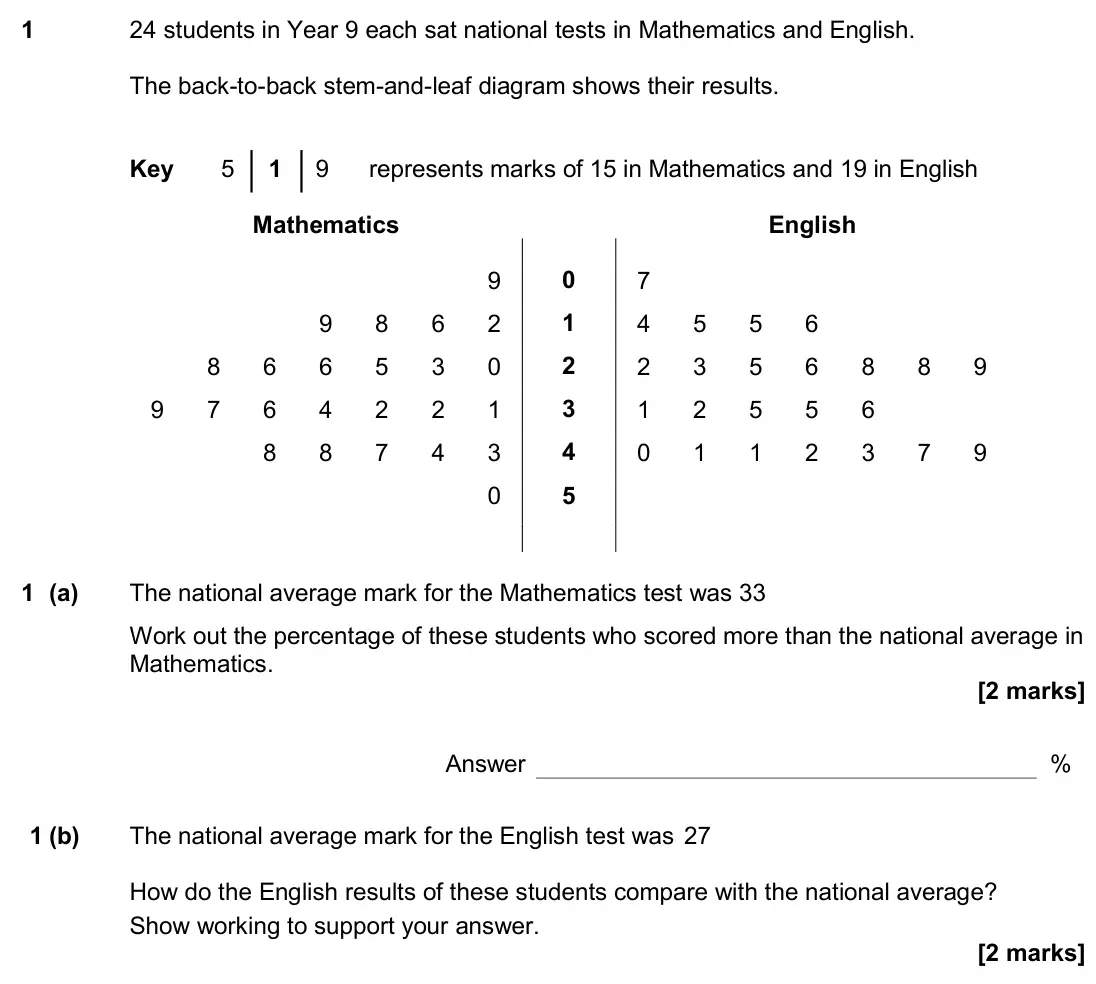
- June 2017, Paper 1, Q1 (4 marks): 24 students in Year 9 each sat national tests in Mathematics and English. The back-to-back stem-and-leaf diagram shows their results. Key 5 1 9 represents marks
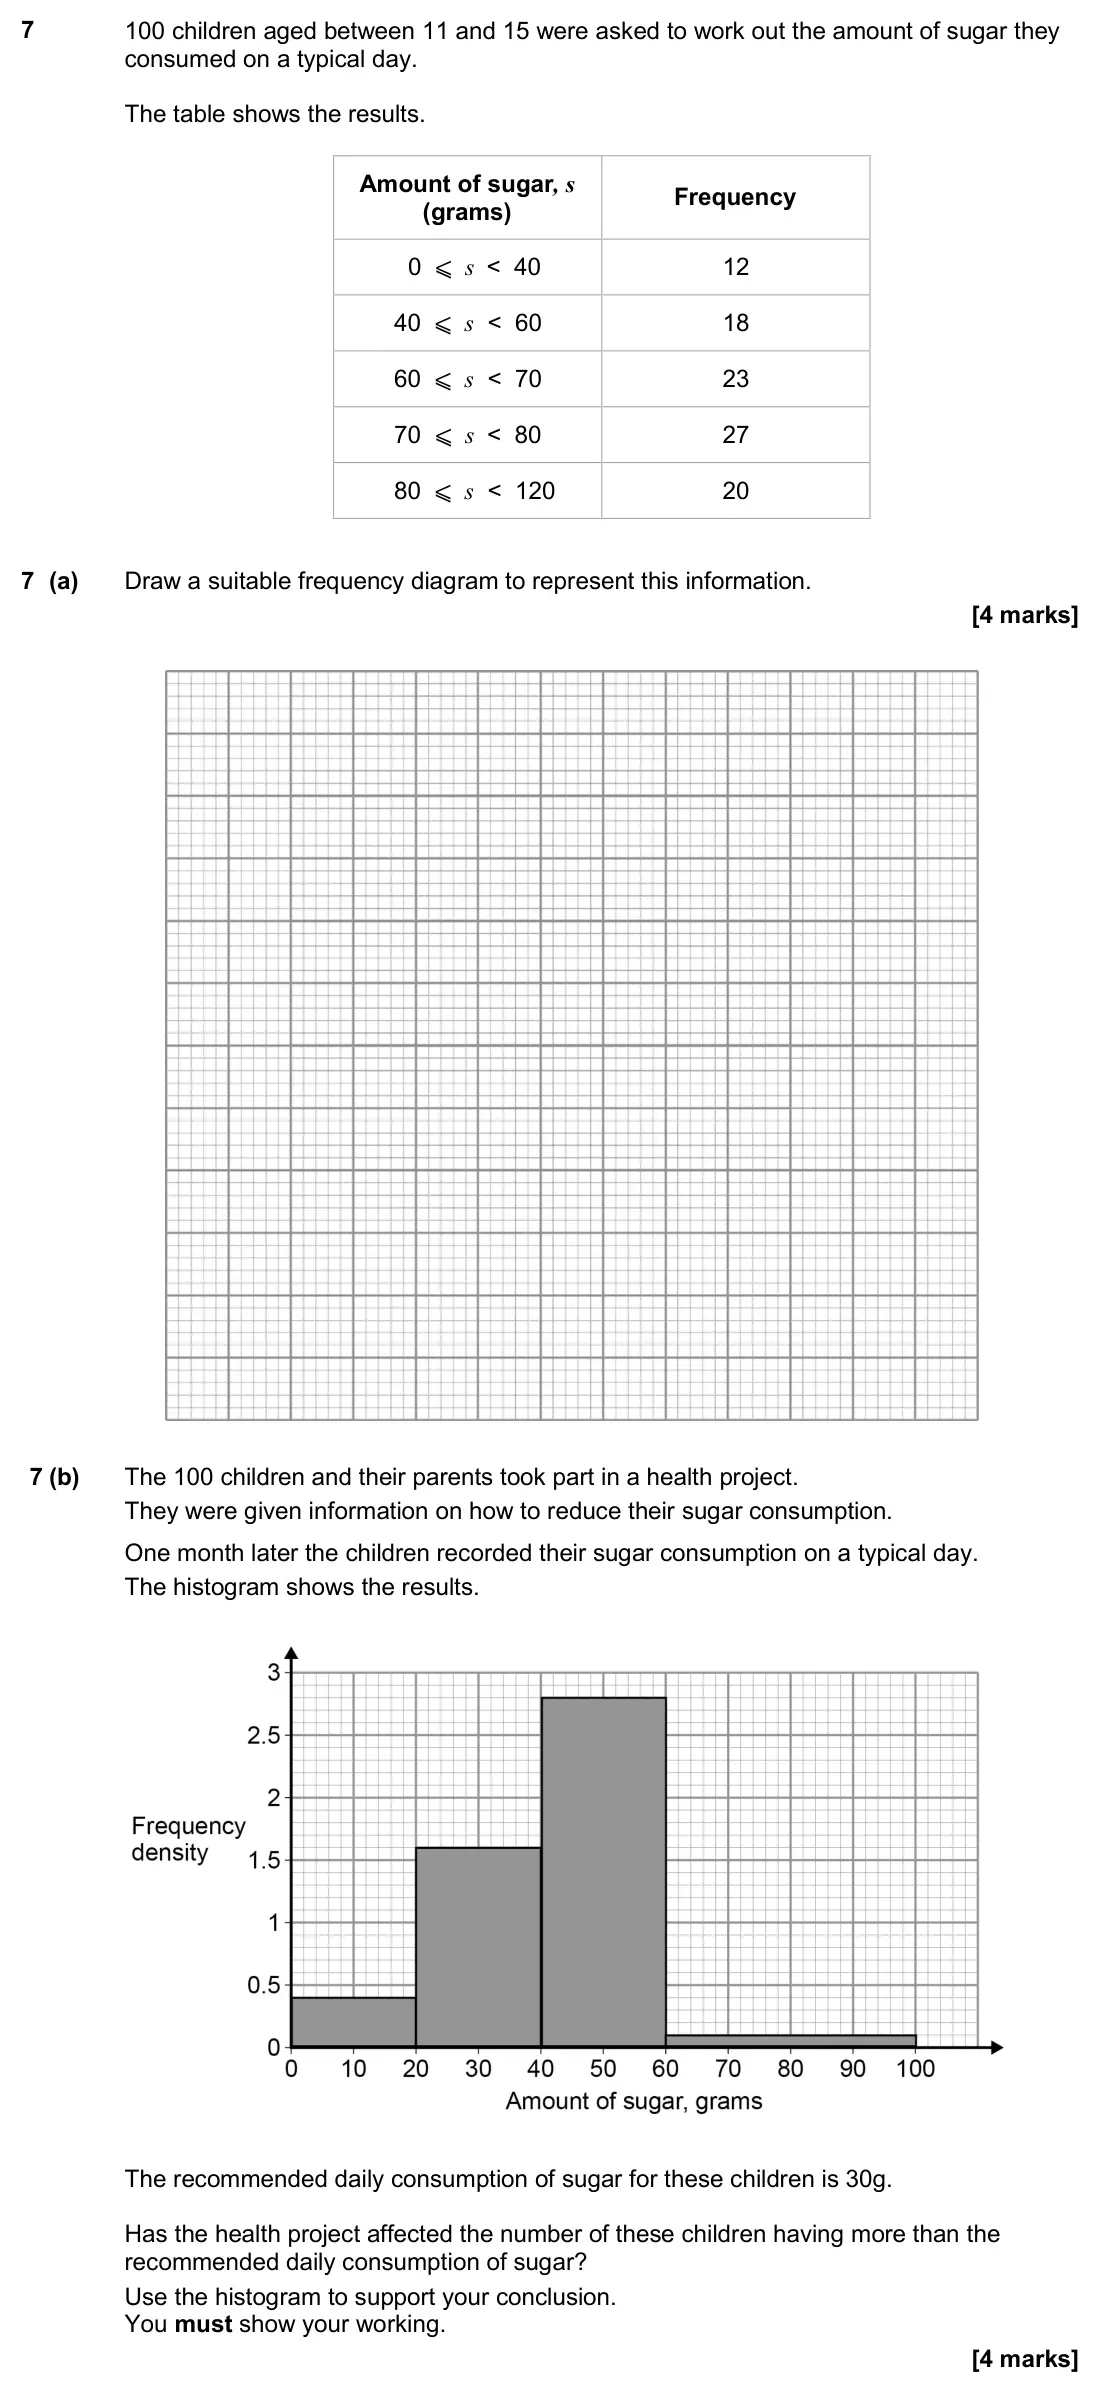
- June 2017, Paper 1, Q7 (8 marks): 100 children aged between 11 and 15 were asked to work out the amount of sugar they consumed on a typical day. The table shows the results. Amount of sugar, s (
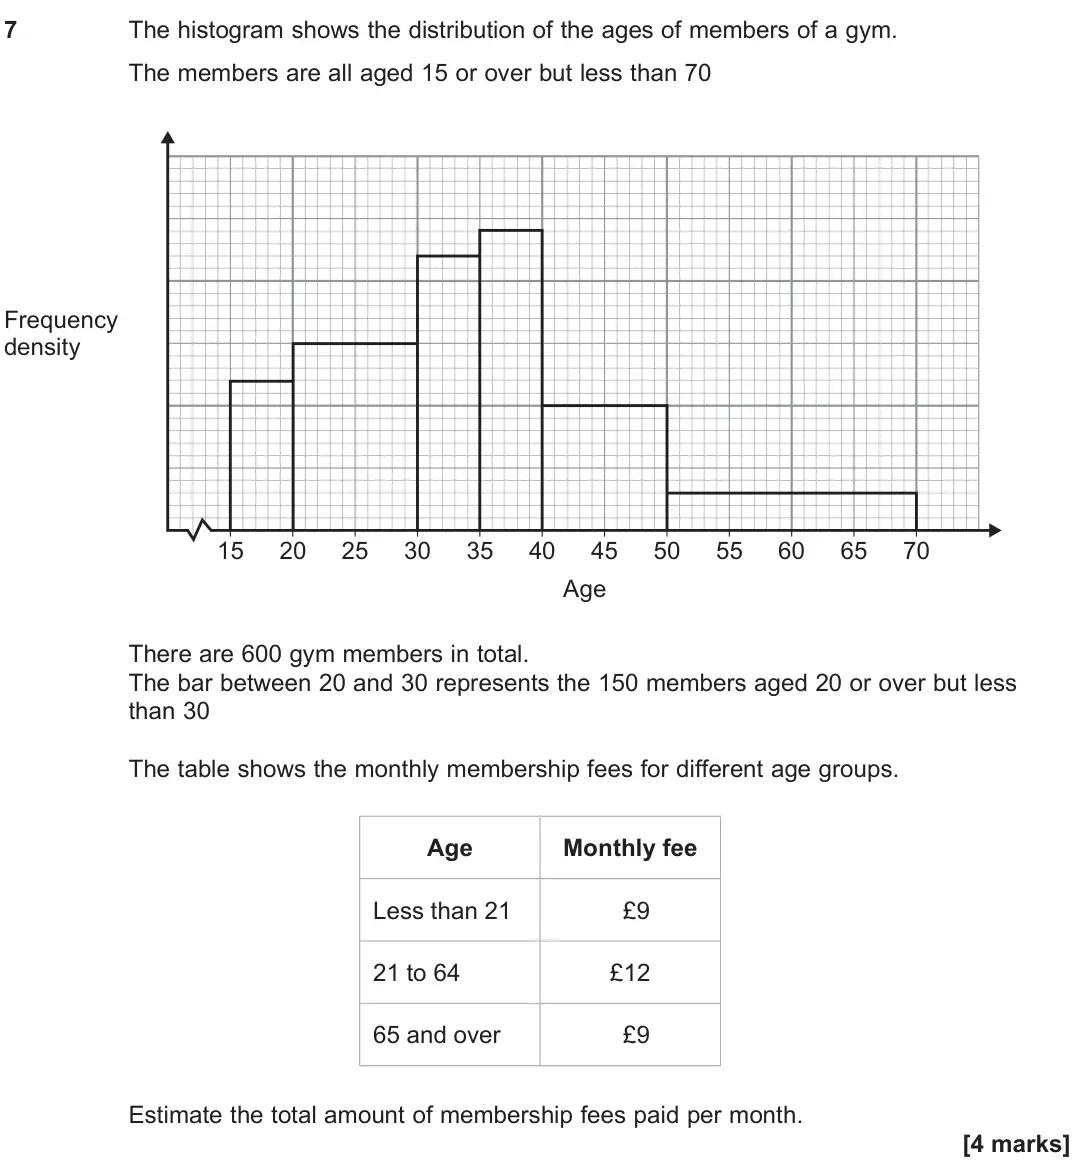
- June 2016, Paper 1, Q7 (4 marks): The histogram shows the distribution of the ages of members of a gym. The members are all aged 15 or over but less than 70 30 40 Age Frequency density 50 20 60
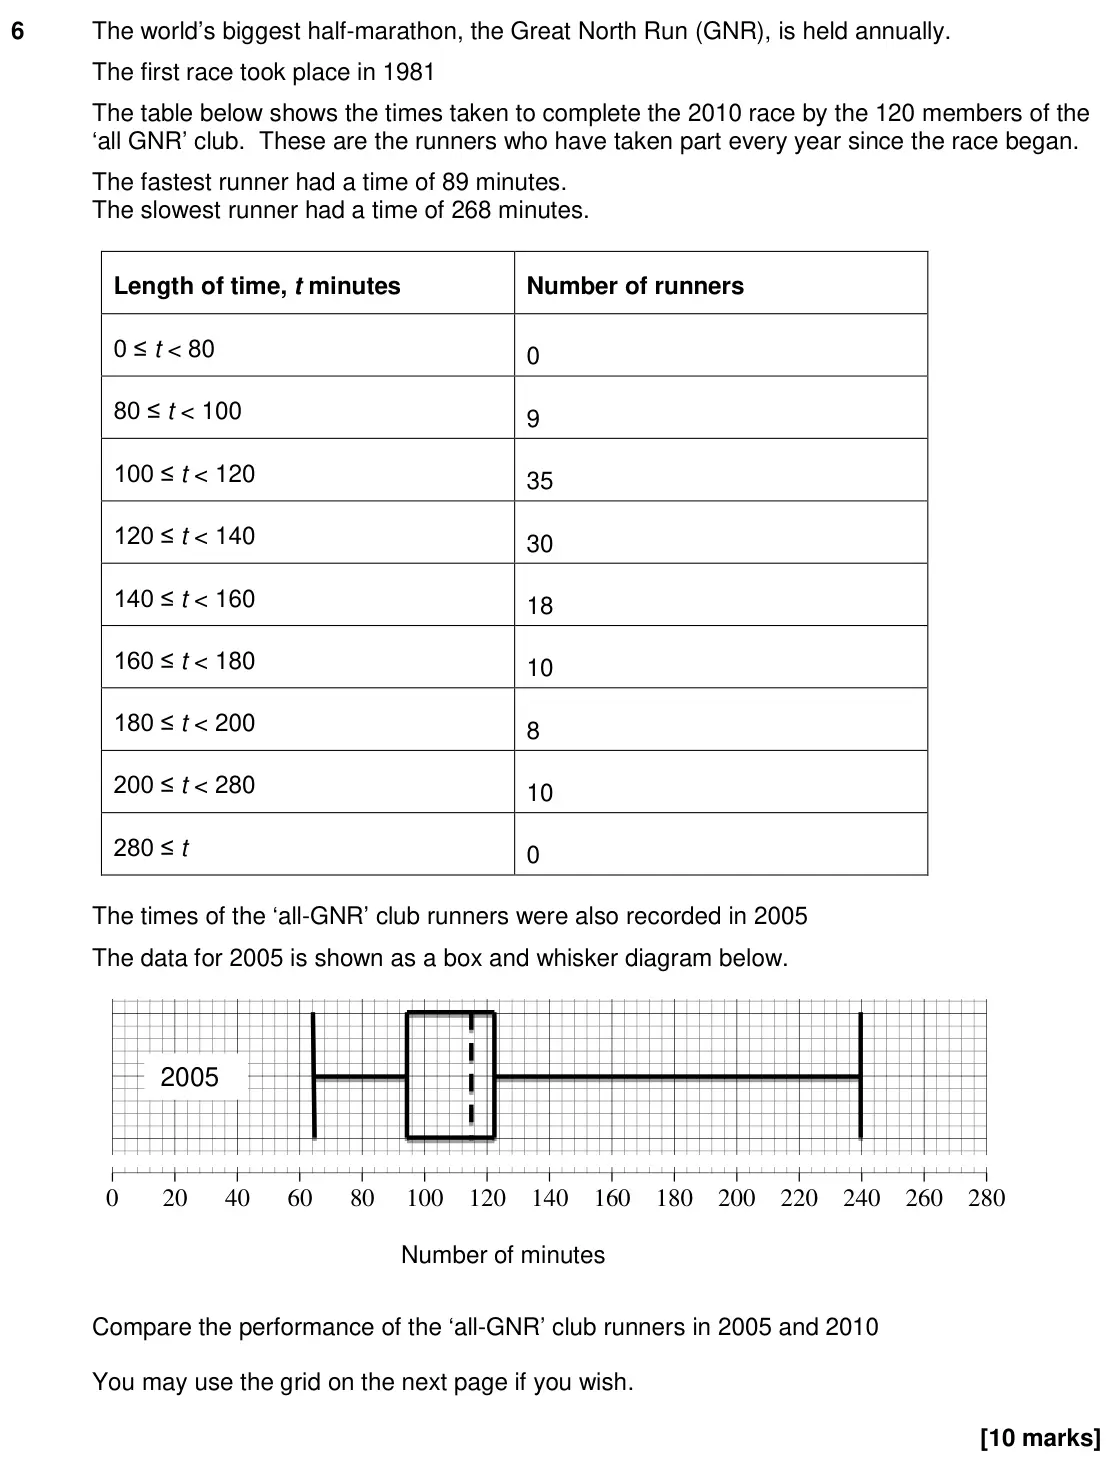
- Specimen, Paper 1, Q6 (10 marks): The world’s biggest half-marathon, the Great North Run (GNR), is held annually. The first race took place in 1981 The table below shows the times taken to compl
Questions, mark schemes and examiner’s reports are © AQA, from their published past papers. Plumi isn’t affiliated with any exam board. Want whole papers? AQA Level 3 Core Maths past papers.
The Plumi iPad app also offers exam-style questions with AI feedback on your handwritten working.