Skip to content
Android waitlistTry on iPad
Get started

Graphs of functions: AQA Level 3 Core Maths questions

AQA Level 3 Core Maths past-paper questions on G1 Graphs of functions, 2016–2025, with mark schemes and examiner’s reports where available.

Paper
All papers
Exam
All years

Loading the full question list…
287 questions

  1. Q3

    June 2025 · Paper 2C

    The whole paper ↗
    1
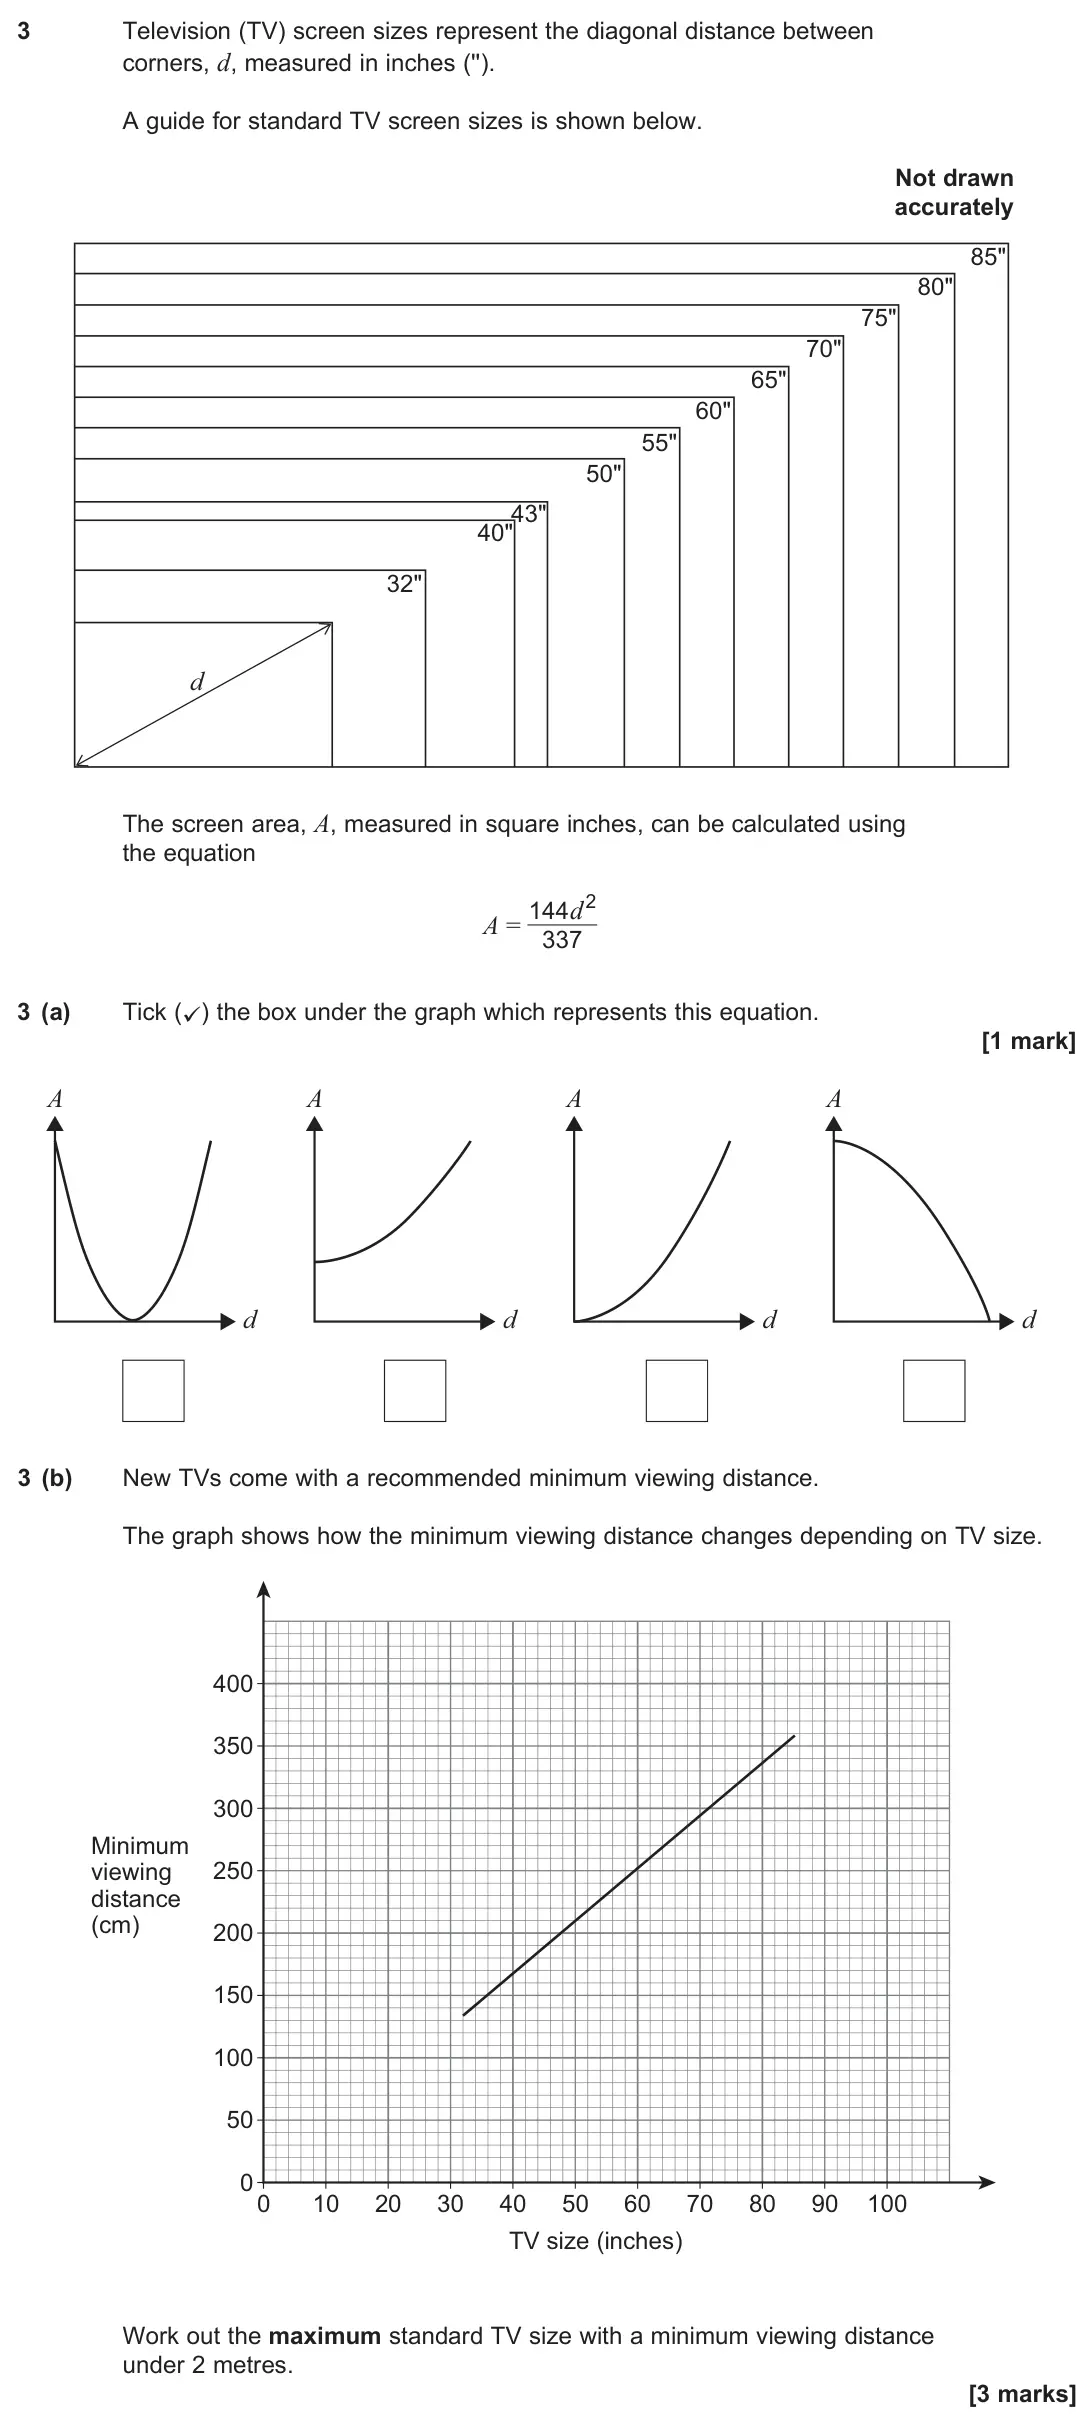
    Original question 3: Television (TV) screen sizes represent the diagonal distance between corners, d, measured in inches (''). A guide for standard TV screen sizes is shown below. N

    Loading the question…

  2. Q4

    June 2024 · Paper 2C

    The whole paper ↗
    2
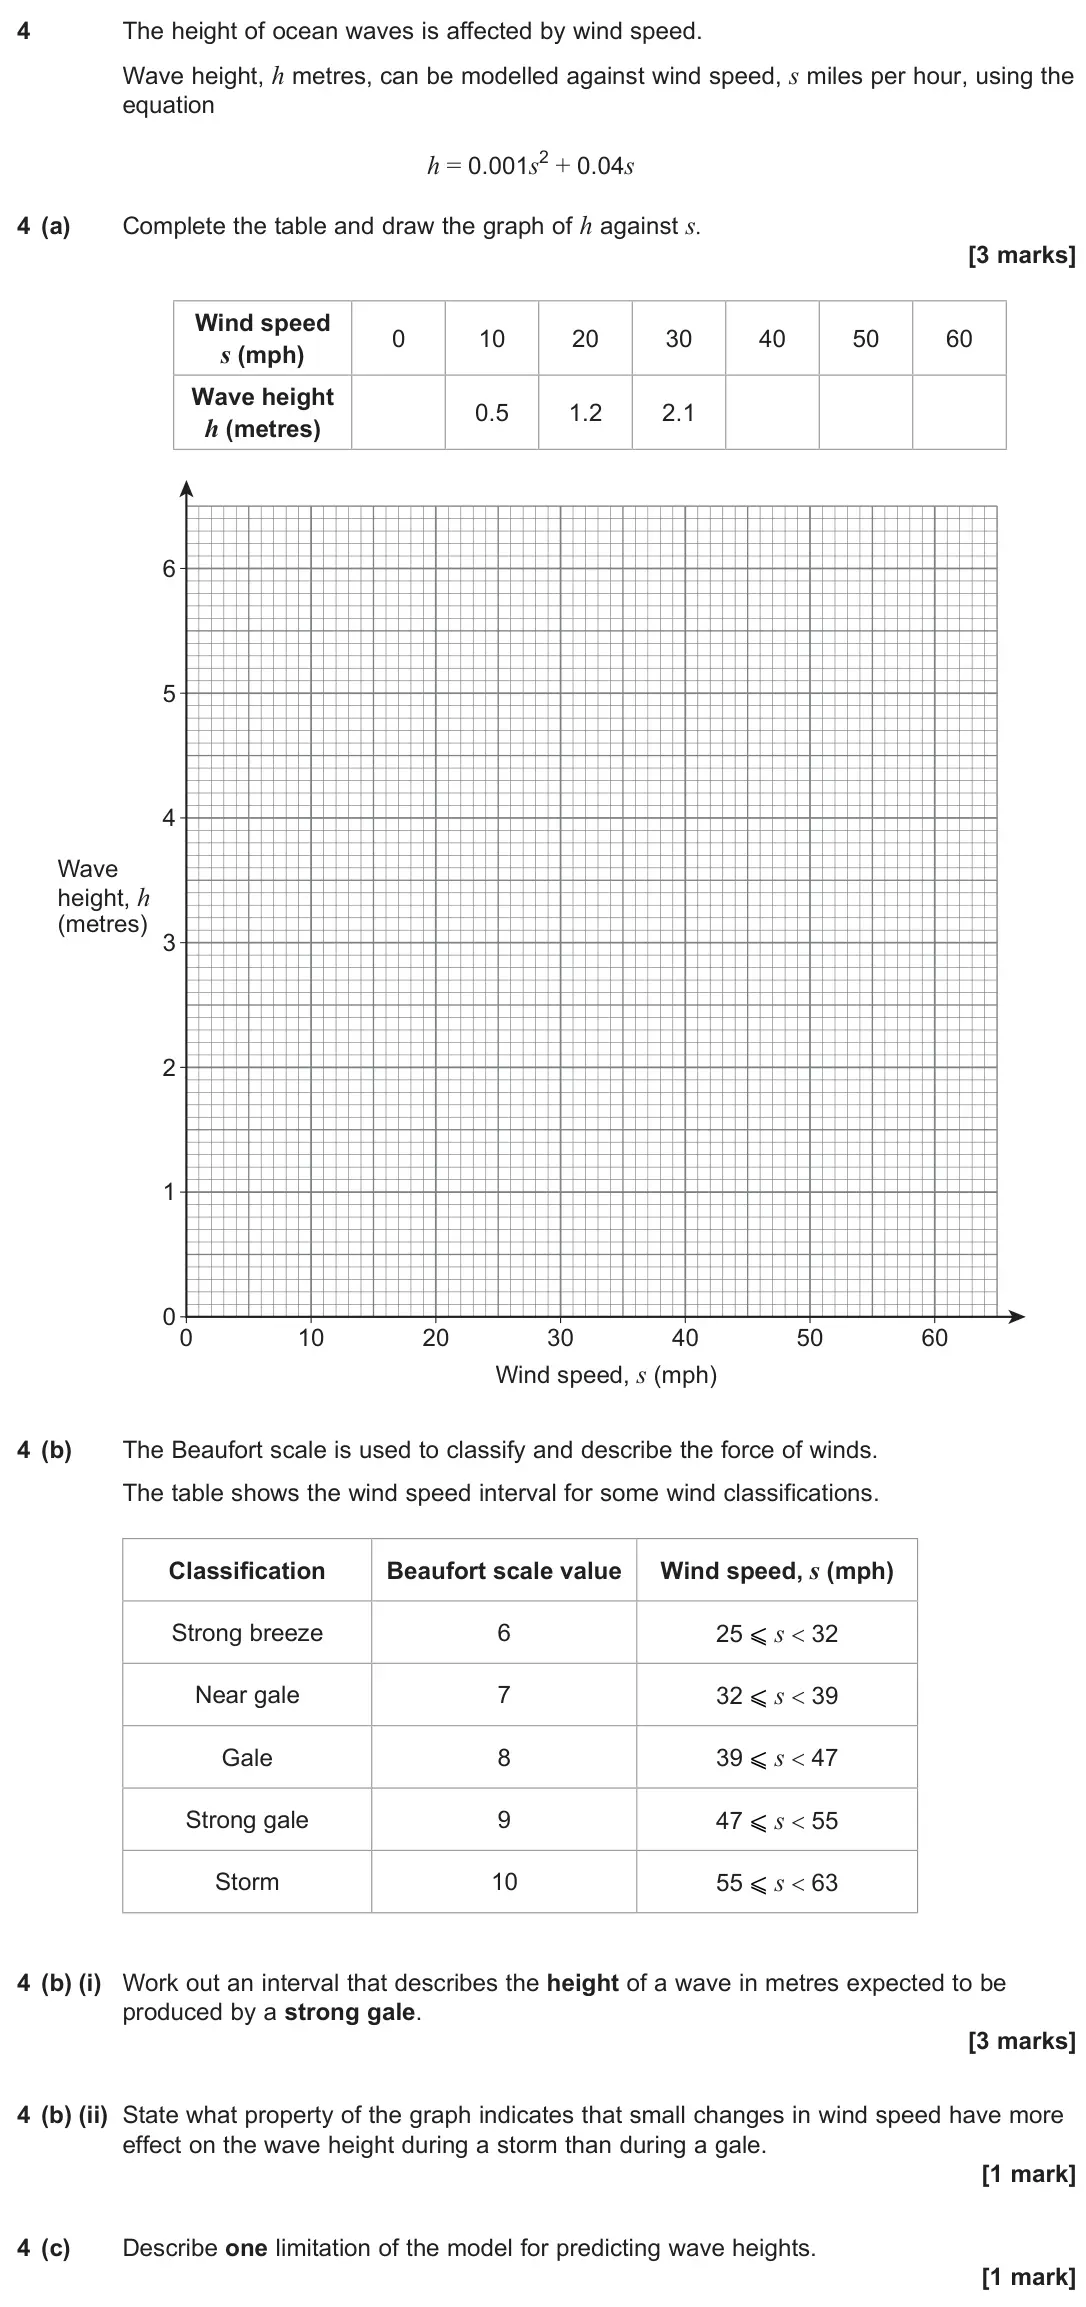
    Original question 4: The height of ocean waves is affected by wind speed. Wave height, h metres, can be modelled against wind speed, s miles per hour, using the equation h = 0.001s2

    Loading the question…

  3. Q5

    June 2024 · Paper 2C

    The whole paper ↗
    3
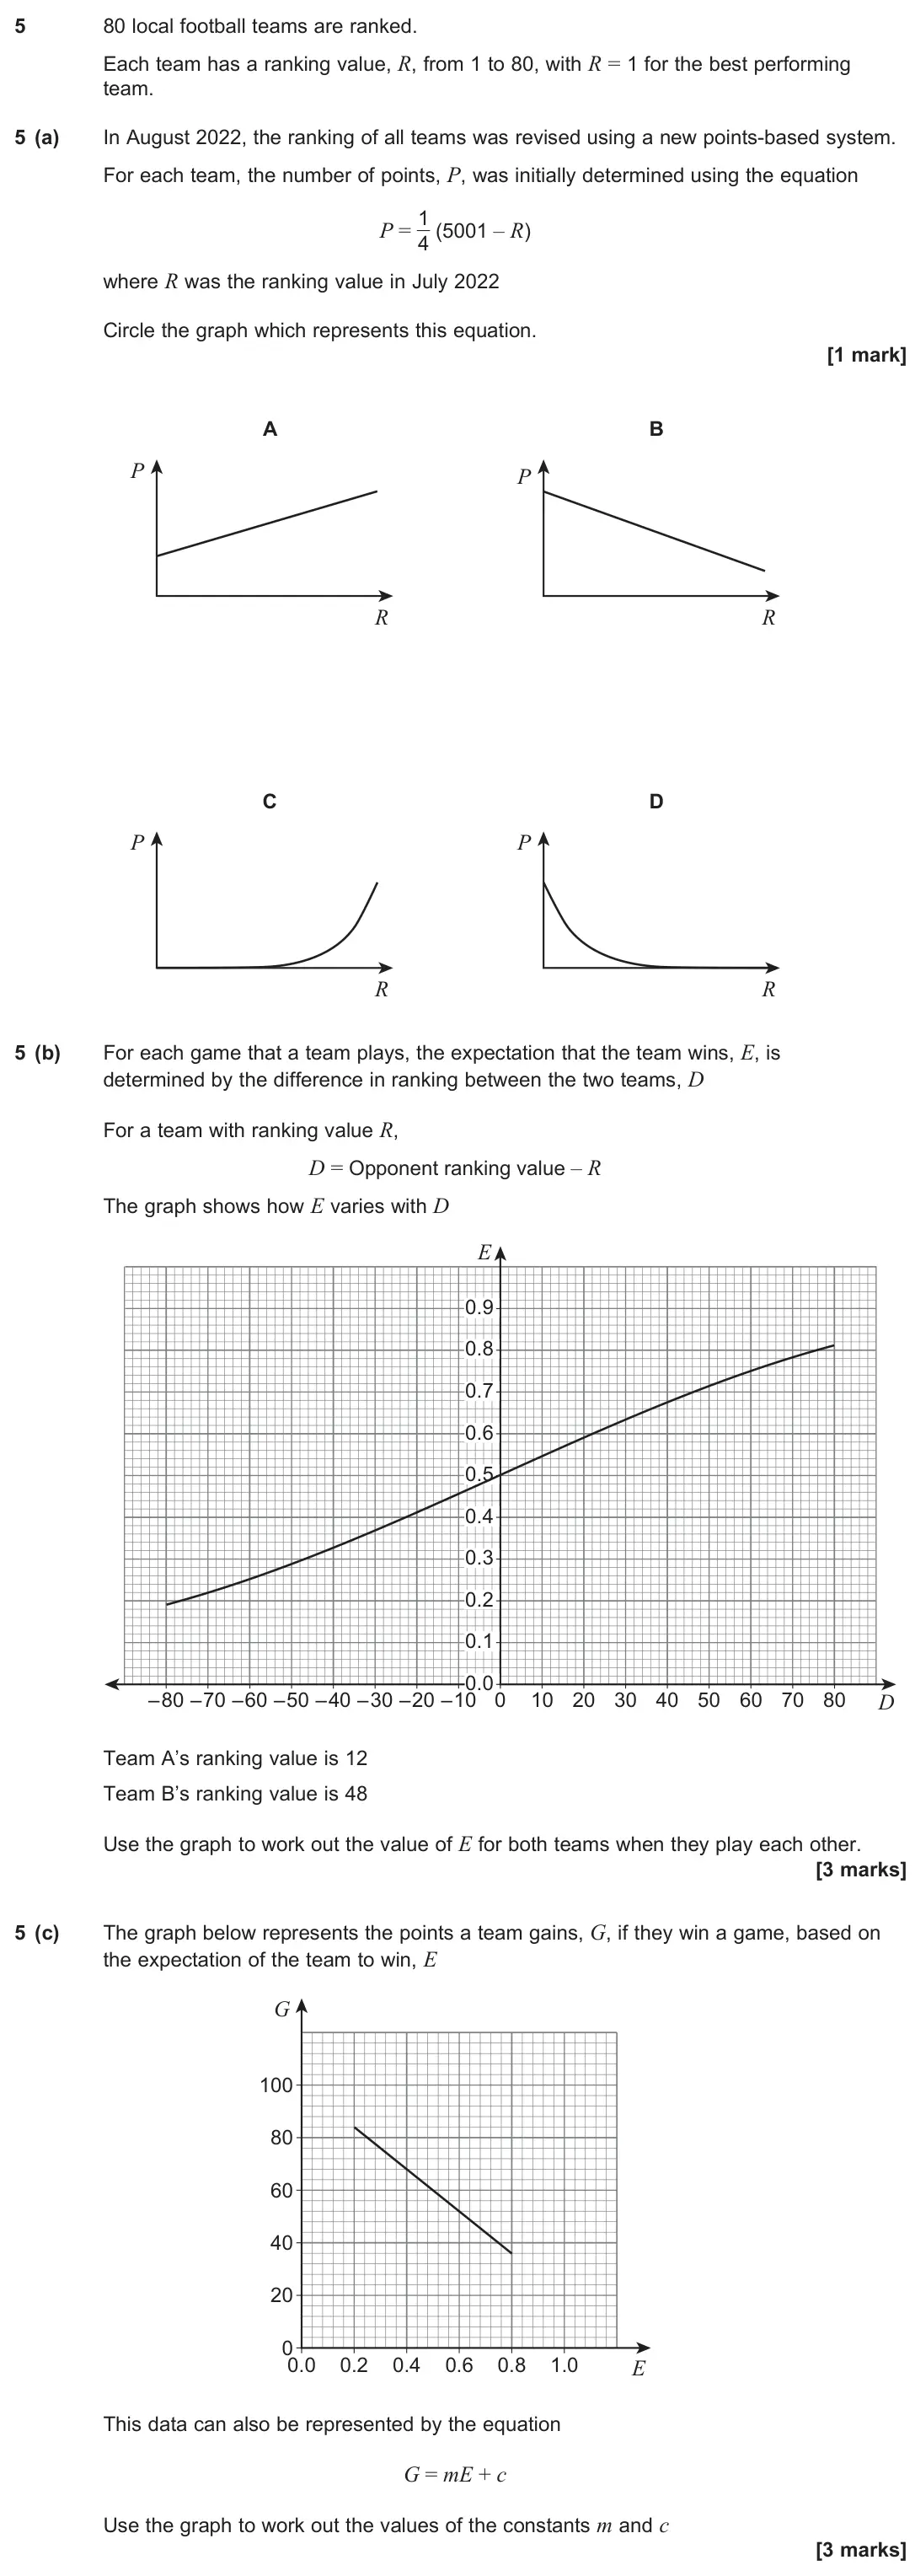
    Original question 5: 80 local football teams are ranked. Each team has a ranking value, R, from 1 to 80, with R = 1 for the best performing team. 5 (a) In August 2022, the ranking o

    Loading the question…

  4. Q4

    June 2023 · Paper 2C

    The whole paper ↗
    4
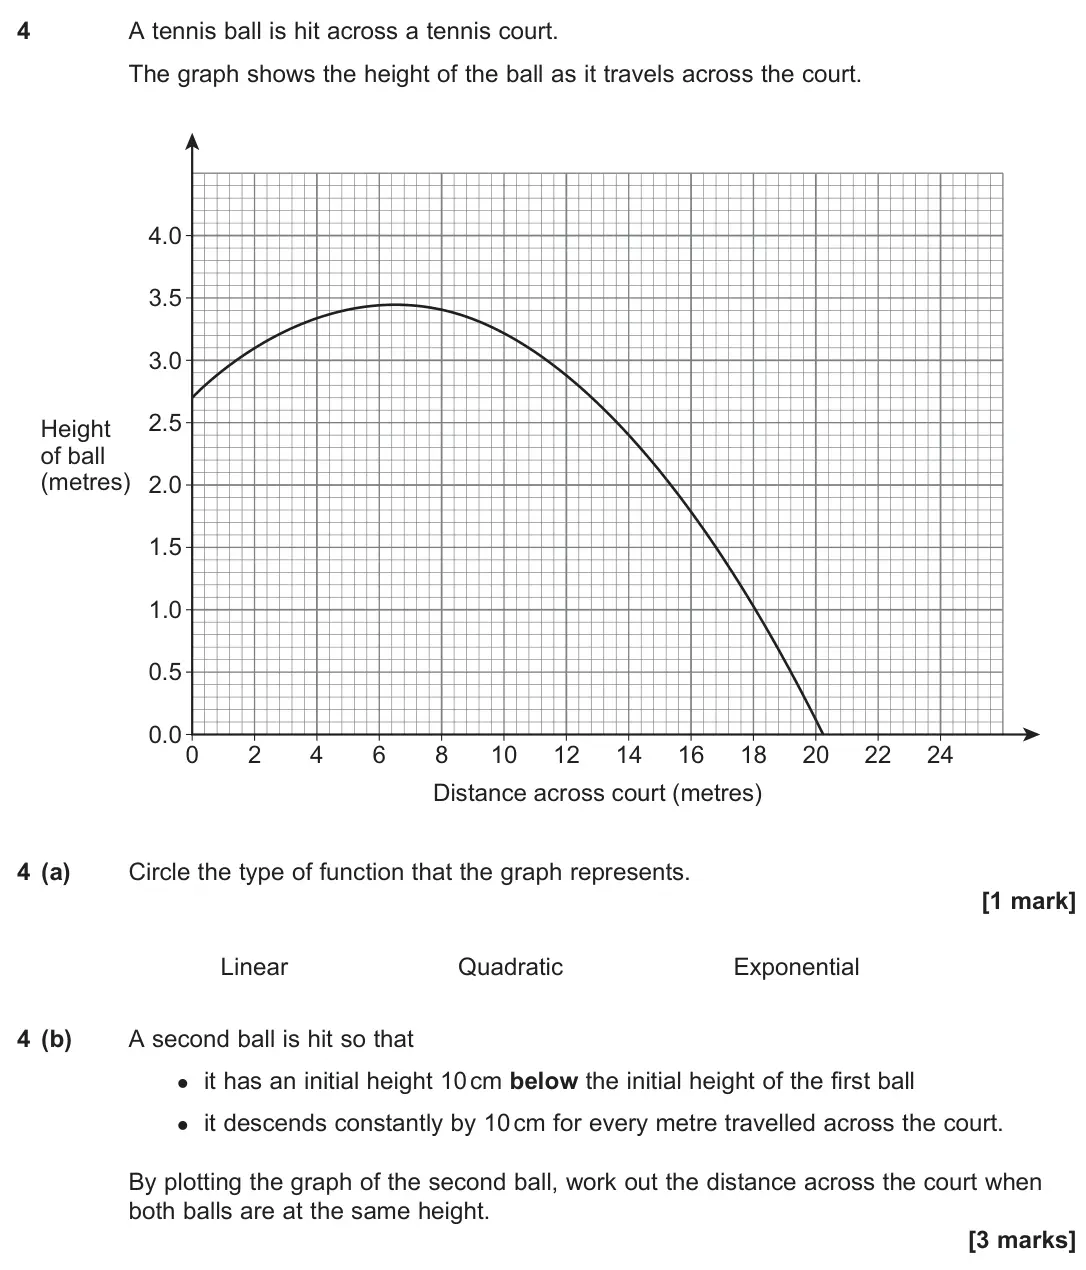
    Original question 4: A tennis ball is hit across a tennis court. The graph shows the height of the ball as it travels across the court. 0.0 2 0 4 6 8 10 12 14 16 18 20 1.0 2.0 3.0 0

    Loading the question…

  5. Q6

    June 2022 · Paper 2C

    The whole paper ↗
    5
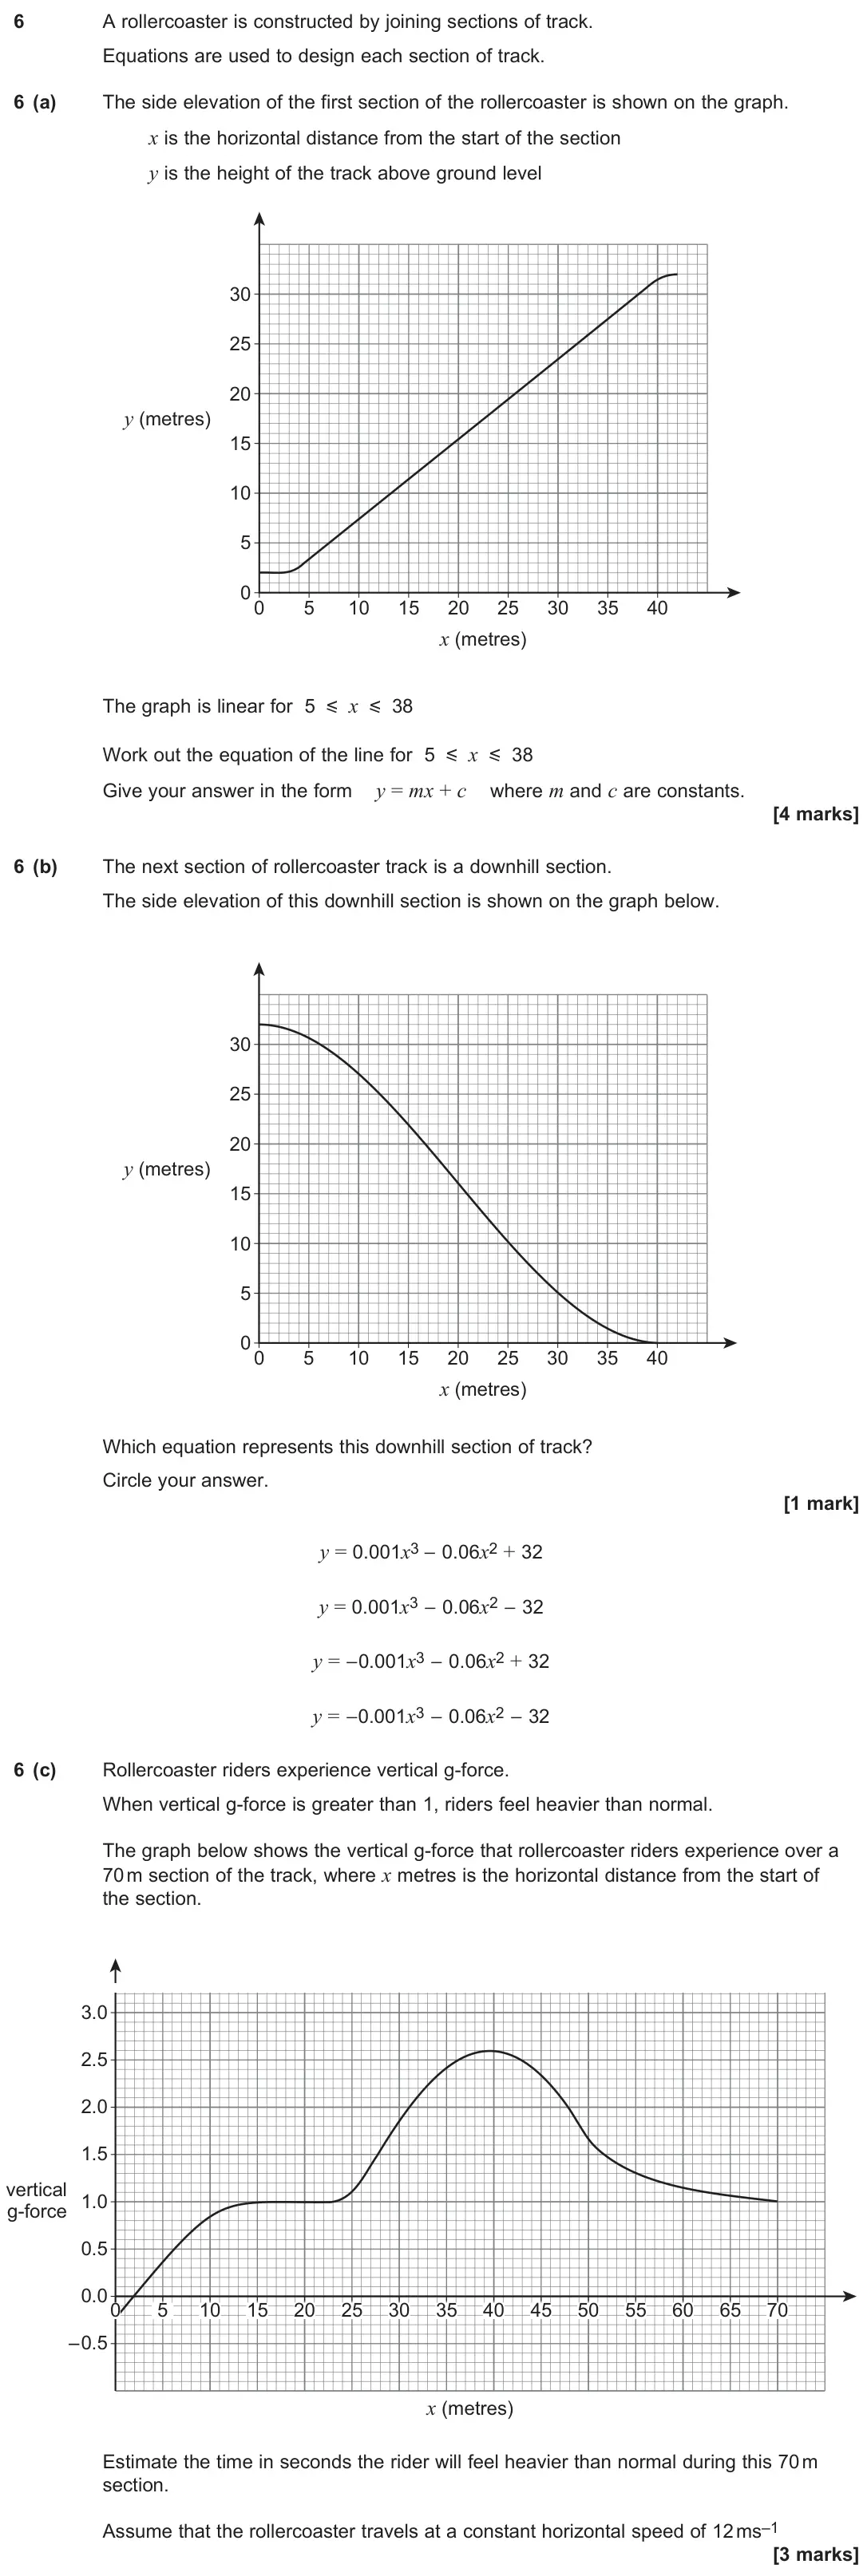
    Original question 6: A rollercoaster is constructed by joining sections of track. Equations are used to design each section of track. 6 (a) The side elevation of the first section o

    Loading the question…

  6. Q3

    June 2019 · Paper 2C

    The whole paper ↗
    6
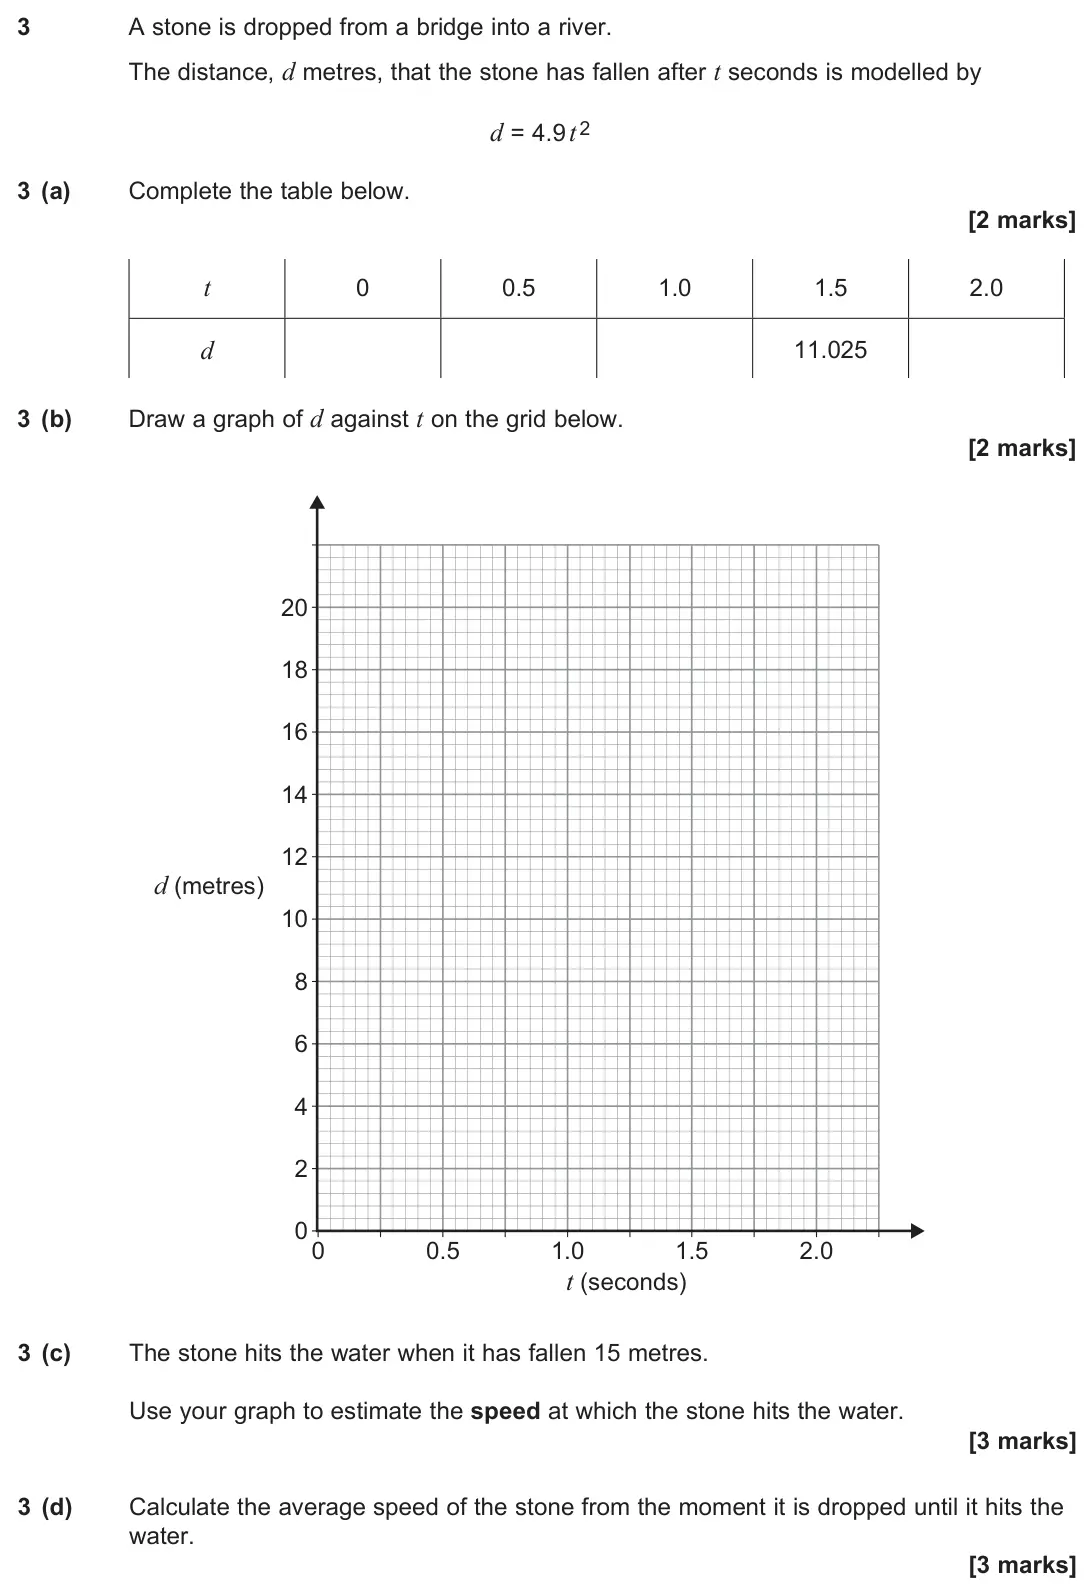
    Original question 3: A stone is dropped from a bridge into a river. The distance, d metres, that the stone has fallen after t seconds is modelled by d = 4.9 t 2 3 (a) Complete the t

    Loading the question…

  7. Q4

    June 2017 · Paper 2C

    The whole paper ↗
    7
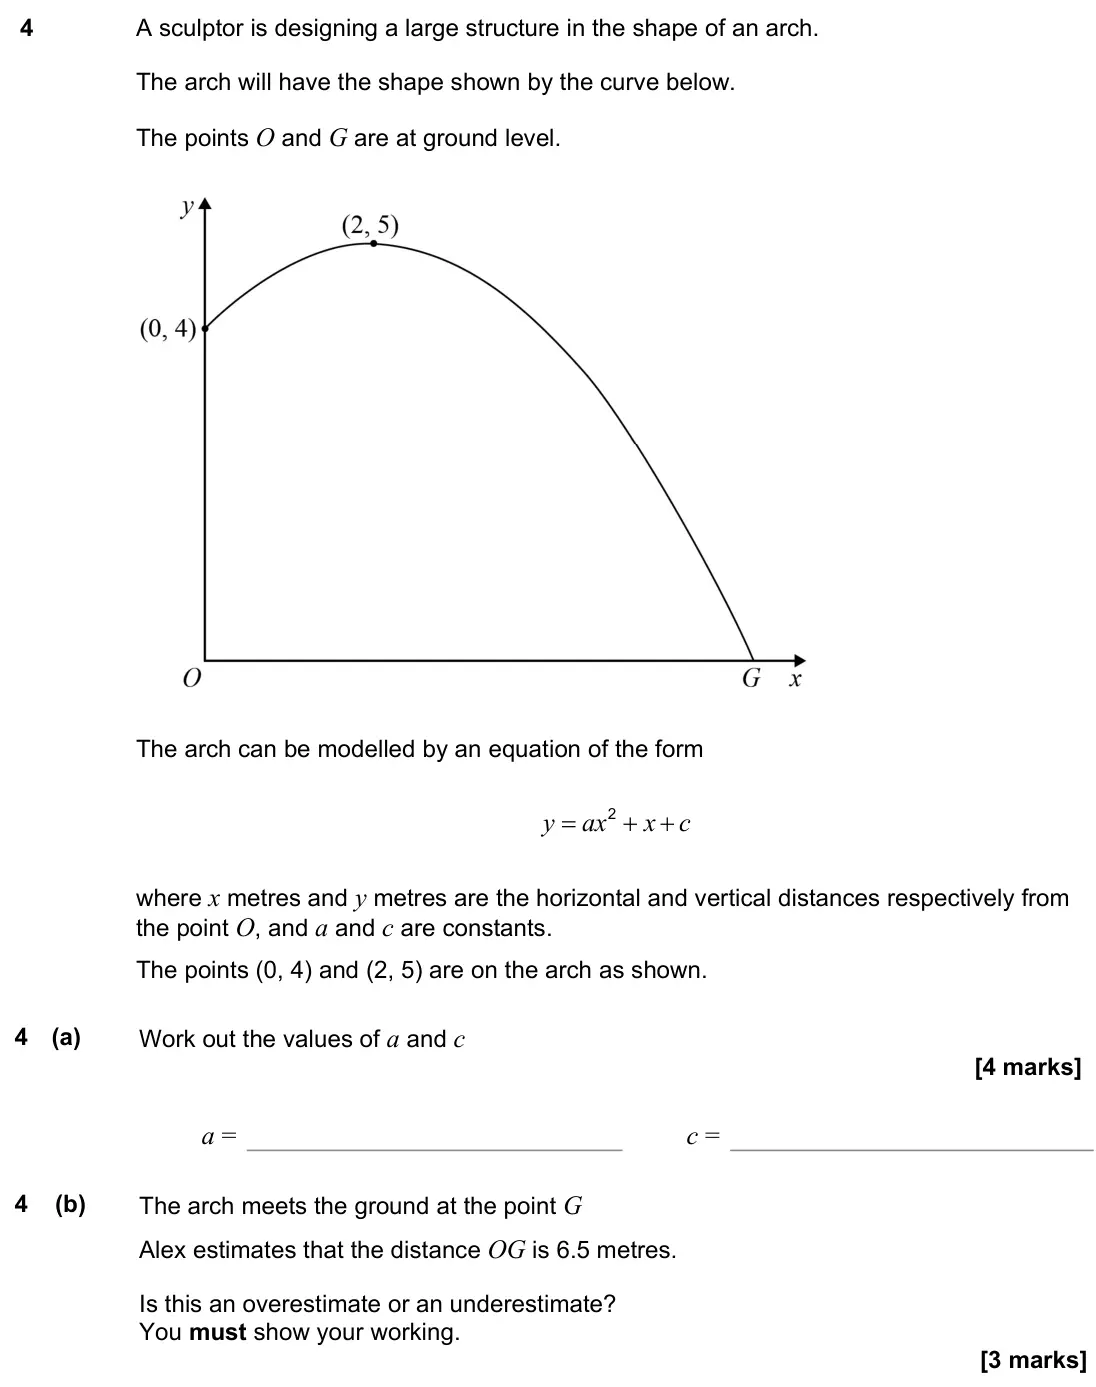
    Original question 4: A sculptor is designing a large structure in the shape of an arch. The arch will have the shape shown by the curve below. The points O and G are at ground level

    Loading the question…

  8. Q3

    June 2016 · Paper 2C

    The whole paper ↗
    8
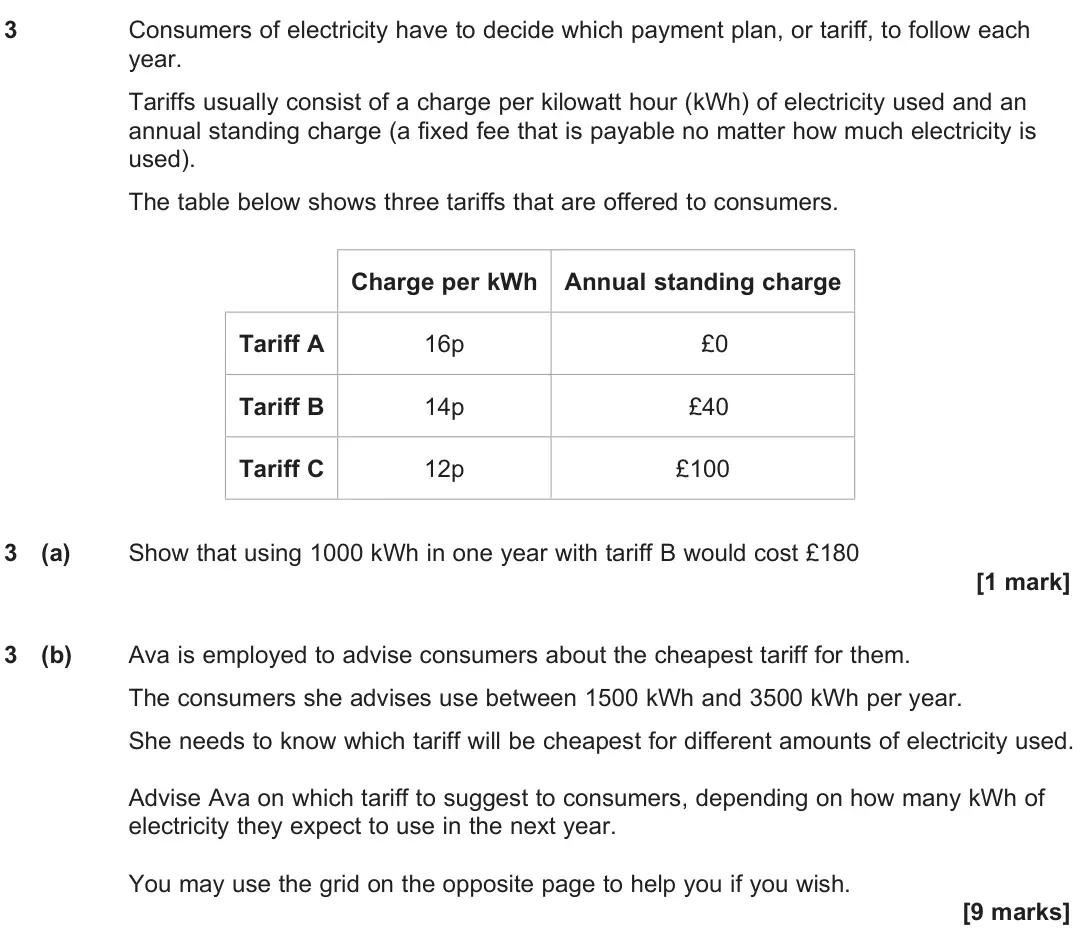
    Original question 3: Consumers of electricity have to decide which payment plan, or tariff, to follow each year. Tariffs usually consist of a charge per kilowatt hour (kWh) of elect

    Loading the question…

  9. Q4

    June 2016 · Paper 2C

    The whole paper ↗
    9
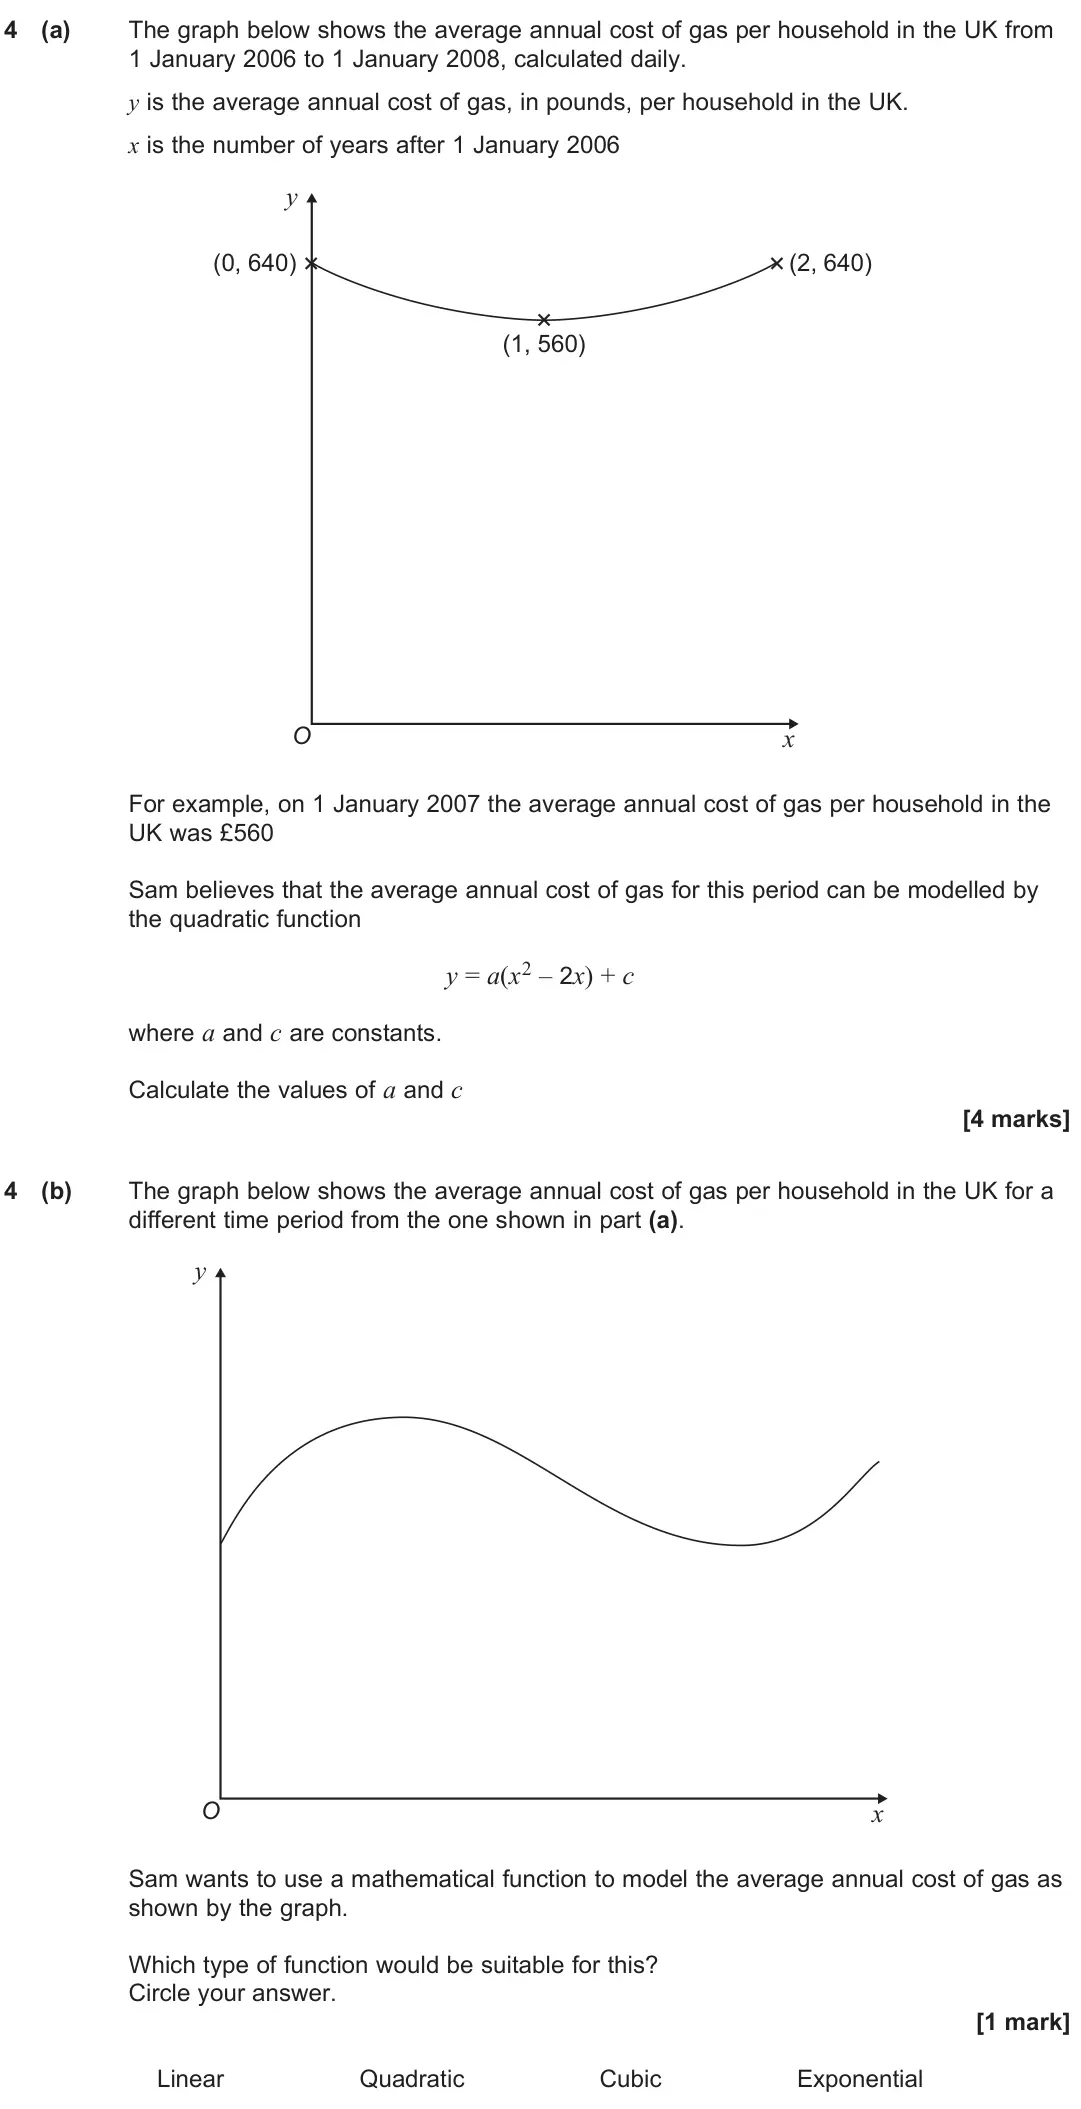
    Original question 4: (a) The graph below shows the average annual cost of gas per household in the UK from 1 January 2006 to 1 January 2008, calculated daily. y is the average annua

    Loading the question…

  10. Q5

    June 2016 · Paper 2C

    The whole paper ↗
    10
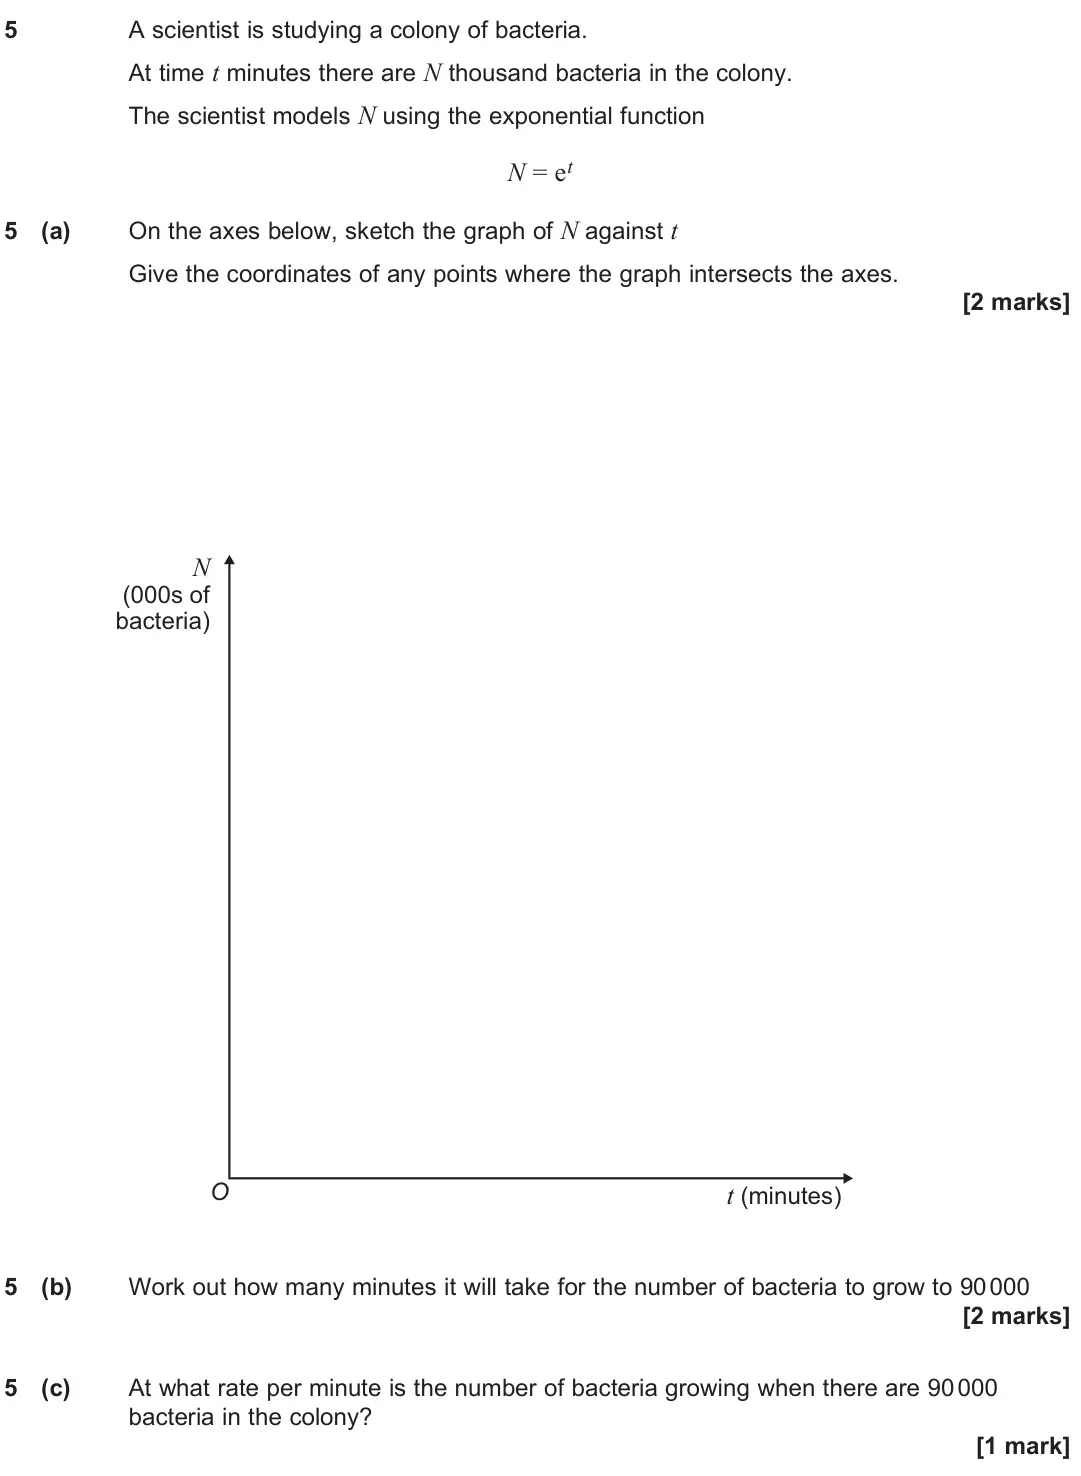
    Original question 5: A scientist is studying a colony of bacteria. At time t minutes there are N thousand bacteria in the colony. The scientist models N using the exponential functi

    Loading the question…

  11. Q6

    Specimen · Paper 2C

    The whole paper ↗
    11
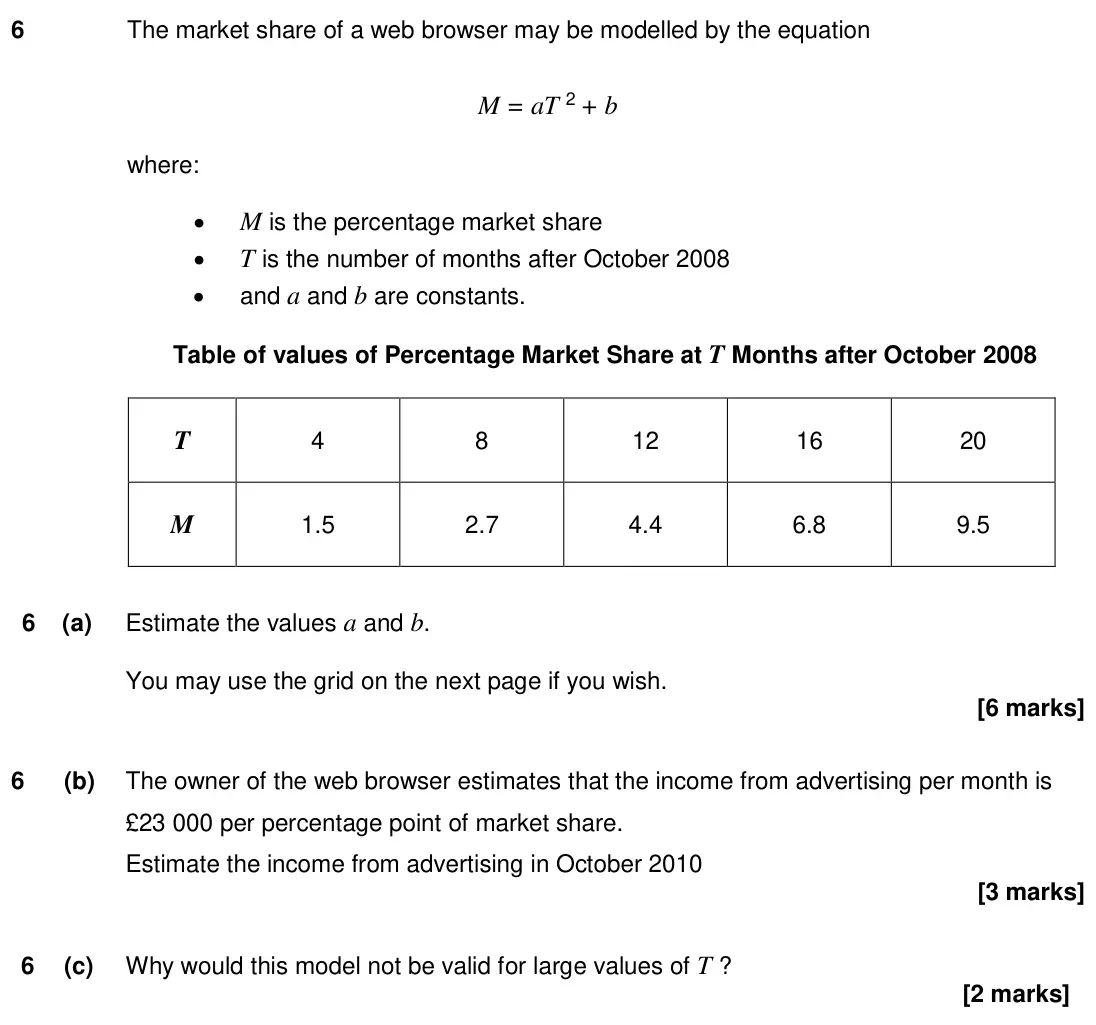
    Original question 6: The market share of a web browser may be modelled by the equation M = aT 2 + b where: • M is the percentage market share • T is the number of months after Octob

    Loading the question…

All 11 questions on Graphs of functions, as a list
  1. June 2025, Paper 2C, Q3 (4 marks): Television (TV) screen sizes represent the diagonal distance between corners, d, measured in inches (''). A guide for standard TV screen sizes is shown below. N
  2. June 2024, Paper 2C, Q4 (8 marks): The height of ocean waves is affected by wind speed. Wave height, h metres, can be modelled against wind speed, s miles per hour, using the equation h = 0.001s2
  3. June 2024, Paper 2C, Q5 (7 marks): 80 local football teams are ranked. Each team has a ranking value, R, from 1 to 80, with R = 1 for the best performing team. 5 (a) In August 2022, the ranking o
  4. June 2023, Paper 2C, Q4 (4 marks): A tennis ball is hit across a tennis court. The graph shows the height of the ball as it travels across the court. 0.0 2 0 4 6 8 10 12 14 16 18 20 1.0 2.0 3.0 0
  5. June 2022, Paper 2C, Q6 (8 marks): A rollercoaster is constructed by joining sections of track. Equations are used to design each section of track. 6 (a) The side elevation of the first section o
  6. June 2019, Paper 2C, Q3 (10 marks): A stone is dropped from a bridge into a river. The distance, d metres, that the stone has fallen after t seconds is modelled by d = 4.9 t 2 3 (a) Complete the t
  7. June 2017, Paper 2C, Q4 (7 marks): A sculptor is designing a large structure in the shape of an arch. The arch will have the shape shown by the curve below. The points O and G are at ground level
  8. June 2016, Paper 2C, Q3 (10 marks): Consumers of electricity have to decide which payment plan, or tariff, to follow each year. Tariffs usually consist of a charge per kilowatt hour (kWh) of elect
  9. June 2016, Paper 2C, Q4 (5 marks): (a) The graph below shows the average annual cost of gas per household in the UK from 1 January 2006 to 1 January 2008, calculated daily. y is the average annua
  10. June 2016, Paper 2C, Q5 (5 marks): A scientist is studying a colony of bacteria. At time t minutes there are N thousand bacteria in the colony. The scientist models N using the exponential functi
  11. Specimen, Paper 2C, Q6 (11 marks): The market share of a web browser may be modelled by the equation M = aT 2 + b where: • M is the percentage market share • T is the number of months after Octob

Questions, mark schemes and examiner’s reports are © AQA, from their published past papers. Plumi isn’t affiliated with any exam board. Want whole papers? AQA Level 3 Core Maths past papers.

The Plumi iPad app also offers exam-style questions with AI feedback on your handwritten working.