 plumi
Graphs in financial contexts: AQA Level 3 Core Maths questions
AQA Level 3 Core Maths past-paper questions on F5 Graphs in financial contexts, 2016–2025, with mark schemes and examiner’s reports where available.
Paper
All papers
Exam
All years
Loading the full question list…
All 2 questions on Graphs in financial contexts, as a list
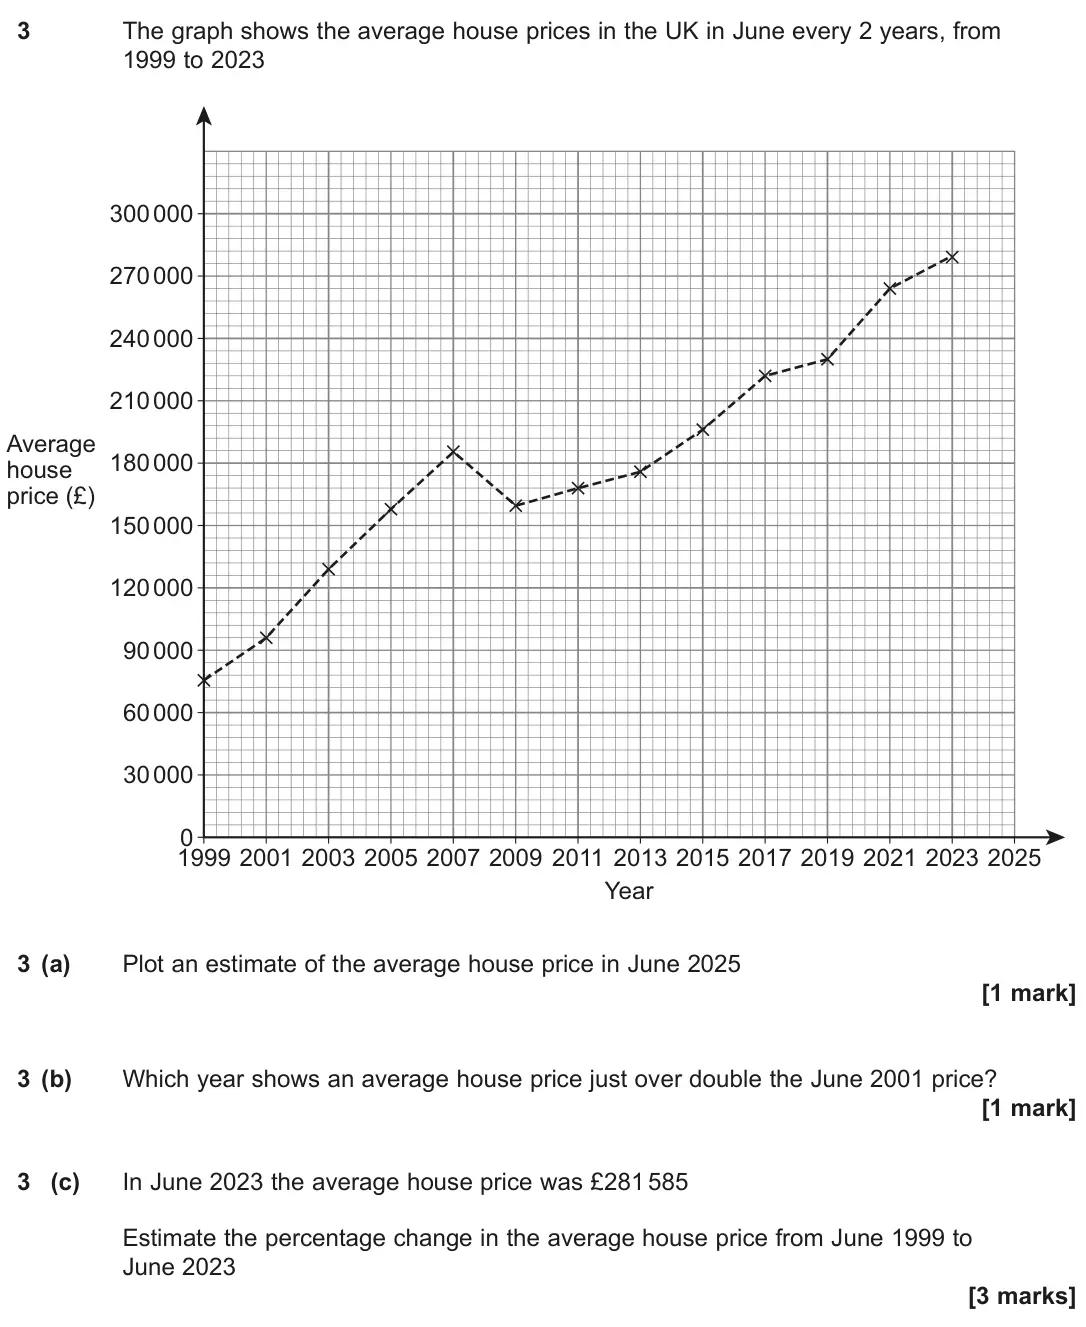
- June 2025, Paper 1, Q3 (5 marks): The graph shows the average house prices in the UK in June every 2 years, from 1999 to 2023 2007 2011 2015 1999 0 60 000 120 000 180 000 240 000 300 000 2003 Ye
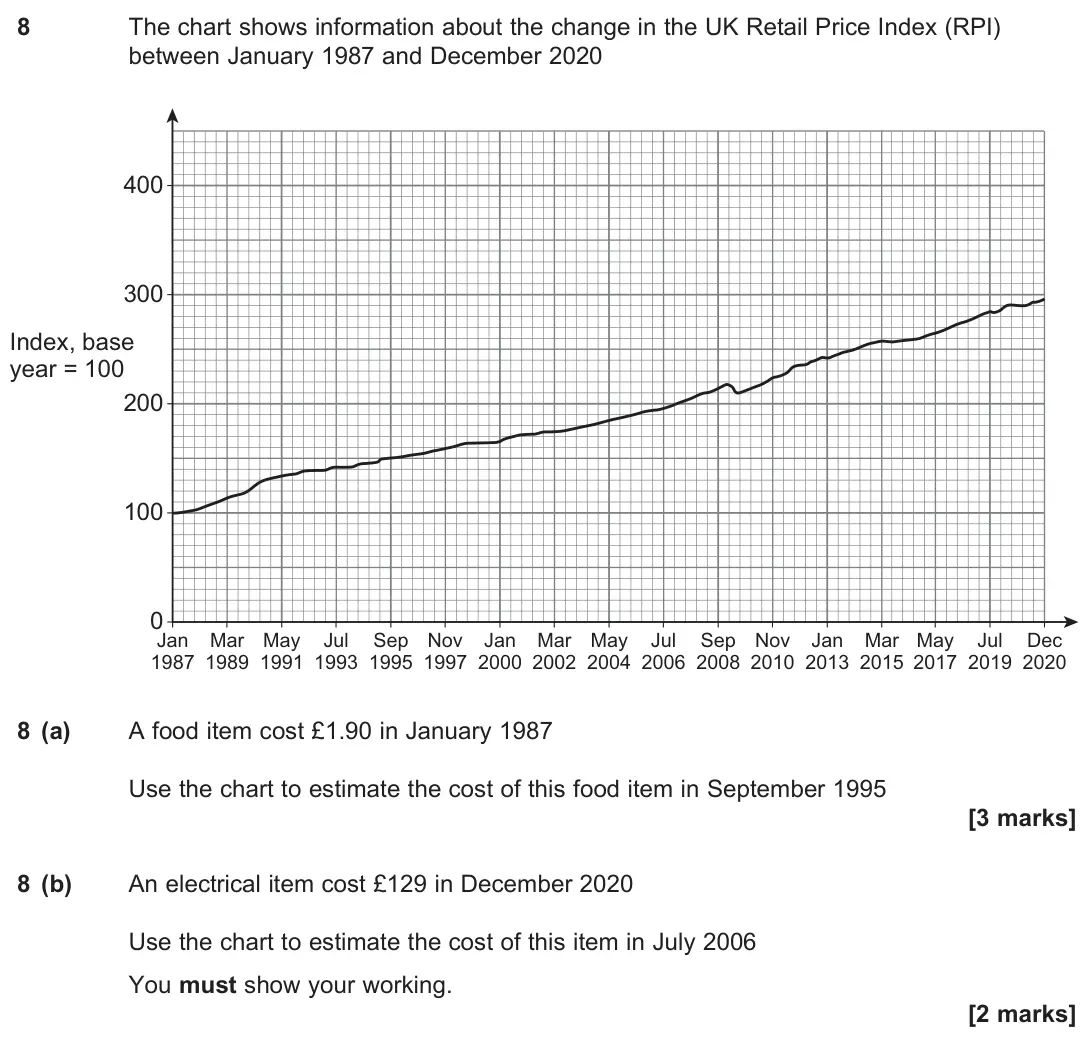
- June 2022, Paper 1, Q8 (5 marks): The chart shows information about the change in the UK Retail Price Index (RPI) between January 1987 and December 2020 Sep 1995 Jan 2000 Index, base year = 100
Questions, mark schemes and examiner’s reports are © AQA, from their published past papers. Plumi isn’t affiliated with any exam board. Want whole papers? AQA Level 3 Core Maths past papers.
The Plumi iPad app also offers exam-style questions with AI feedback on your handwritten working.