 plumi
Equilibrium price: AQA GCSE Economics questions
AQA GCSE Economics past-paper questions on 3.1.3.3 Equilibrium price, 2020–2025, with mark schemes and examiner’s reports where available.
Paper
All papers
Exam
All years
Calculations
- 0 words
- 0 words
 0 words
- 0 words
- Your answer
- Your answer
- 0 words
- 0 words
- 0 words
- Your answer
- Your answer
Q19.1
The whole paper ↗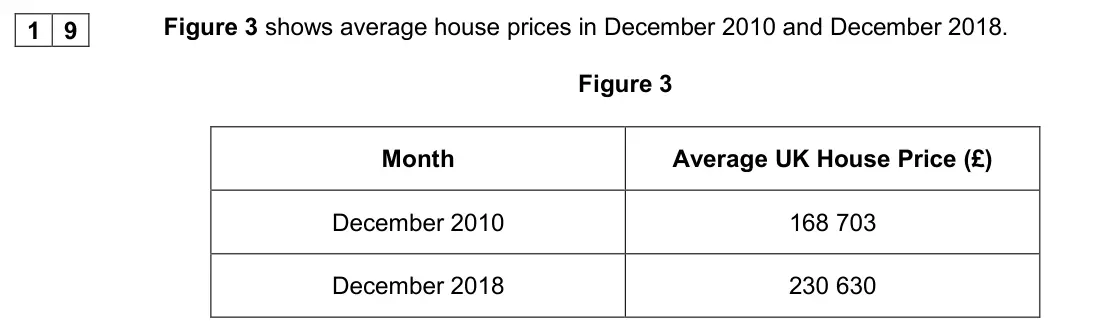 0 words
Q19.2
The whole paper ↗0 words- 0 words
All 14 questions on Equilibrium price, as a list
- June 2025, Paper 1, Q13 (2 marks): 1 3 Explain one possible reason for a decrease in the equilibrium price of televisions. [2 marks]
- June 2024, Paper 1, Q20 (3 marks): 2 0 Draw and label demand and supply curves on the graph below from the following table of information. Clearly identify the equilibrium price and quantity. [3
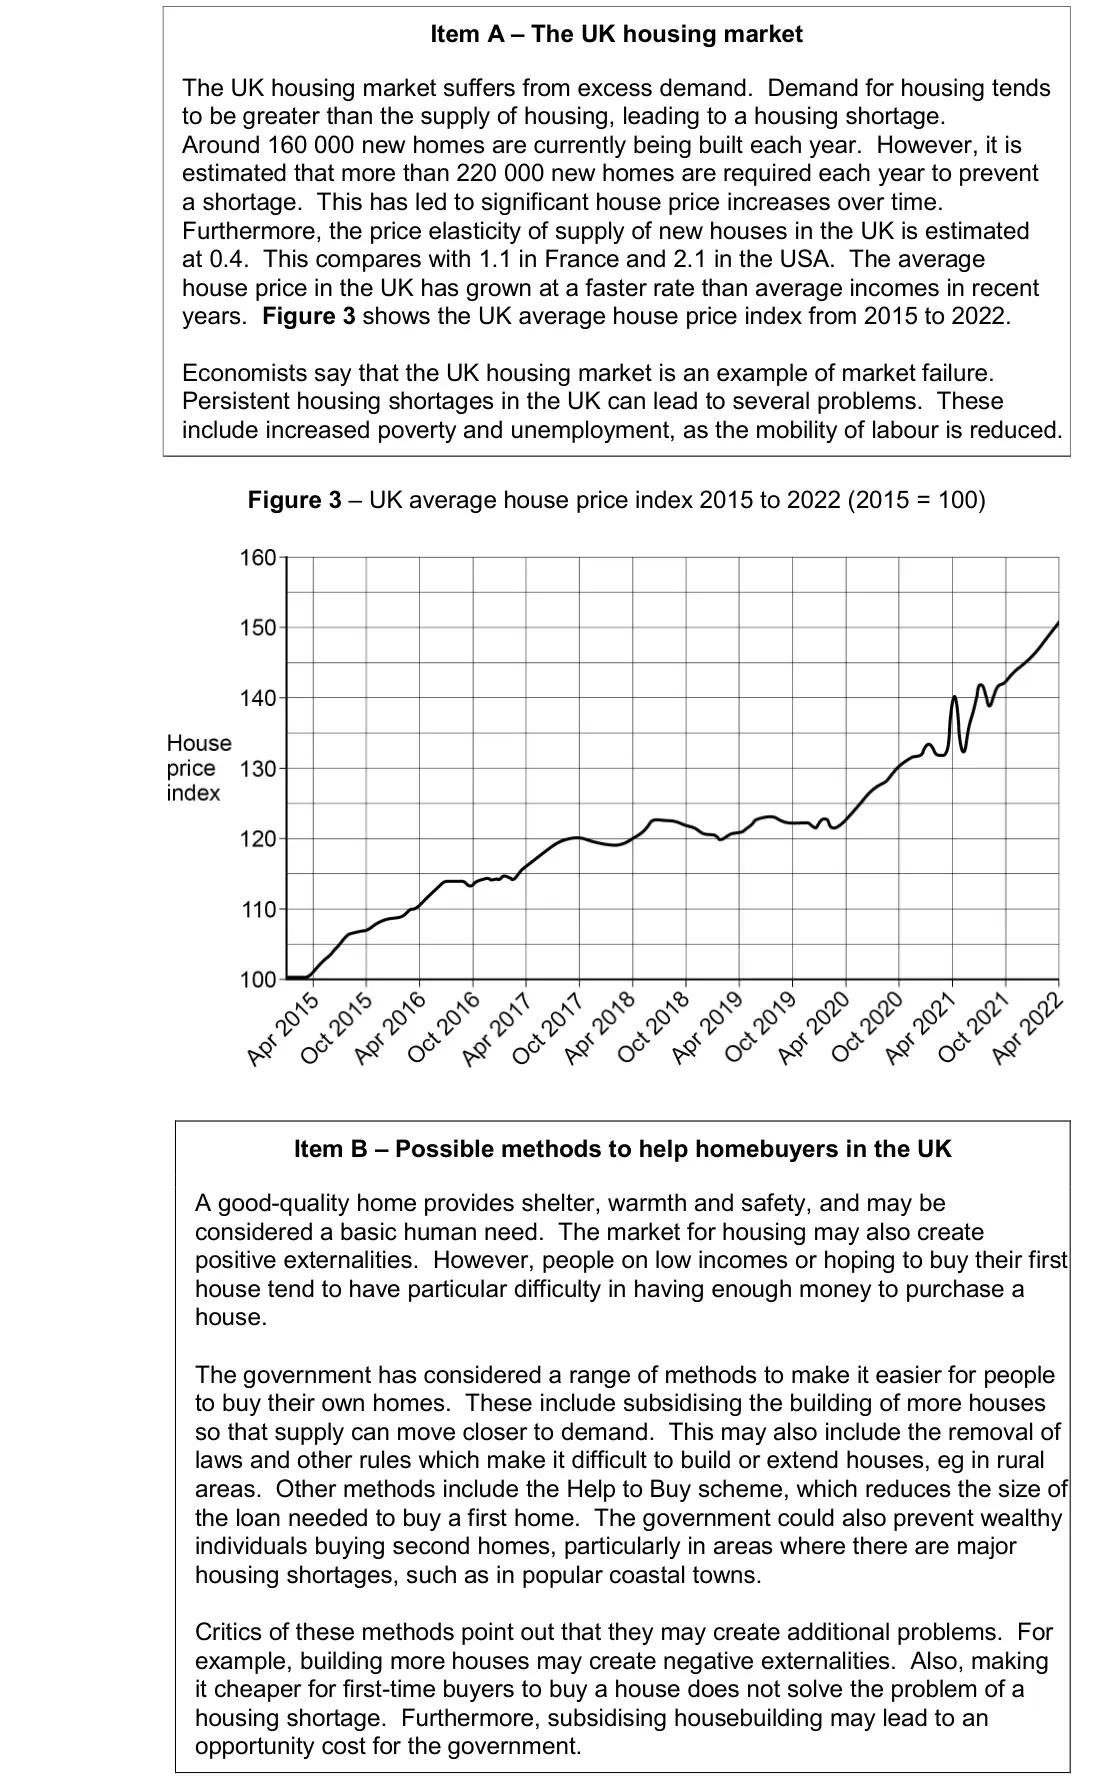
- June 2024, Paper 1, Q23 (3 marks): 2 3 Using Figure 3, on page 17, calculate the percentage change in the UK average house price index between April 2017 and April 2022. Give your answer to the n
- June 2024, Paper 1, Q25 (6 marks): 2 5 Explain two possible disadvantages of housing shortages in the UK. [6 marks]
- June 2023, Paper 1, Q1 (1 mark): Which of the following best describes the equilibrium price in a market? [1 mark]
- June 2023, Paper 1, Q10 (1 mark): 100 100 75 125 125 50 150 What is the excess supply at a price of £100 per tonne? [1 mark]
- June 2023, Paper 1, Q20 (3 marks): 2 0 Draw and label the effects of an increase in the price of petrol cars on the market for petrol. [3 marks]
- June 2022, Paper 1, Q13 (2 marks): 1 3 Explain one factor that may lead to an increase in the equilibrium price of carpets. [2 marks]
- June 2022, Paper 1, Q20 (3 marks): 2 0 Draw and label the effects on equilibrium price and quantity of an increase in wage costs within a market. [3 marks]
- November 2021, Paper 1, Q10 (1 mark): 1 0 Figure 1 shows the quantities of tea supplied and demanded at various prices. Figure 1 What is the excess supply at a price of £40 per kg? [1 mark]
- November 2020, Paper 1, Q4 (1 mark): Equilibrium price in a market is best defined as the price at which: [1 mark]
- November 2020, Paper 1, Q19.1 (2 marks): 1 9 . 1 Using Figure 3, calculate the percentage increase in the average UK house price between December 2010 and December 2018. Give your answer to one decimal
- November 2020, Paper 1, Q19.2 (2 marks): 1 9 . 2 Explain one possible reason for the increase in the average UK house price between December 2010 and December 2018. [2 marks]
- November 2020, Paper 1, Q20 (3 marks): Draw and label a supply and demand diagram to show the effects of bad weather on 2 0 the equilibrium price and quantity of coffee beans. [3 marks]
Questions, mark schemes and examiner’s reports are © AQA, from their published past papers. Plumi isn’t affiliated with any exam board. Want whole papers? Full past papers.
The Plumi iPad app also offers exam-style questions with AI feedback on your handwritten working.