 plumi
Quantitative and qualitative skills: AQA A‑Level Geography questions
Every AQA A-Level Geography exam question on 3.2.2.3 Quantitative and qualitative skills, 2020–2025, with its mark scheme and examiner’s report.
Find questions537
Exam
All years
Calculations
Q02.2
The whole paper ↗
Q01.3
The whole paper ↗
Q01.4
The whole paper ↗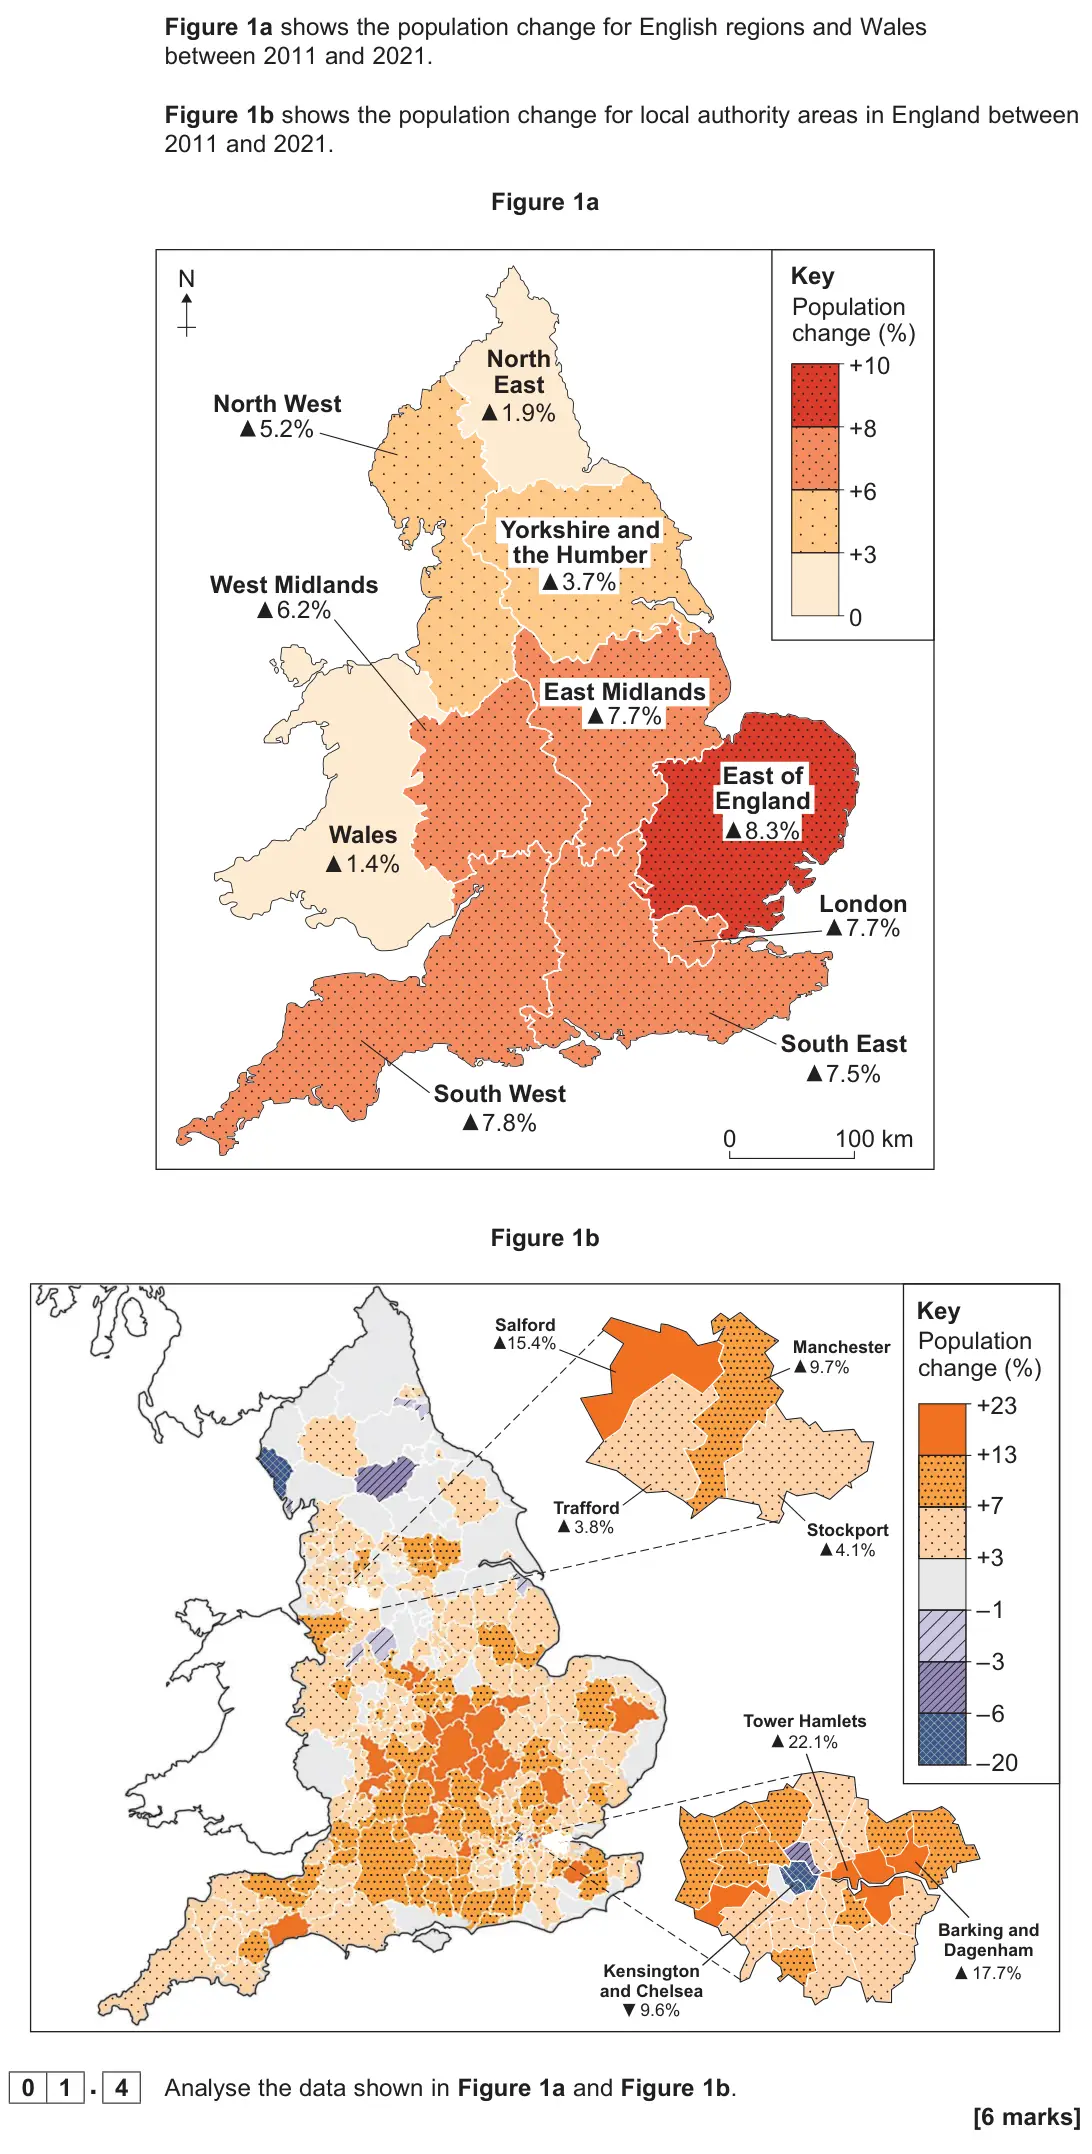
Q02.1
The whole paper ↗
Q02.2
The whole paper ↗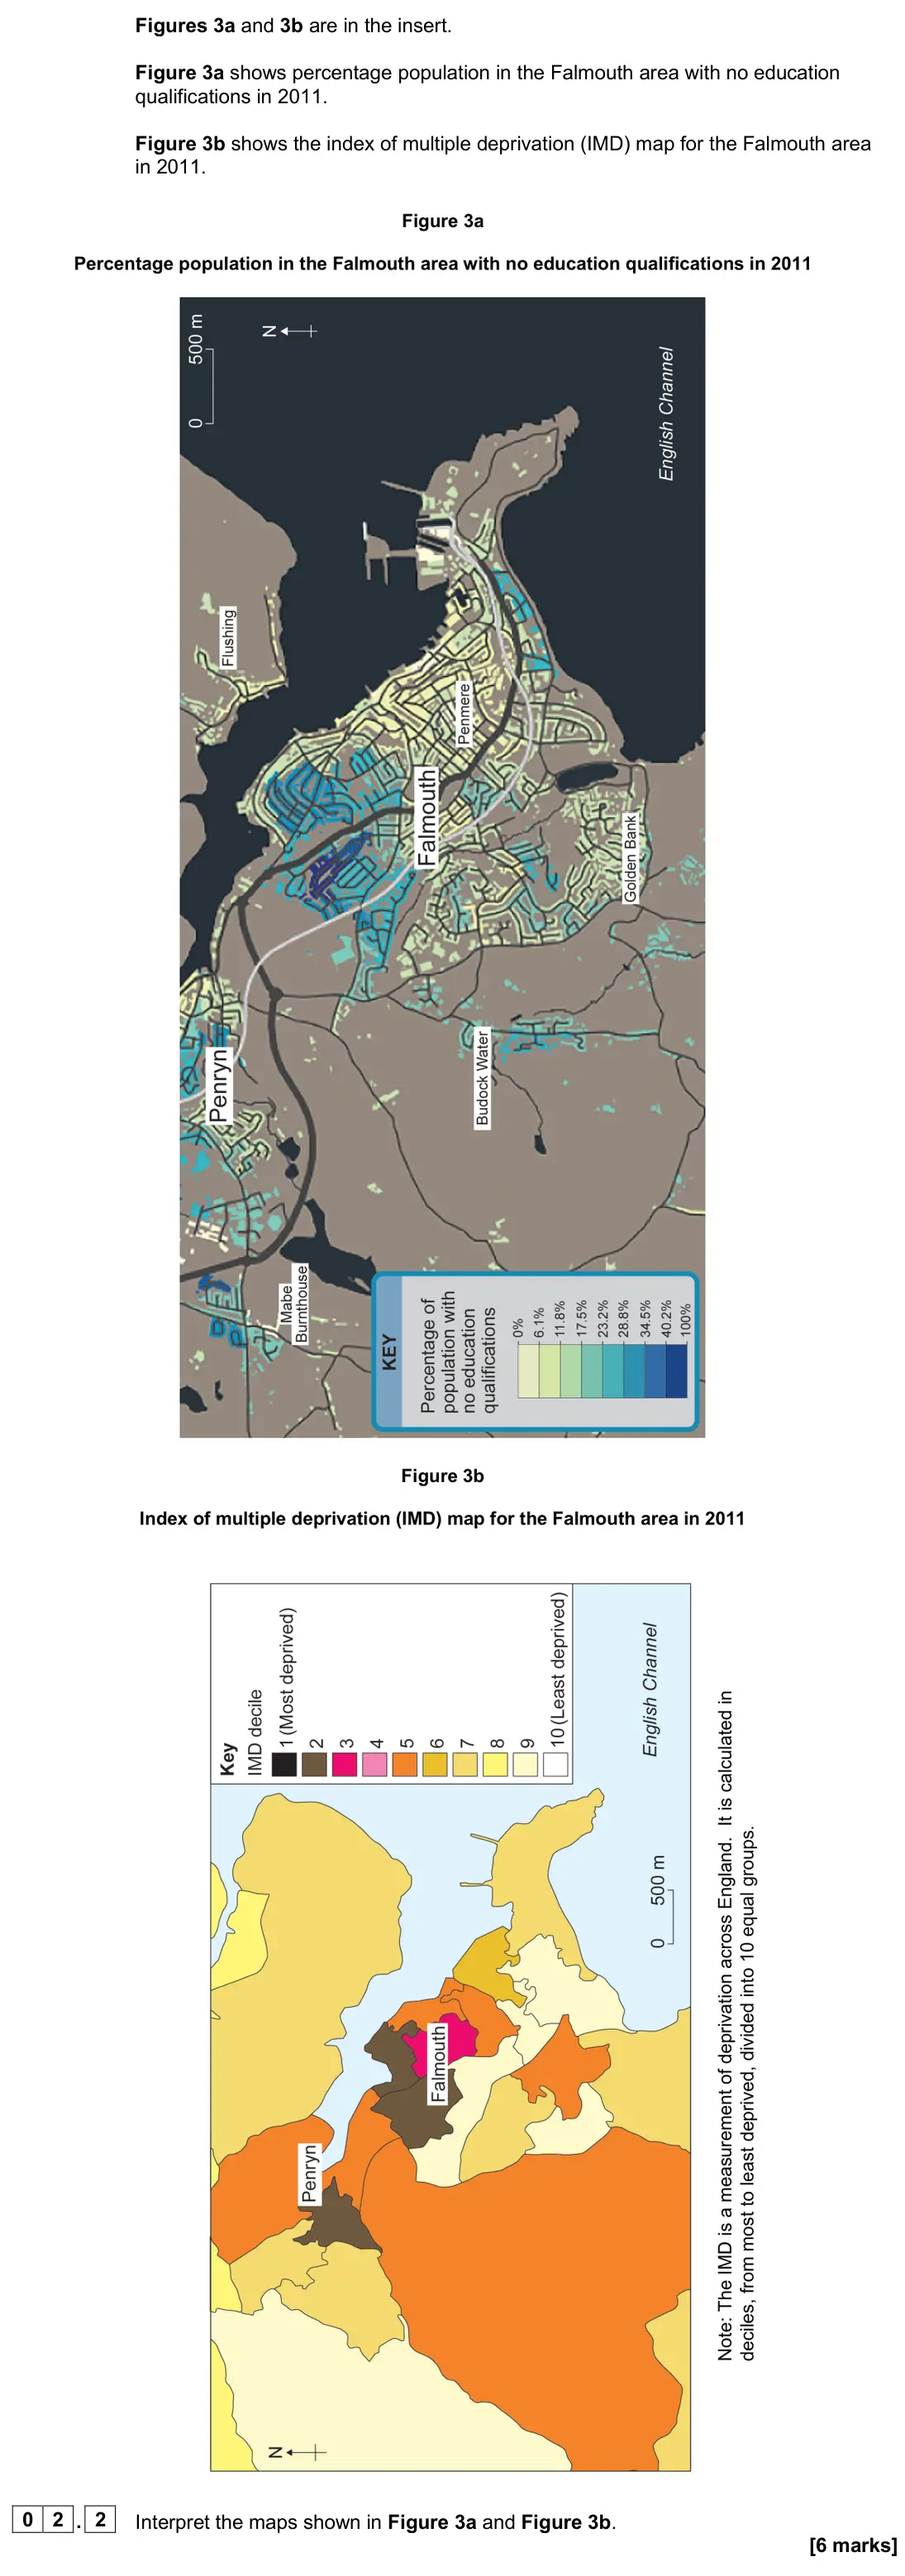
Q01.4
The whole paper ↗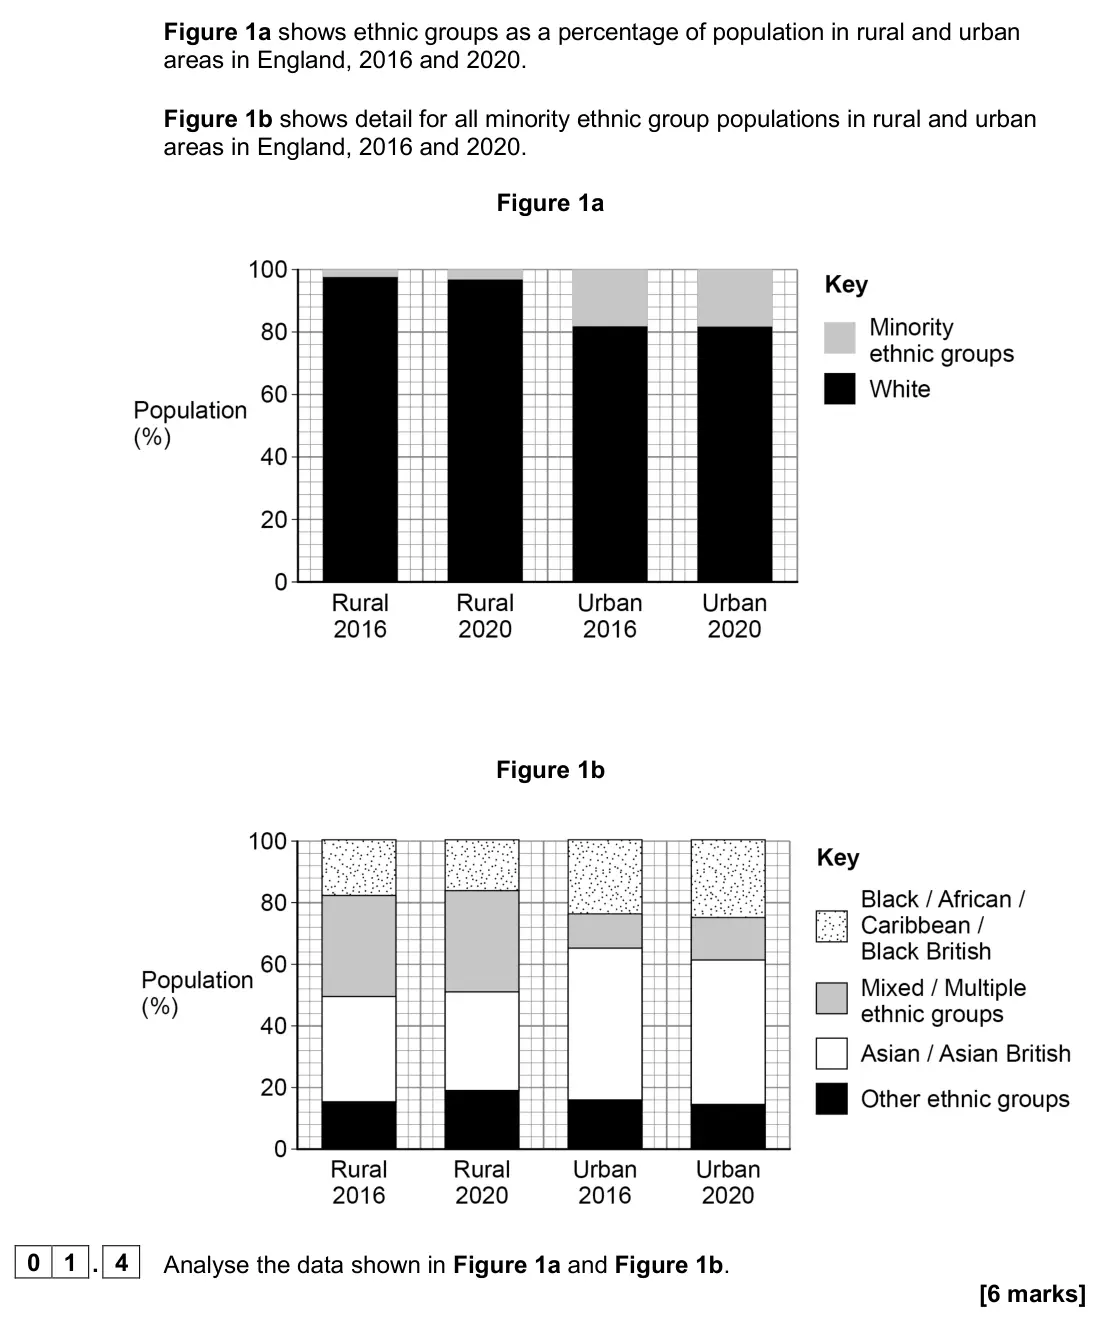
Q02.1
The whole paper ↗
Q02.2
The whole paper ↗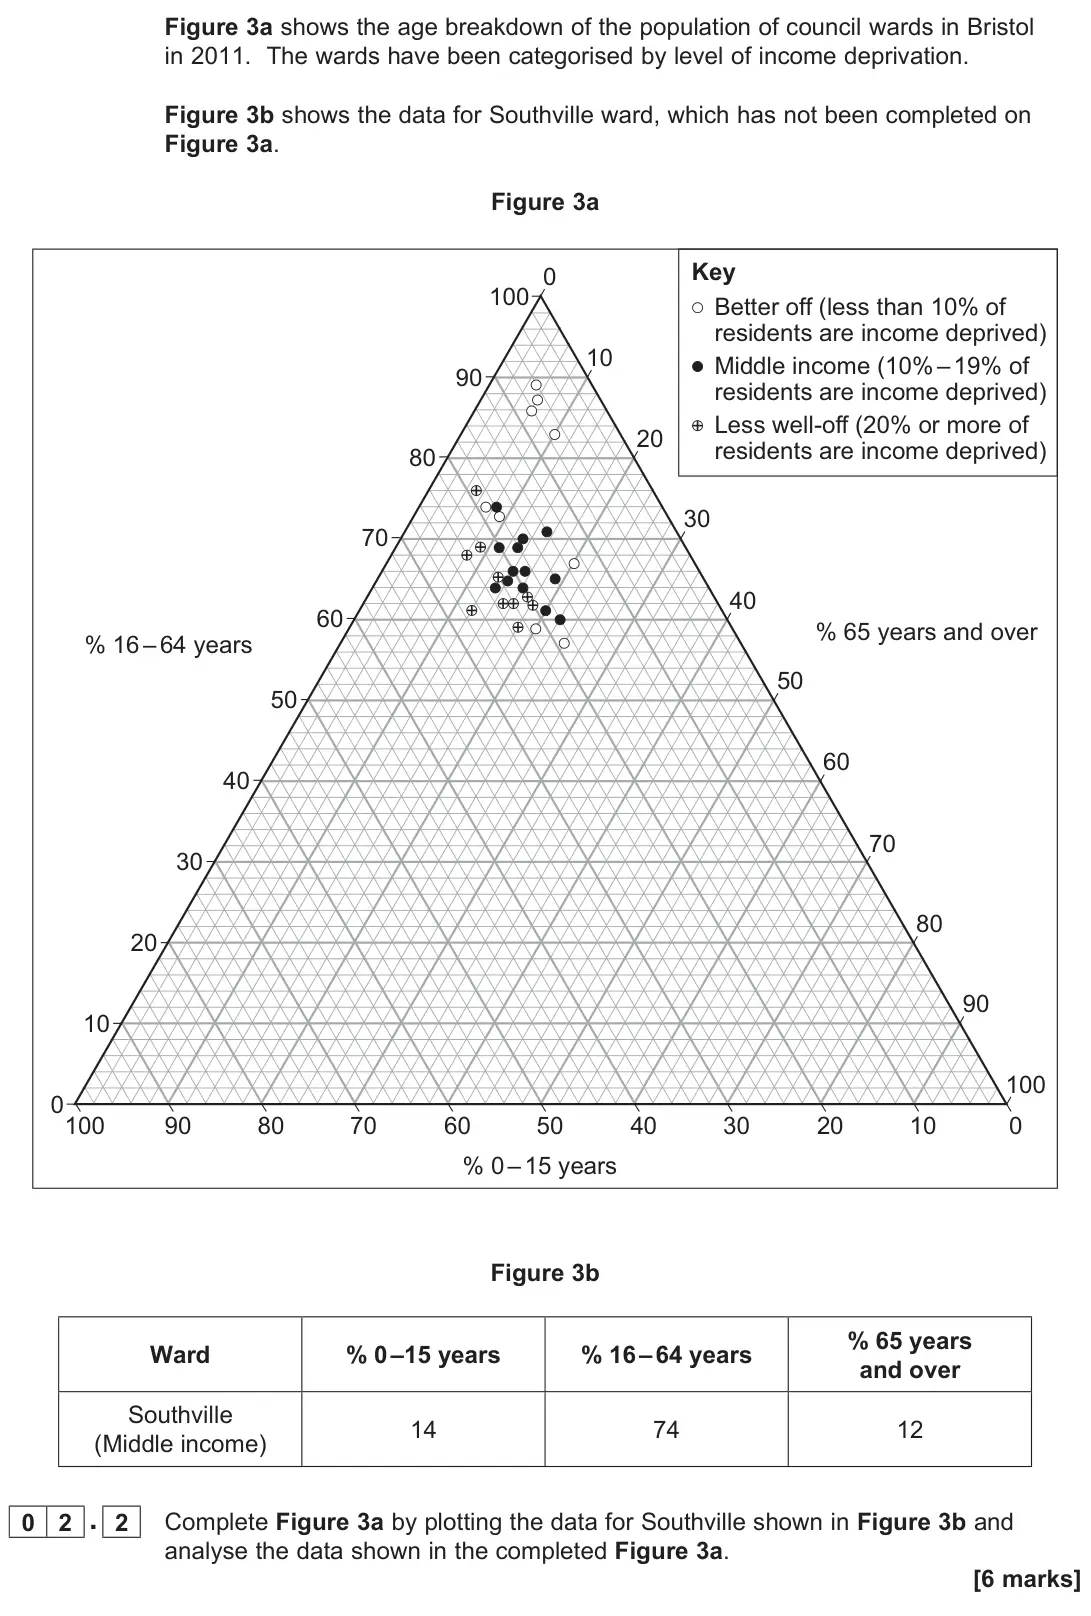
Q01.2
The whole paper ↗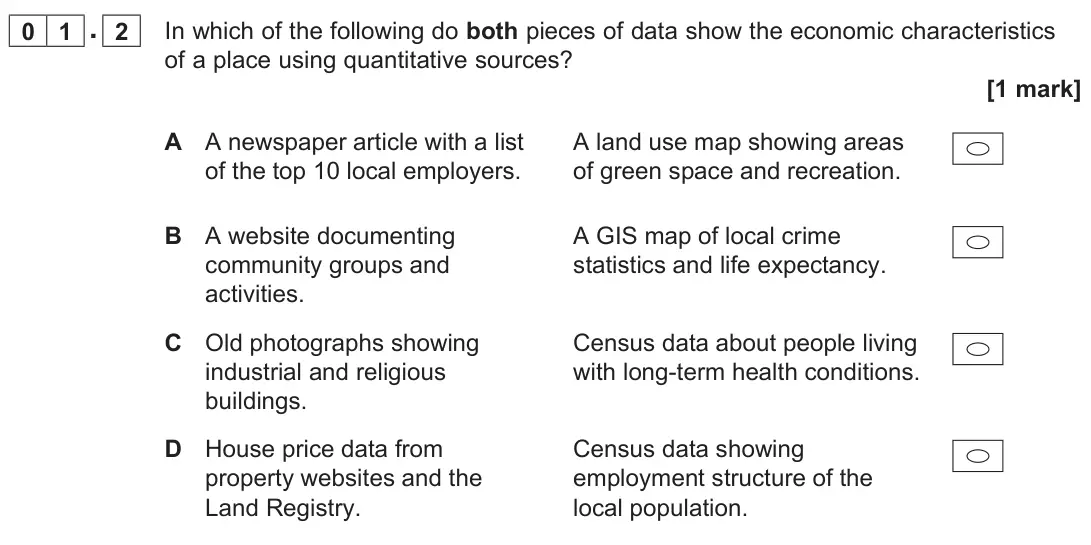
Q01.4
The whole paper ↗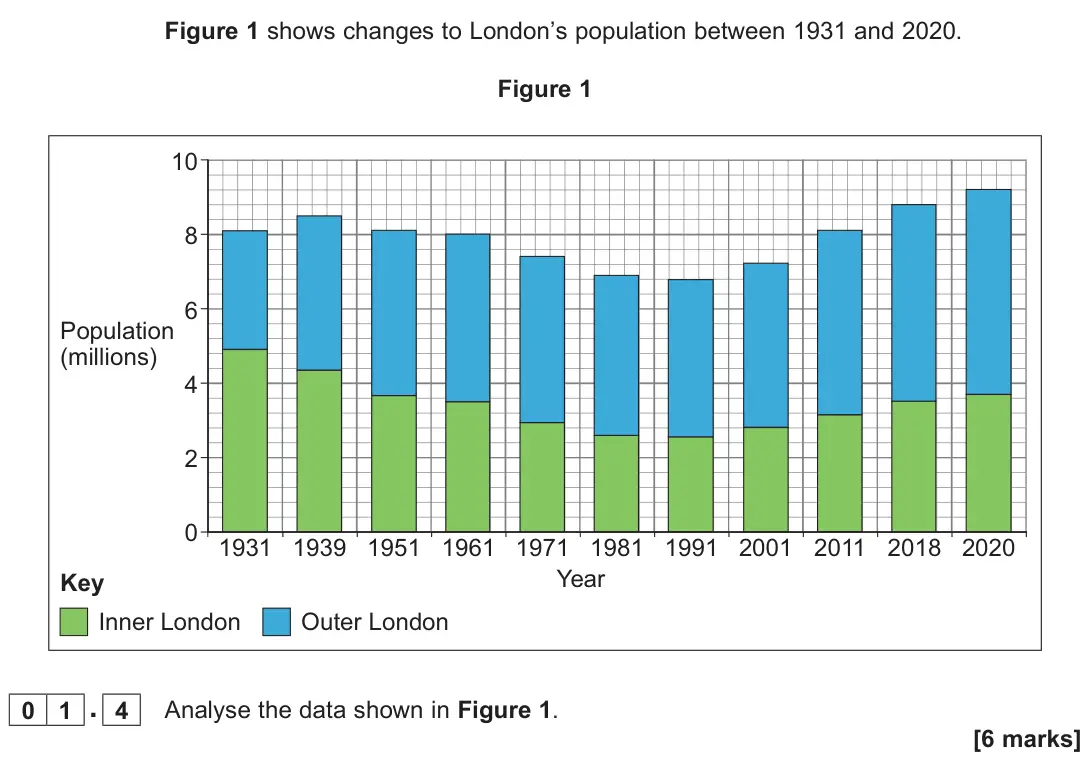
Q02.2
The whole paper ↗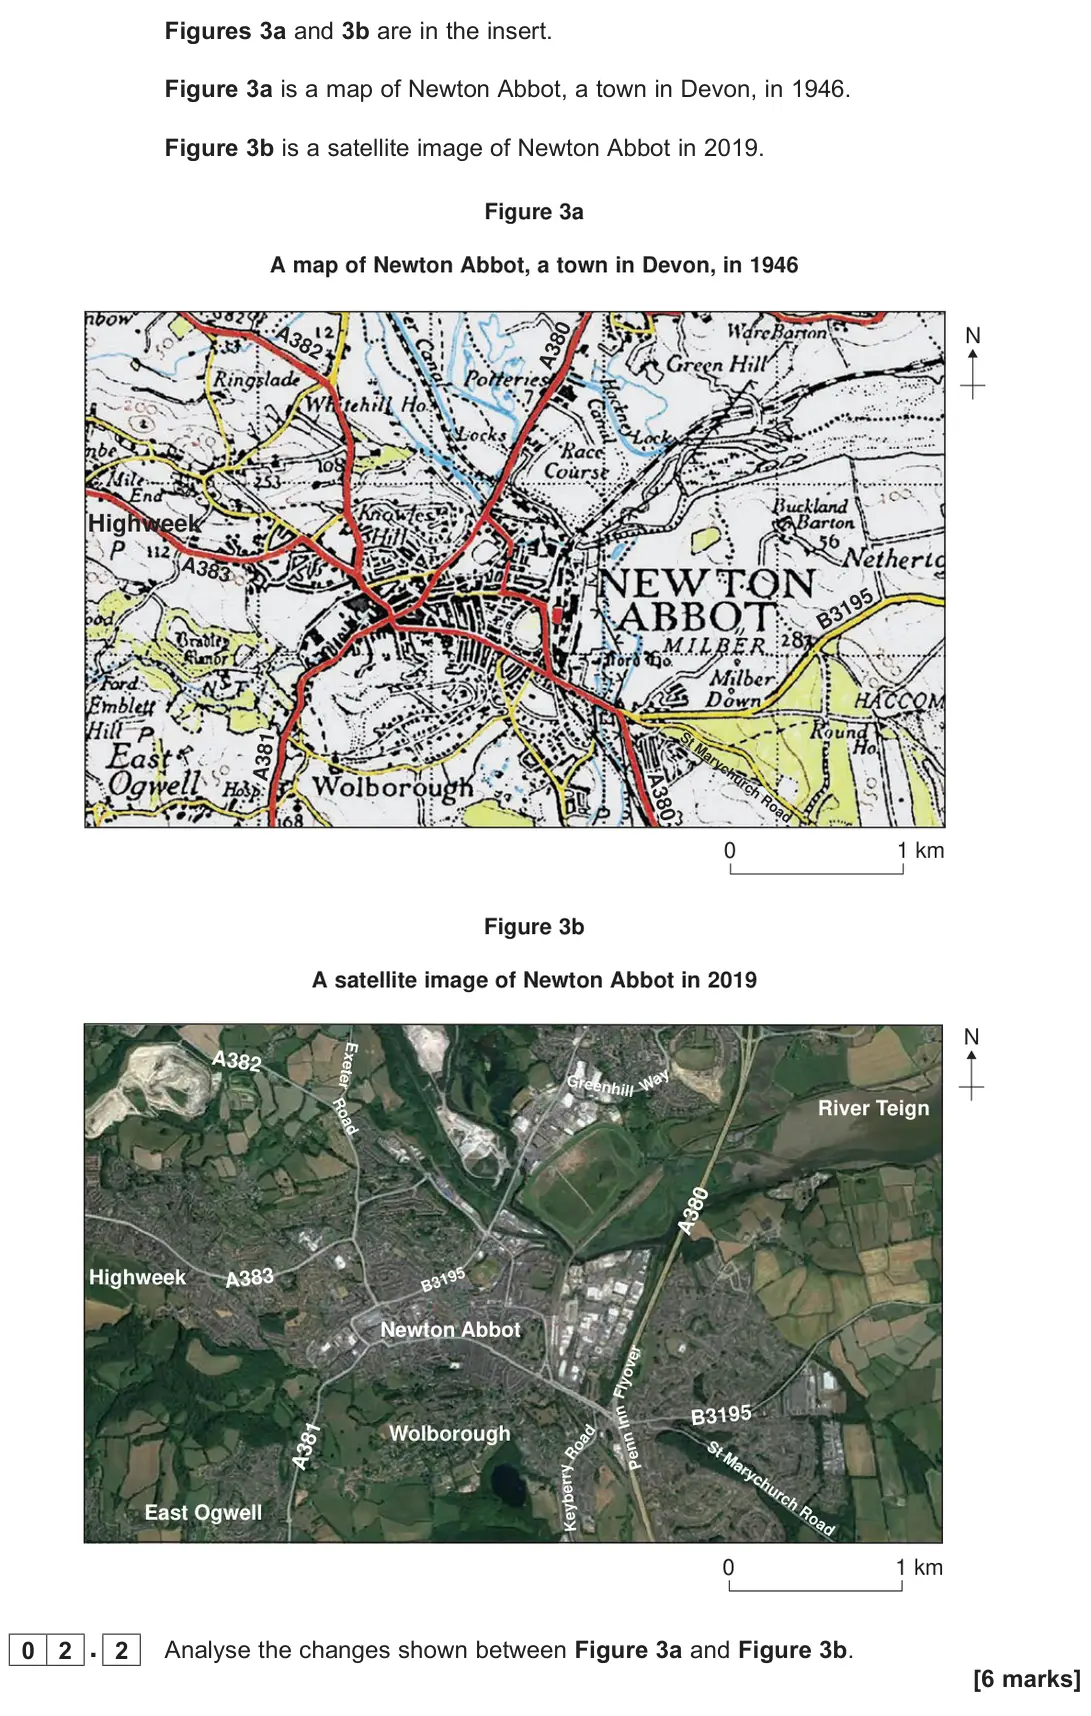
Q01.3
The whole paper ↗
Q01.4
The whole paper ↗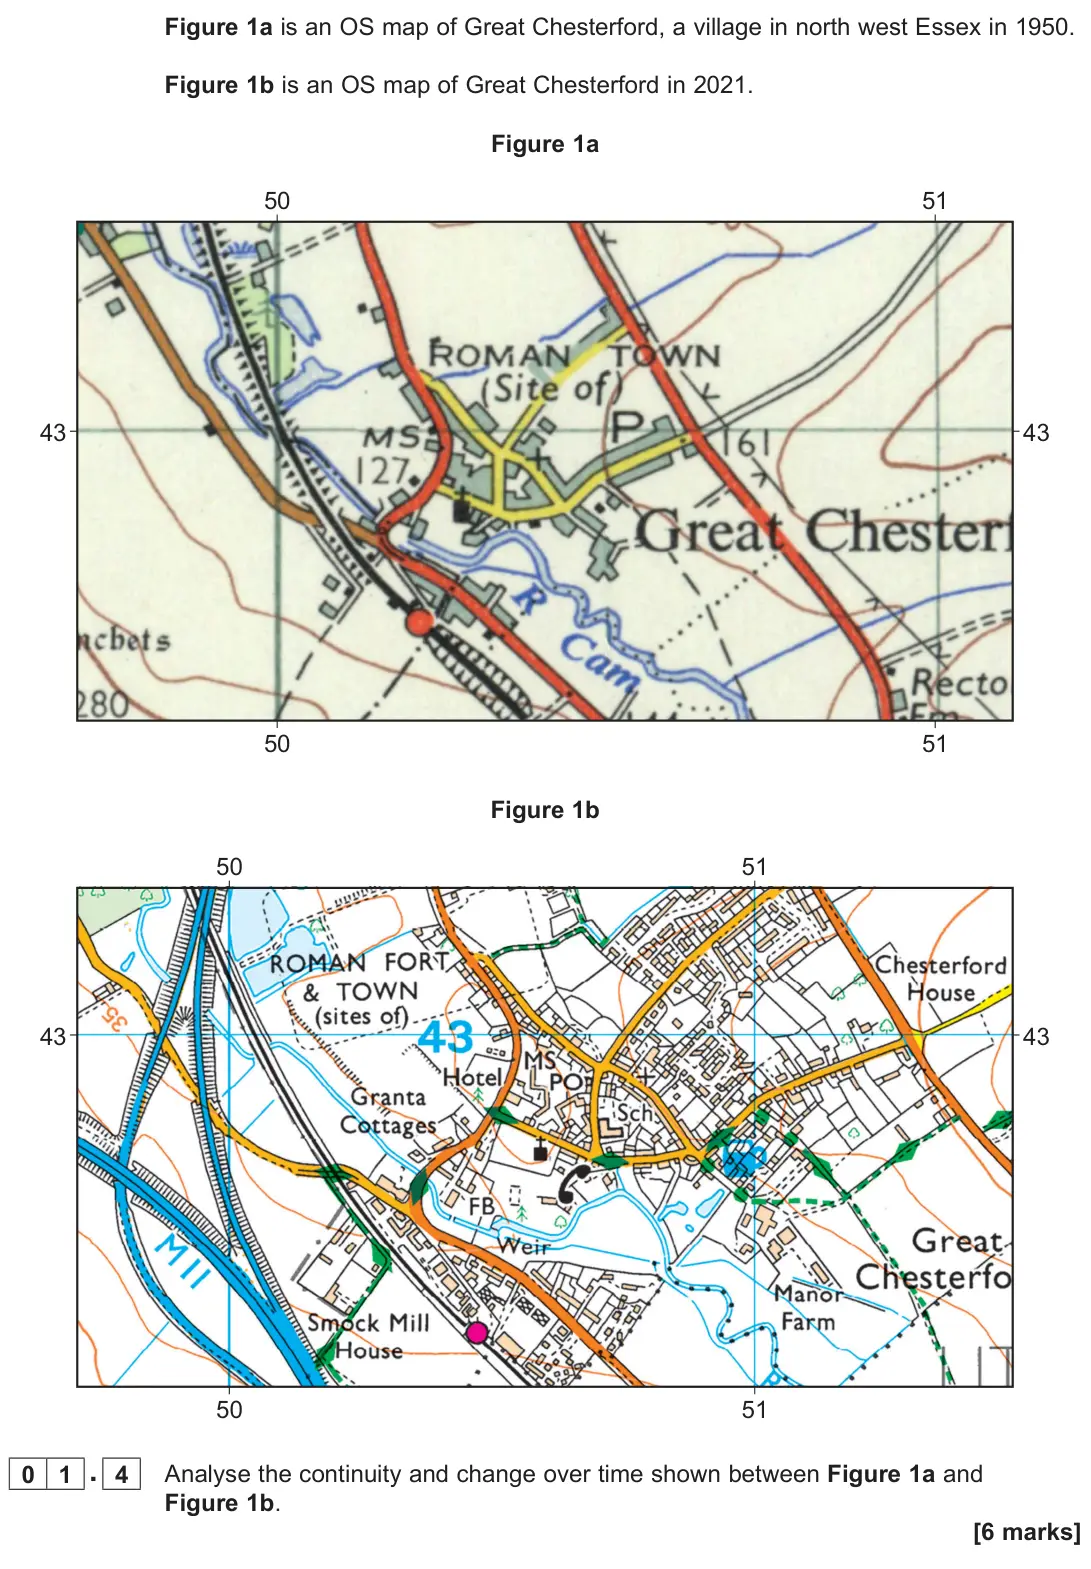
Q01.5
The whole paper ↗
Q02.2
The whole paper ↗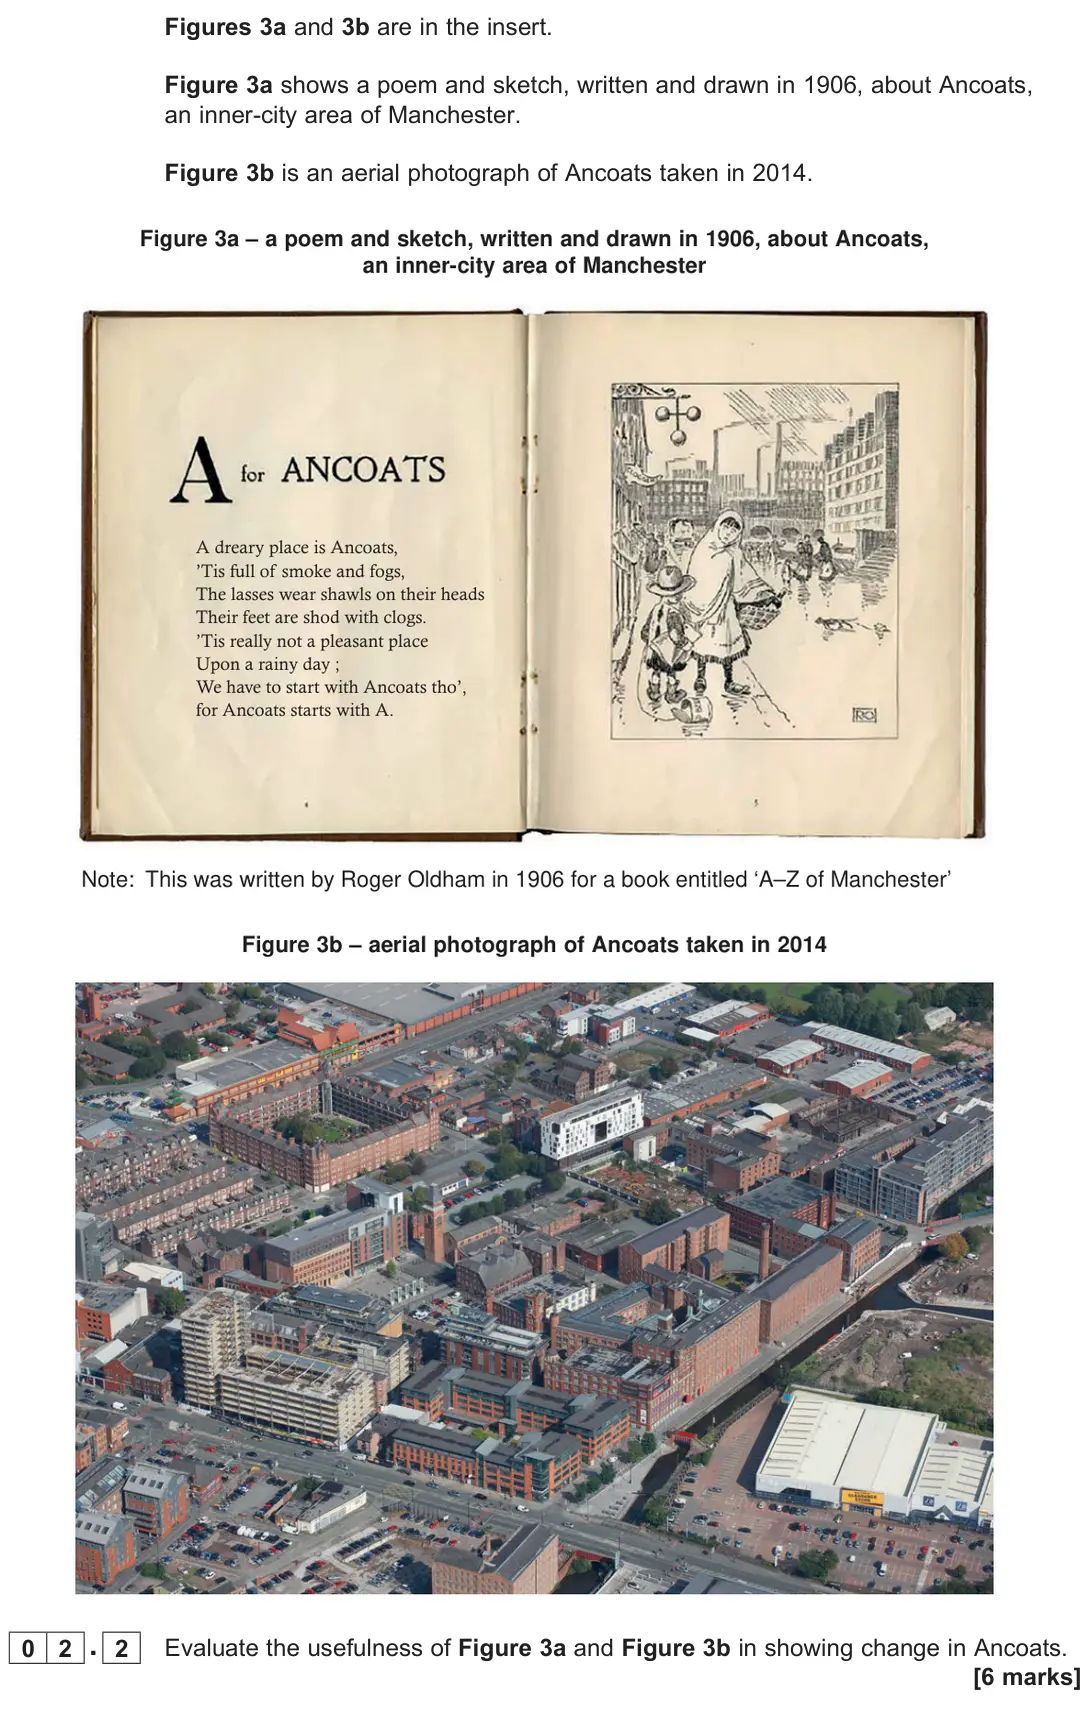
Q02.4
The whole paper ↗
Q02.1
The whole paper ↗
Q02.2
The whole paper ↗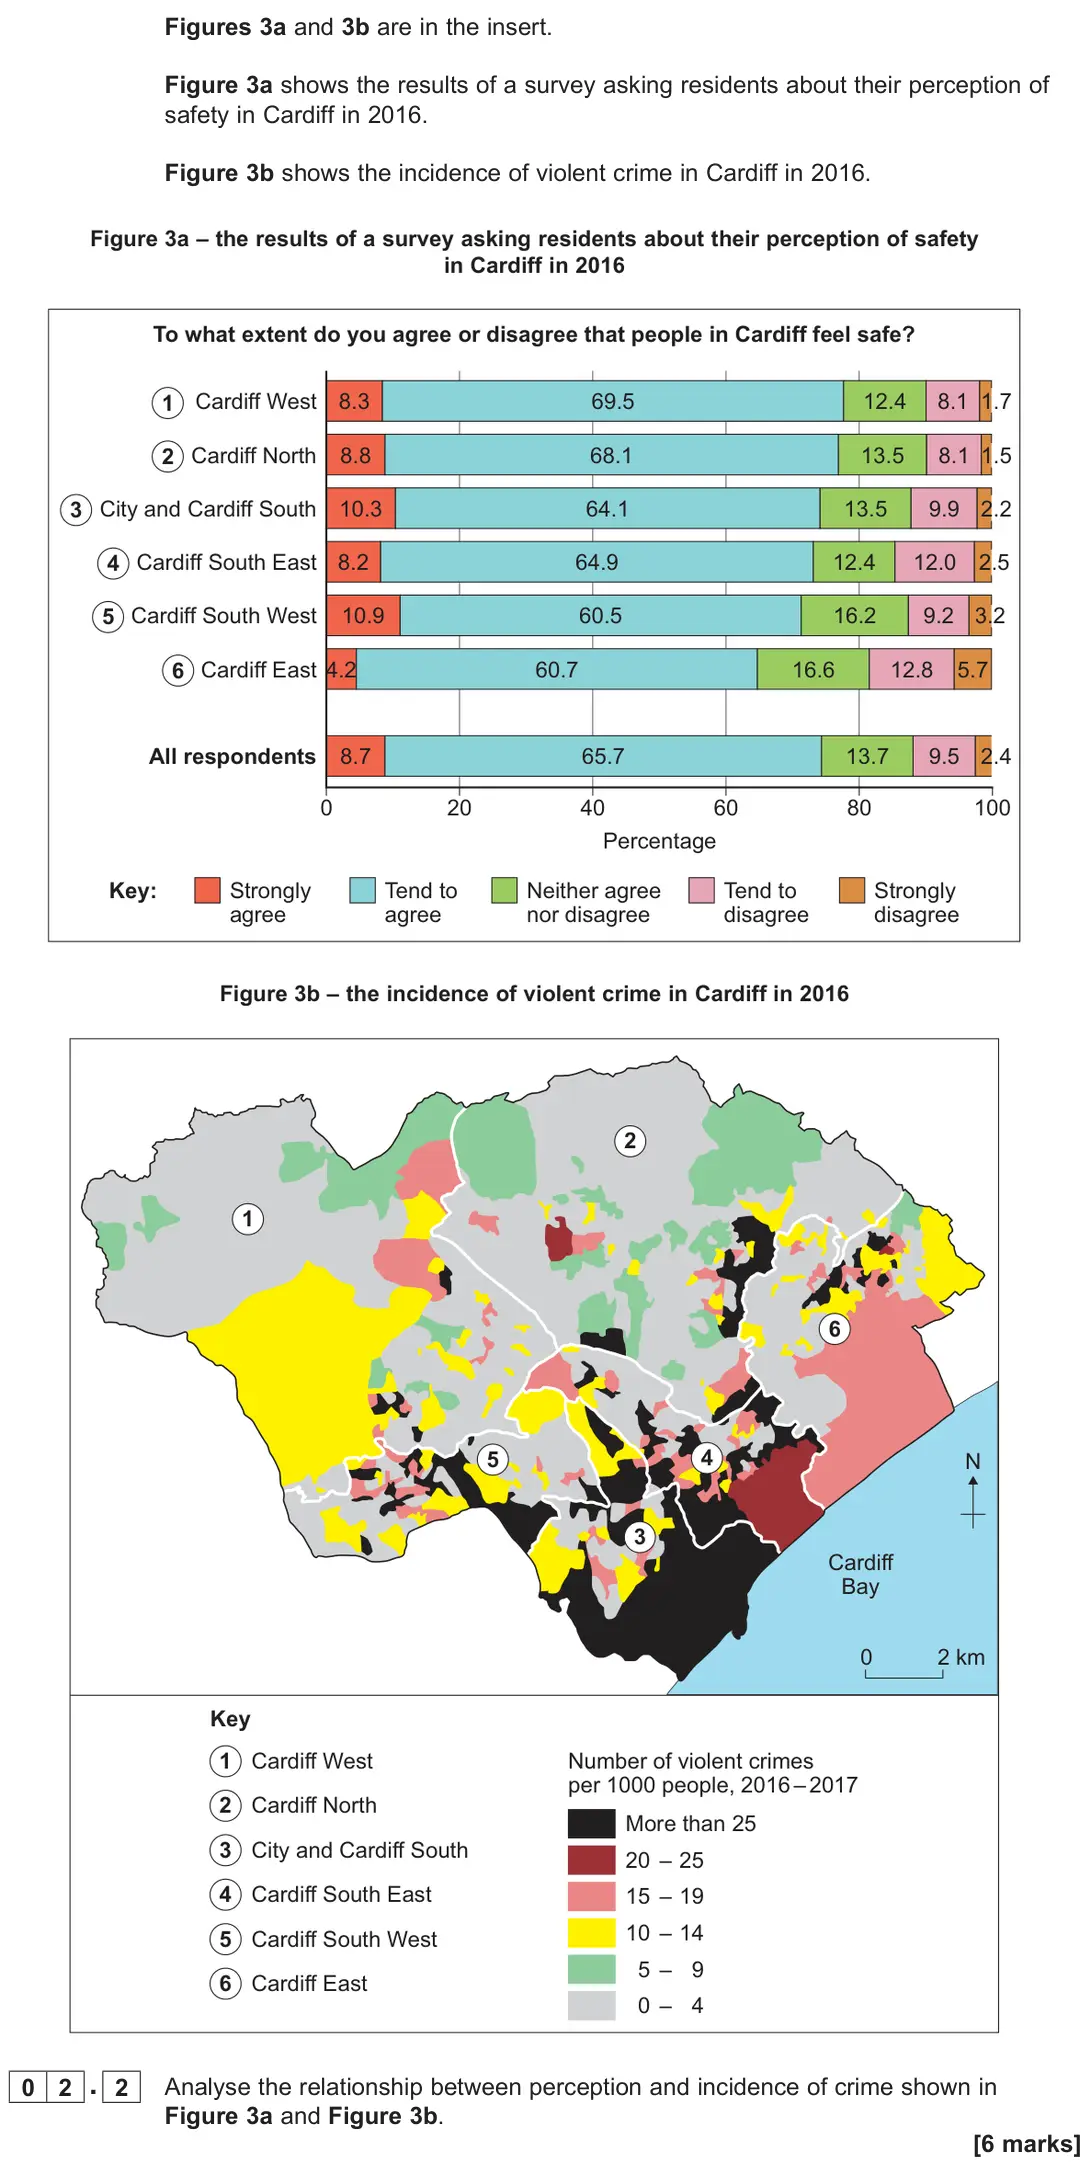
Q01.2
The whole paper ↗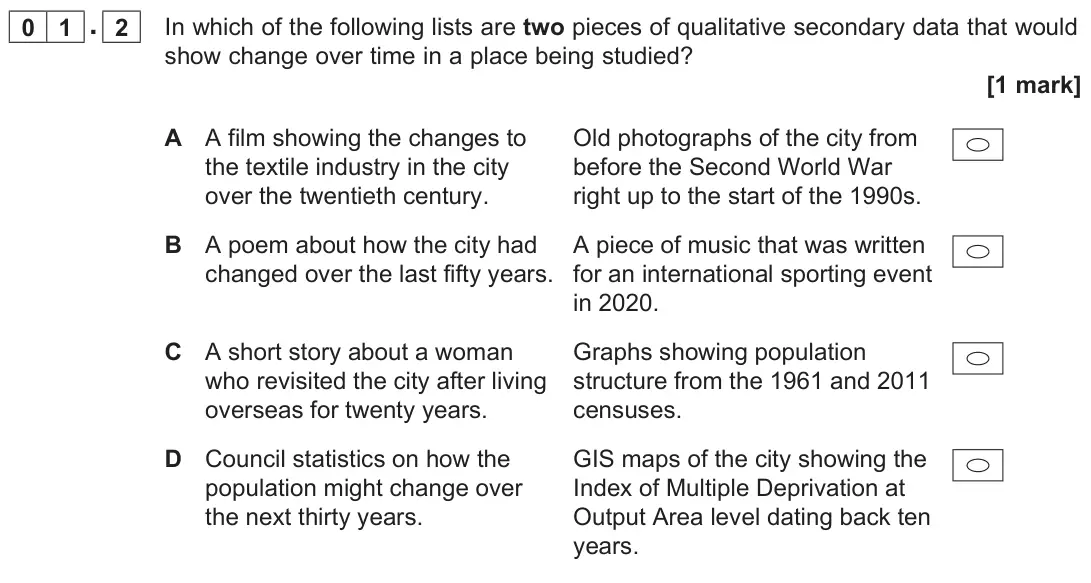
Q01.4
The whole paper ↗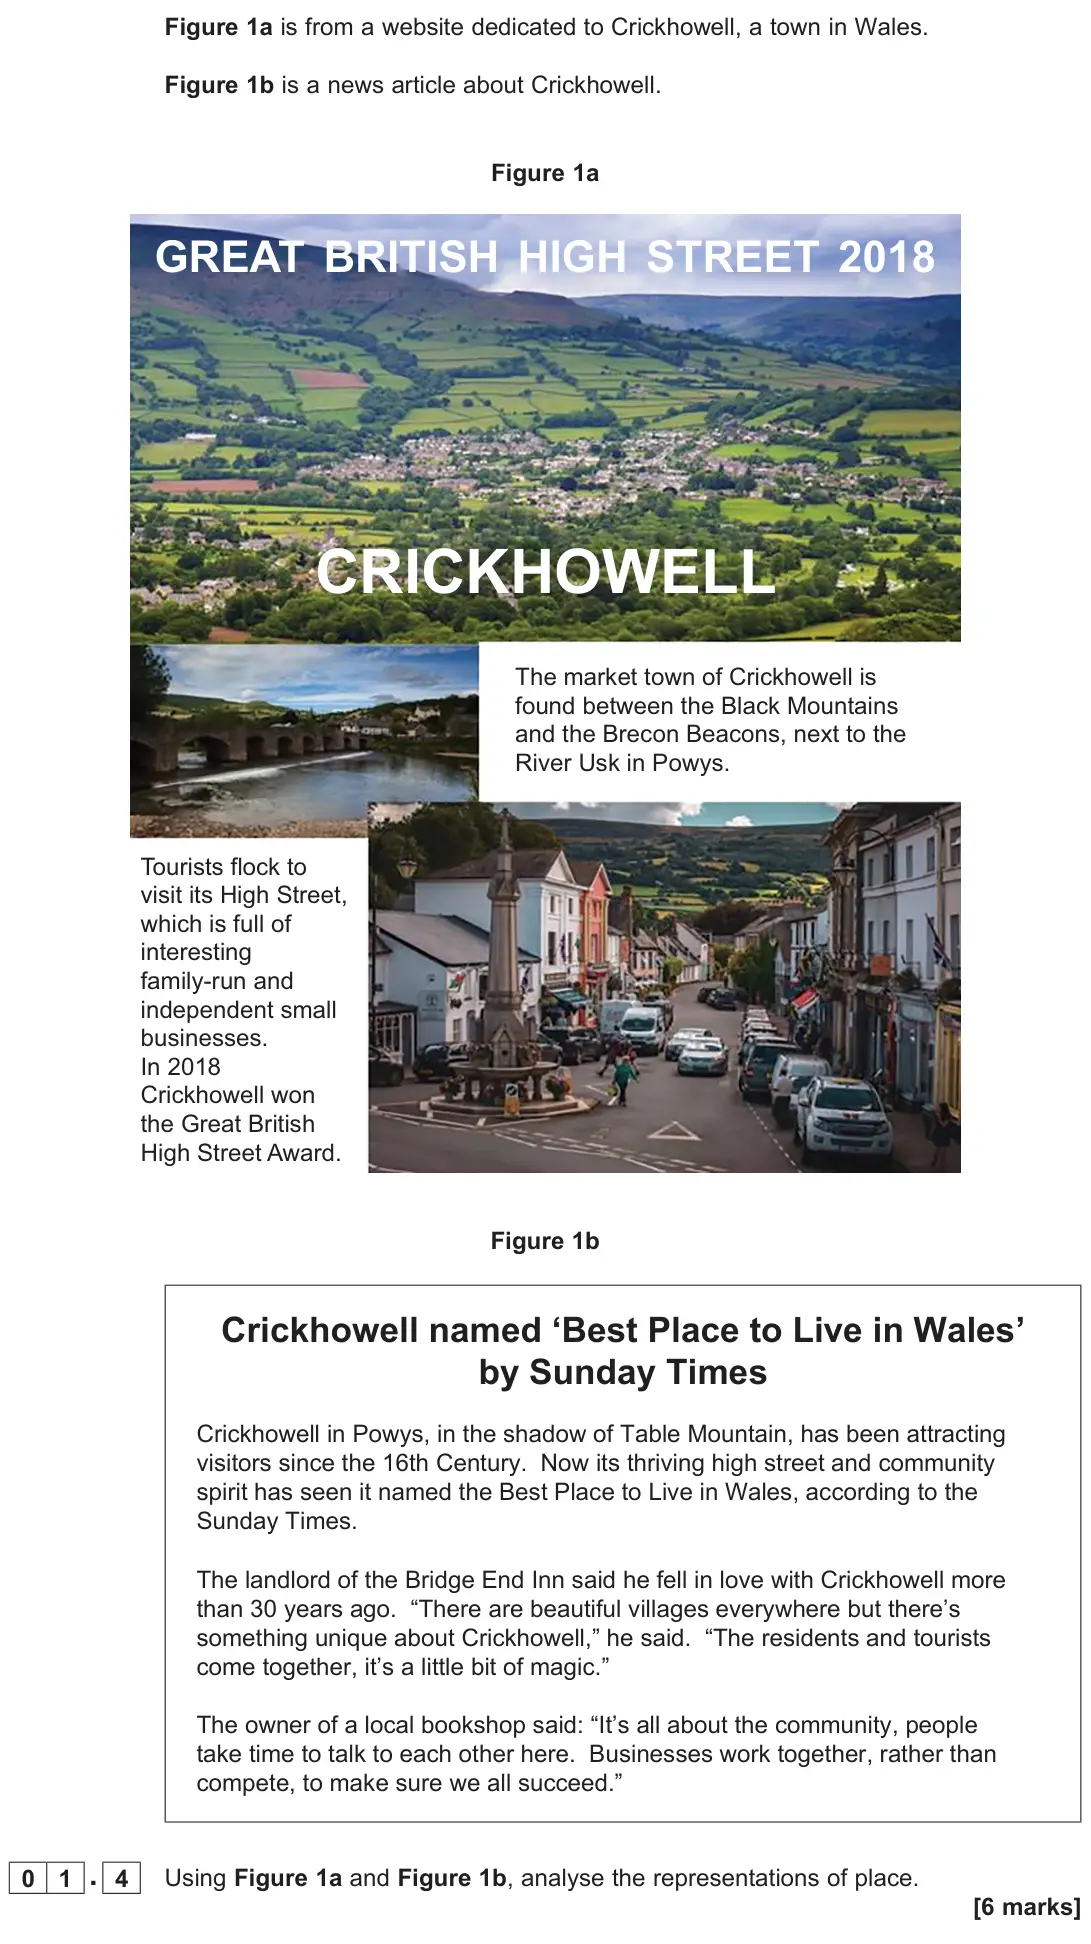
All 21 questions on Quantitative and qualitative skills, as a list
- June 2025, Paper 2, Q02.2 (6 marks): Analyse the information shown in Figure 3. [6 marks]
- June 2025, AS Paper 2, Q01.3 (3 marks): Outline the advantages of using quantitative data when studying how a place has changed over time. [3 marks]
- June 2025, AS Paper 2, Q01.4 (6 marks): Analyse the data shown in Figure 1a and Figure 1b. [6 marks]
- June 2024, Paper 2, Q02.1 (4 marks): Outline how you used a qualitative data source to investigate lived experience in the past in your local place. [4 marks]
- June 2024, Paper 2, Q02.2 (6 marks): Interpret the maps shown in Figure 3a and Figure 3b. [6 marks]
- June 2024, AS Paper 2, Q01.4 (6 marks): Analyse the data shown in Figure 1a and Figure 1b. [6 marks]
- June 2023, Paper 2, Q02.1 (4 marks): Outline how you used one data source to investigate lived experience in your distant place. [4 marks]
- June 2023, Paper 2, Q02.2 (6 marks): Complete Figure 3a by plotting the data for Southville shown in Figure 3b and analyse the data shown in the completed Figure 3a. [6 marks]
- June 2023, AS Paper 2, Q01.2 (1 mark): In which of the following do both pieces of data show the economic characteristics of a place using quantitative sources? [1 mark]
- June 2023, AS Paper 2, Q01.4 (6 marks): Analyse the data shown in Figure 1. [6 marks]
- June 2022, Paper 2, Q02.2 (6 marks): Analyse the changes shown between Figure 3a and Figure 3b. [6 marks]
- June 2022, AS Paper 2, Q01.3 (3 marks): Outline how oral sources, such as songs, can be useful when investigating people’s attachment to a place. [3 marks]
- June 2022, AS Paper 2, Q01.4 (6 marks): Analyse the continuity and change over time shown between Figure 1a and Figure 1b. [6 marks]
- June 2022, AS Paper 2, Q01.5 (9 marks): Assess the view that only qualitative data can represent ‘insider’ perspectives on a place. [9 marks]
- November 2021, Paper 2, Q02.2 (6 marks): Evaluate the usefulness of Figure 3a and Figure 3b in showing change in Ancoats. [6 marks]
- November 2021, Paper 2, Q02.4 (20 marks): With reference to your local place, assess the extent to which qualitative sources (for example songs, artwork) present contrasting images to quantitative sourc
- November 2020, Paper 2, Q02.1 (4 marks): Outline how geospatial data can be used to present place characteristics. [4 marks]
- November 2020, Paper 2, Q02.2 (6 marks): Analyse the relationship between perception and incidence of crime shown in Figure 3a and Figure 3b. [6 marks]
- November 2020, AS Paper 2, Q01.2 (1 mark): In which of the following lists are two pieces of qualitative secondary data that would show change over time in a place being studied? [1 mark]
- November 2020, AS Paper 2, Q01.4 (6 marks): Using Figure 1a and Figure 1b, analyse the representations of place. [6 marks]
- November 2020, AS Paper 2, Q01.6 (20 marks): With reference to a place you have studied, evaluate the usefulness of quantitative data sources such as statistics and maps in representing the lived experienc
Questions, mark schemes and examiner’s reports are © AQA, from their published past papers. Plumi isn’t affiliated with any exam board. Want whole papers? Full past papers.
Rather write your answers by hand on iPad? Plumi marks them against the same mark schemes.