Skip to content

Production possibility diagrams: AQA A‑Level Economics questions

Every AQA A-Level Economics exam question on 4.1.1.5 Production possibility diagrams, 2020–2025, with its mark scheme and examiner’s report.

Find questions686
Calculations
686 questions

  1. Q02

    June 2025 · Paper 3

    The whole paper ↗
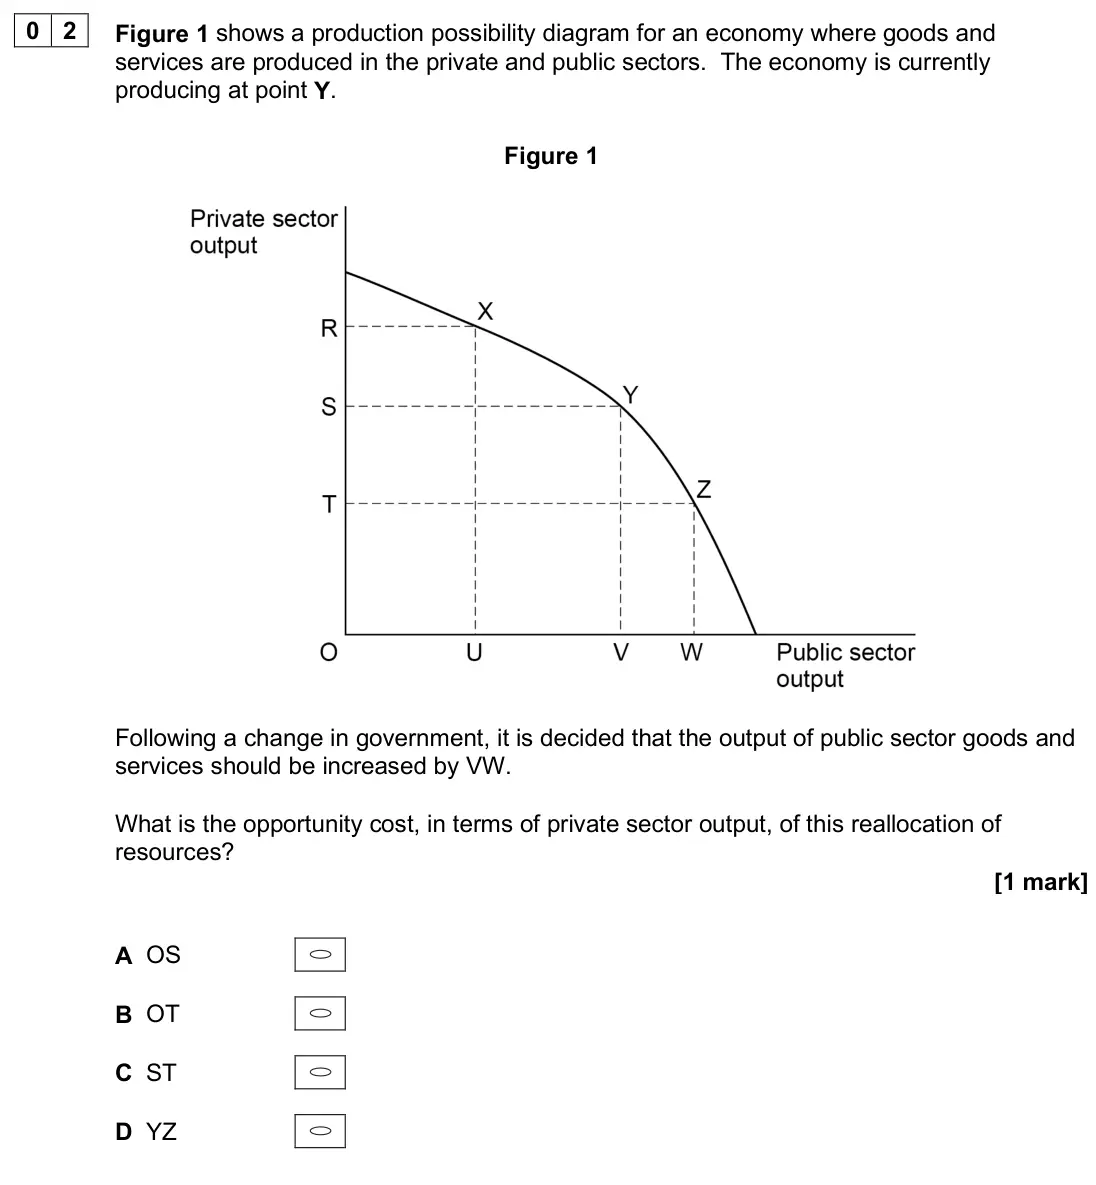
    June 2025 Paper 3, question 02: Figure 1 shows a production possibility diagram for an economy where goods and services are produced in the private and public sectors. The economy is currently
  2. Q13

    June 2025 · AS Paper 1

    The whole paper ↗
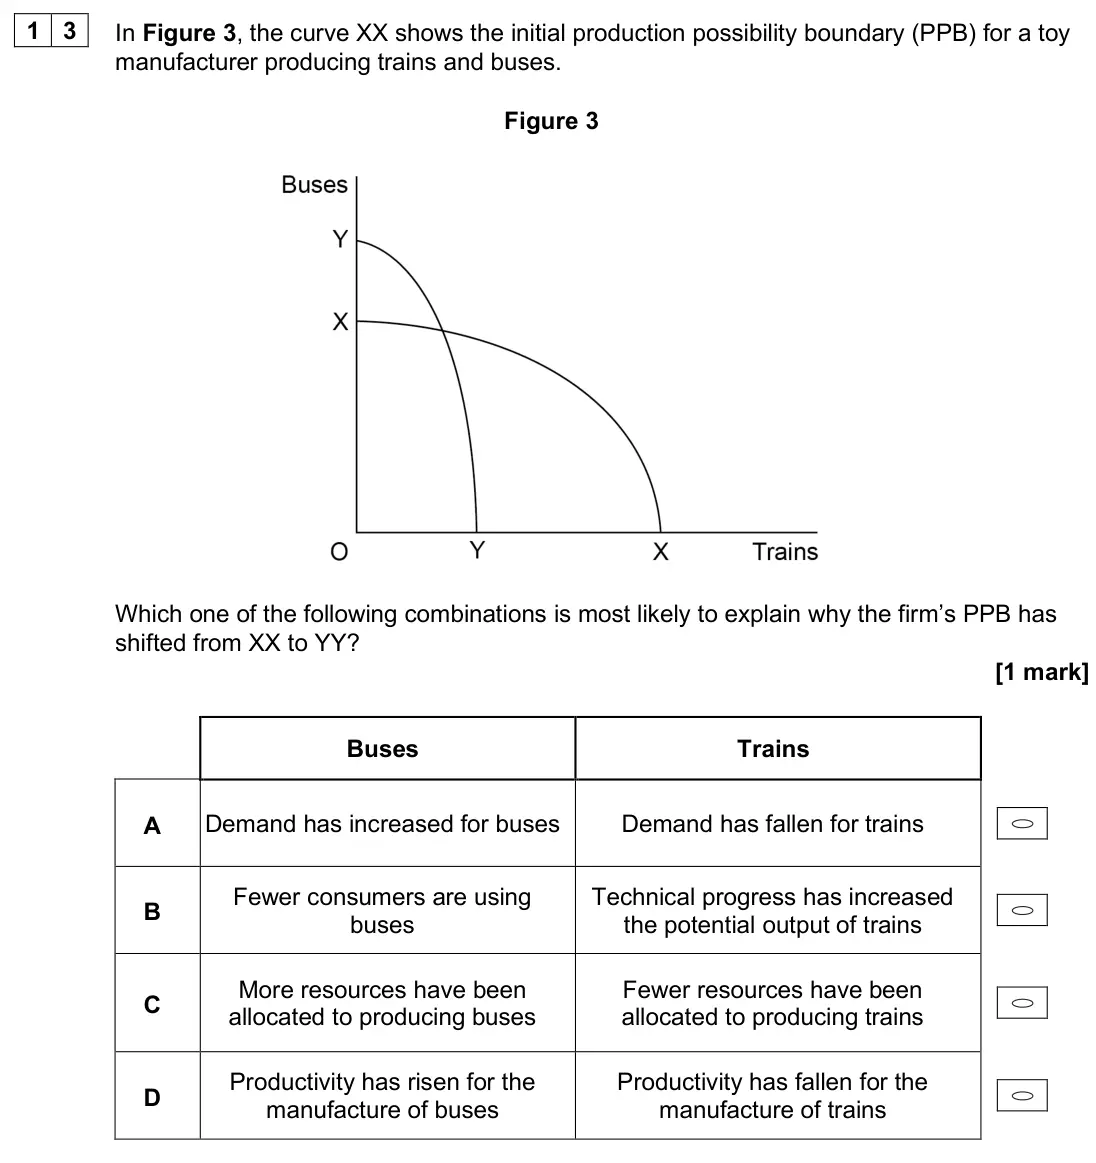
    June 2025 AS Paper 1, question 13: In Figure 3, the curve XX shows the initial production possibility boundary (PPB) for a toy manufacturer producing trains and buses. Figure 3 Which one of the f
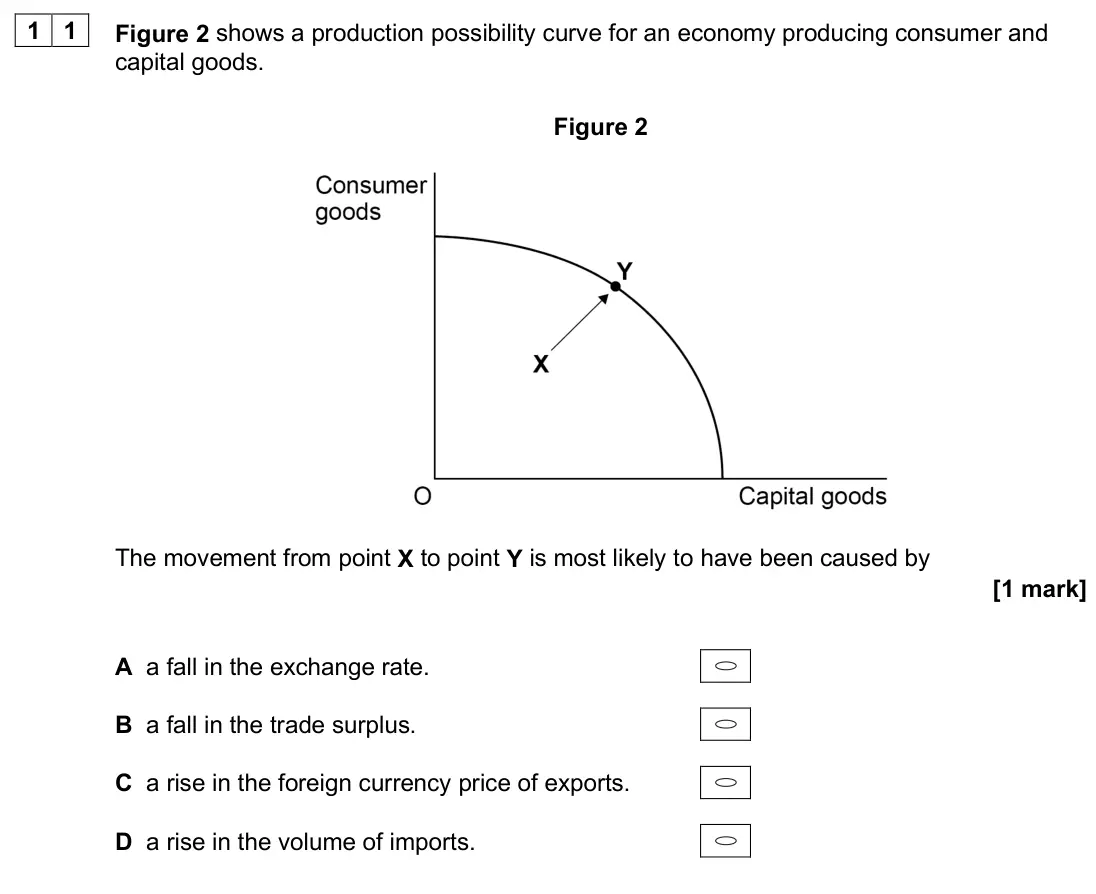
  3. June 2025 AS Paper 2, question 11: Figure 2 shows a production possibility curve for an economy producing consumer and capital goods. Figure 2 The movement from point X to point Y is most likely
  4. Q03

    June 2024 · Paper 3

    The whole paper ↗
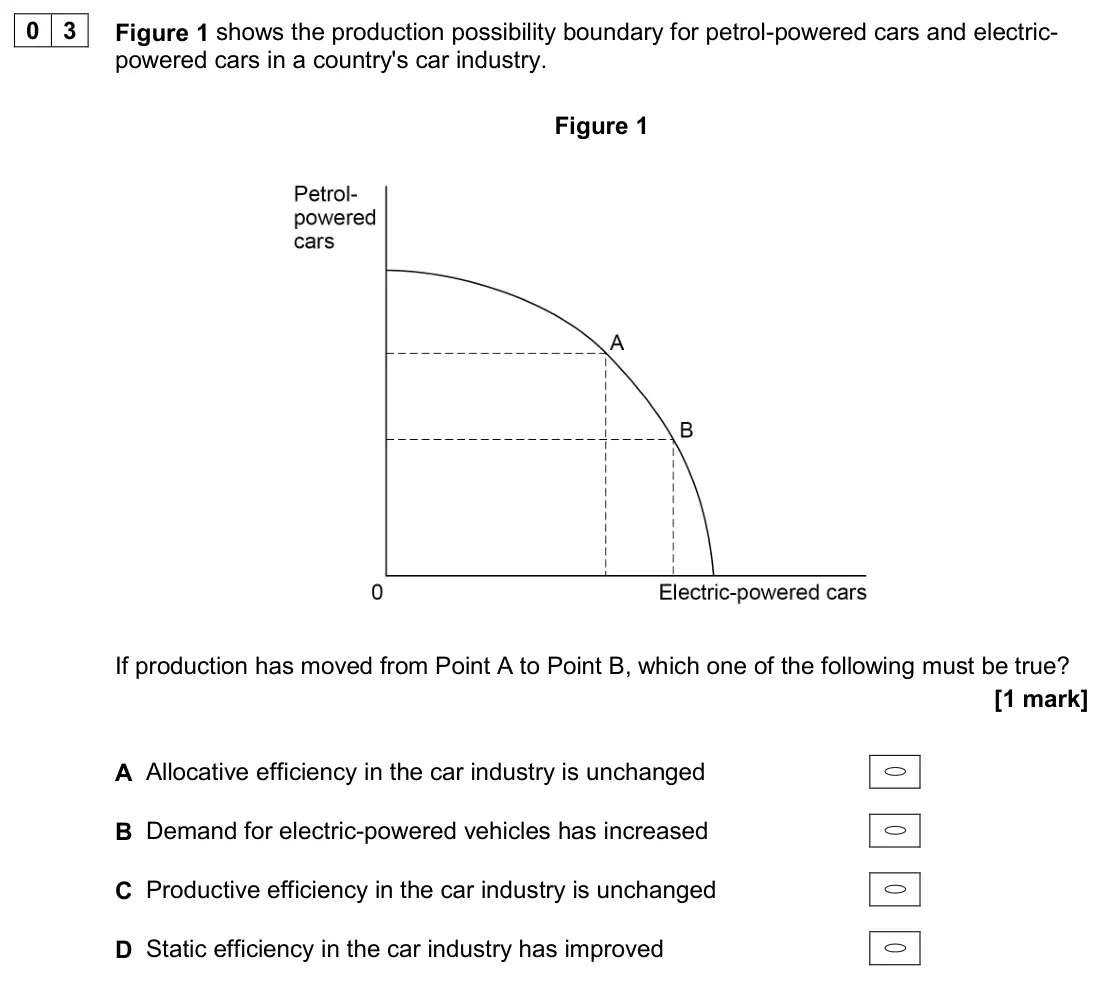
    June 2024 Paper 3, question 03: Figure 1 shows the production possibility boundary for petrol-powered cars and electric- powered cars in a country's car industry. Figure 1 If production has mo
  5. Q24

    June 2024 · AS Paper 1

    The whole paper ↗
    June 2024 AS Paper 1, question 24: A local authority has limited resources to allocate to two services, ‘cleaning beaches’ and ‘other local government services’. Draw a production possibility dia
  6. Q30

    June 2024 · AS Paper 1

    The whole paper ↗
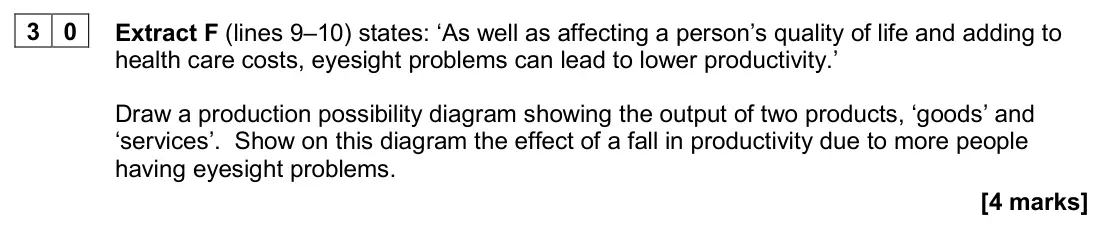
    June 2024 AS Paper 1, question 30: Extract F (lines 9–10) states: ‘As well as affecting a person’s quality of life and adding to health care costs, eyesight problems can lead to lower productivit
  7. Q19

    June 2023 · AS Paper 1

    The whole paper ↗
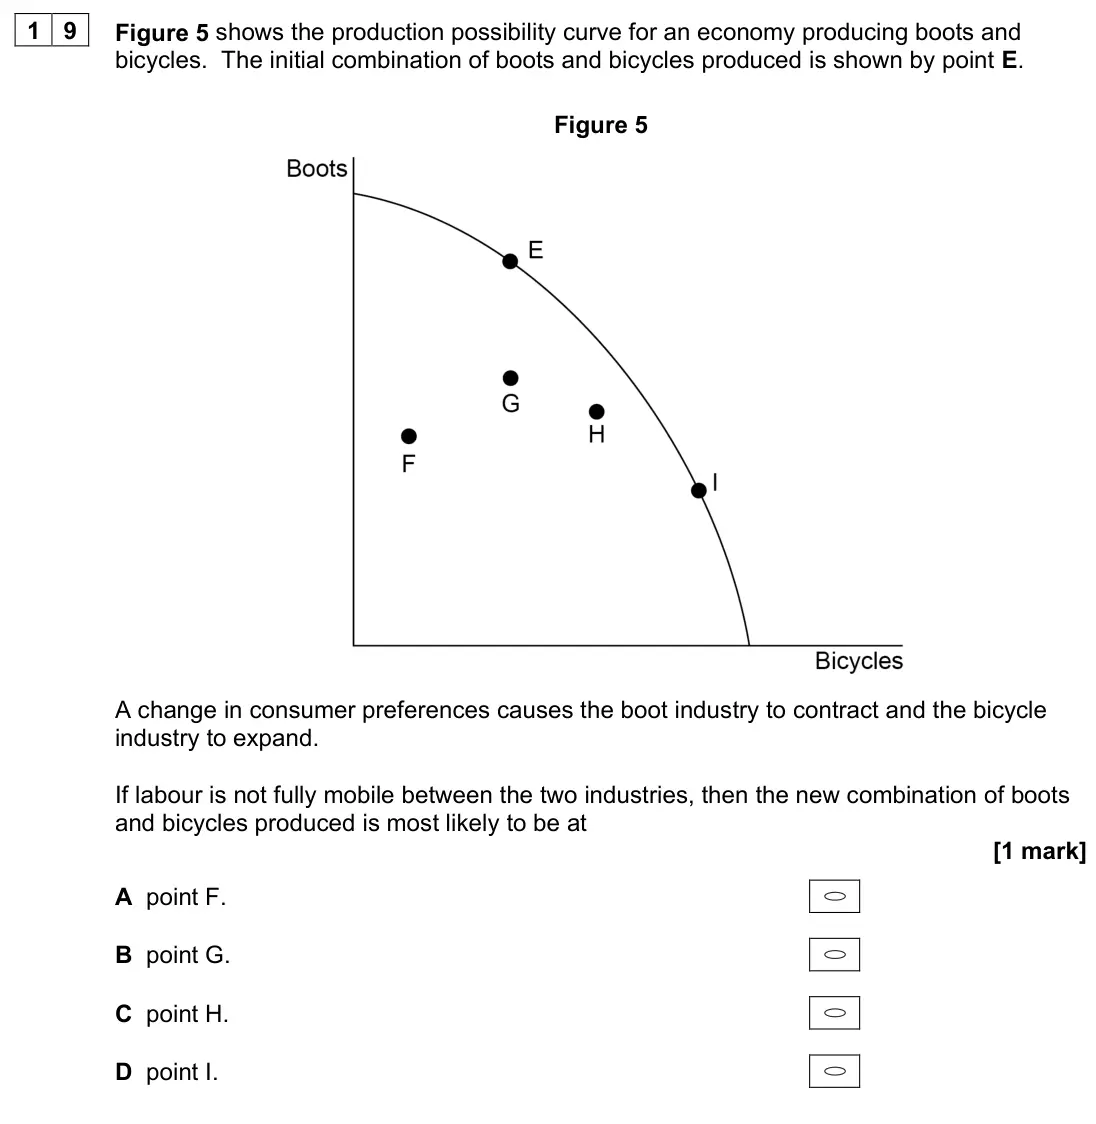
    June 2023 AS Paper 1, question 19: Figure 5 shows the production possibility curve for an economy producing boots and bicycles. The initial combination of boots and bicycles produced is shown by
  8. Q09

    June 2023 · AS Paper 2

    The whole paper ↗
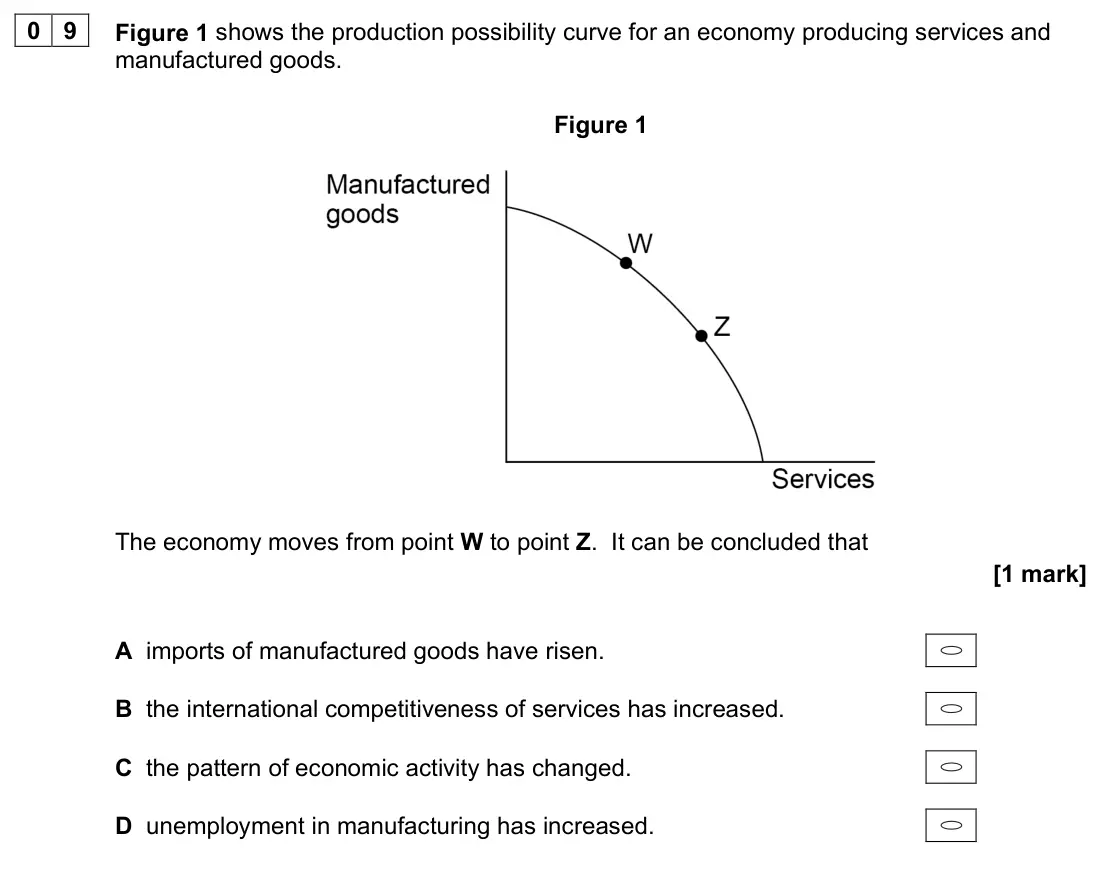
    June 2023 AS Paper 2, question 09: Figure 1 shows the production possibility curve for an economy producing services and manufactured goods. Figure 1 The economy moves from point W to point Z. It
  9. Q03

    June 2022 · Paper 3

    The whole paper ↗
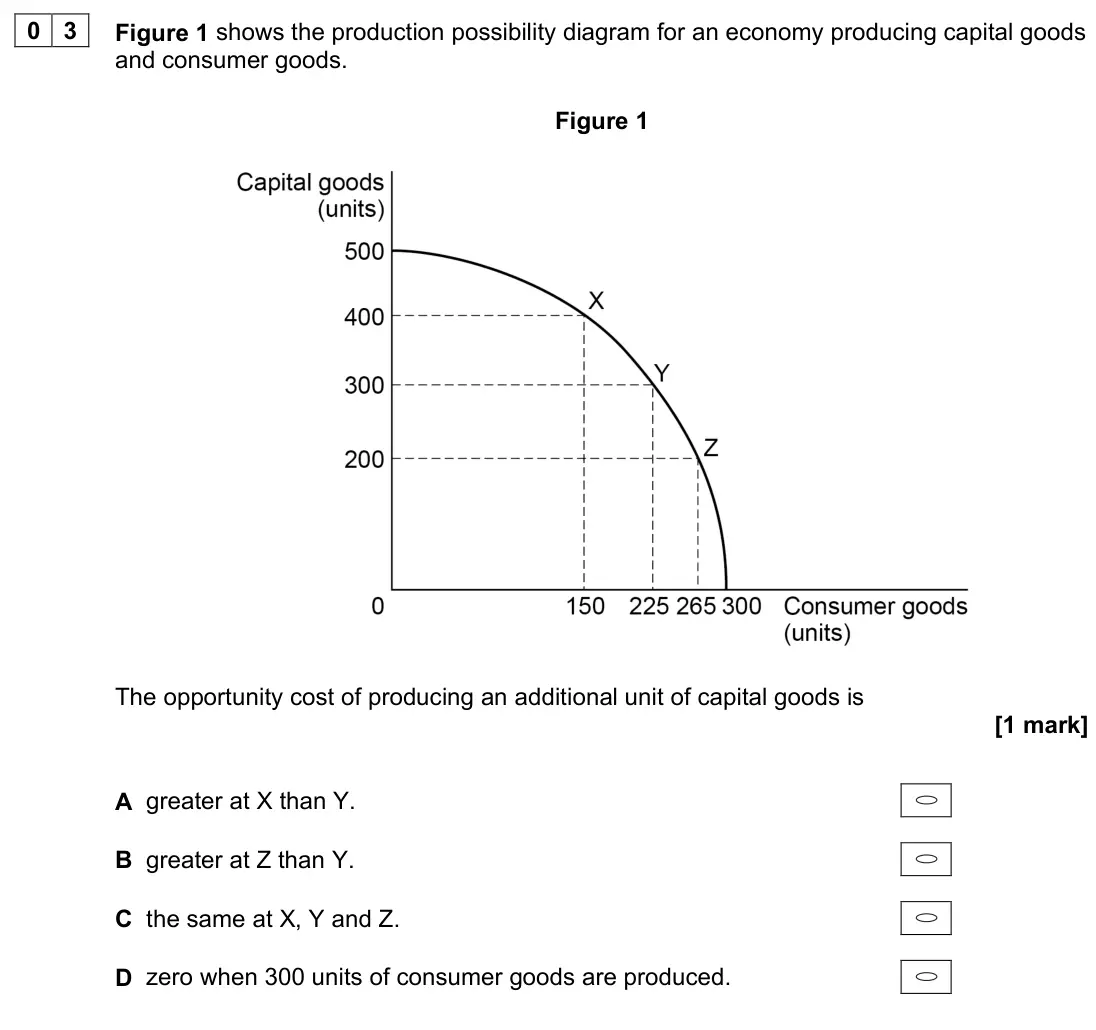
    June 2022 Paper 3, question 03: Figure 1 shows the production possibility diagram for an economy producing capital goods and consumer goods. Figure 1 The opportunity cost of producing an addit
  10. Q06

    November 2021 · Paper 3

    The whole paper ↗
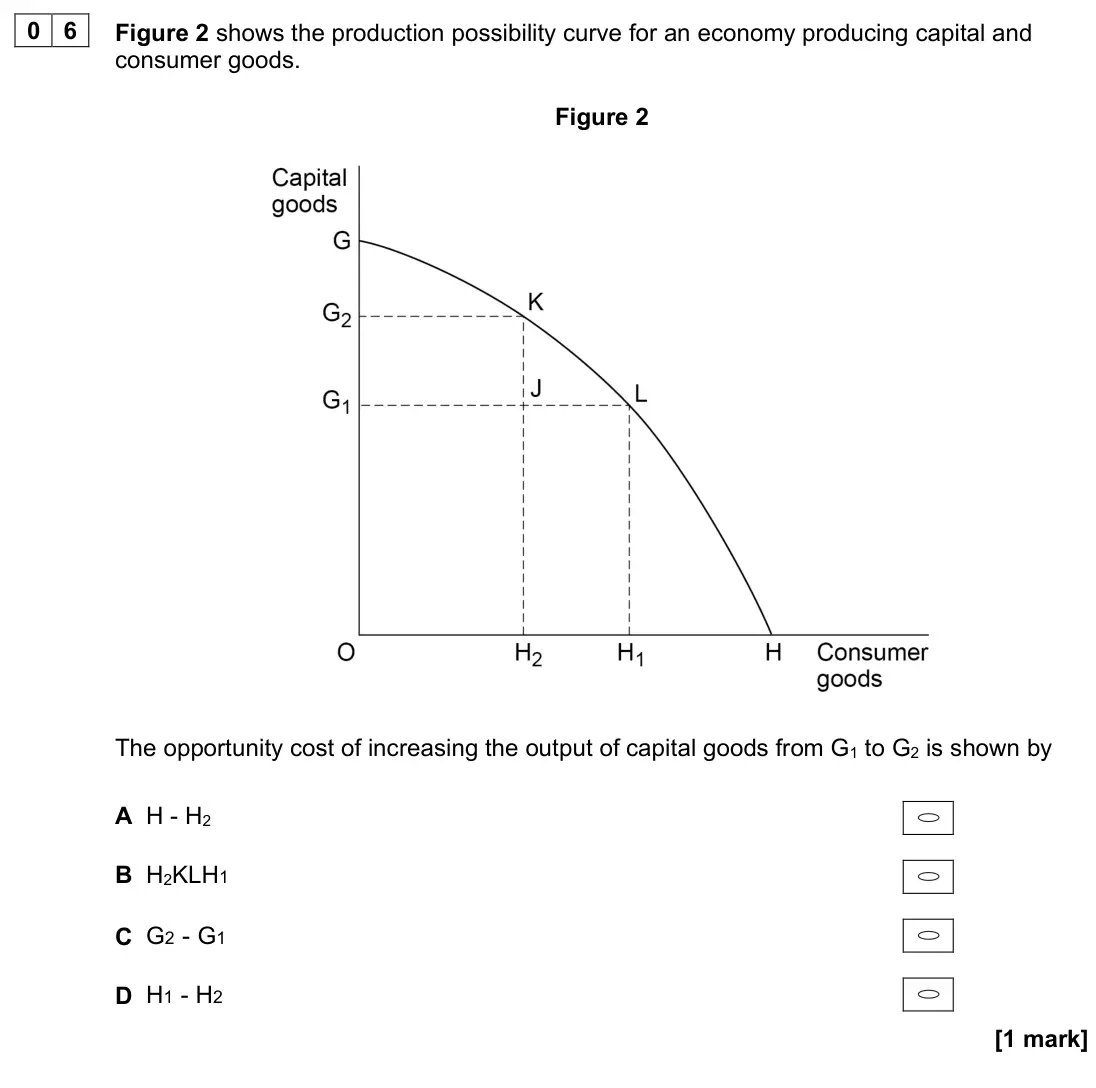
    November 2021 Paper 3, question 06: Figure 2 shows the production possibility curve for an economy producing capital and consumer goods. Figure 2 The opportunity cost of increasing the output of c
  11. November 2020 Paper 1, question 11: Explain how a production possibility diagram can be used to illustrate some features of the fundamental economic problem. [15 marks] Essay 2 The economist Greg
  12. Q07

    November 2020 · AS Paper 1

    The whole paper ↗
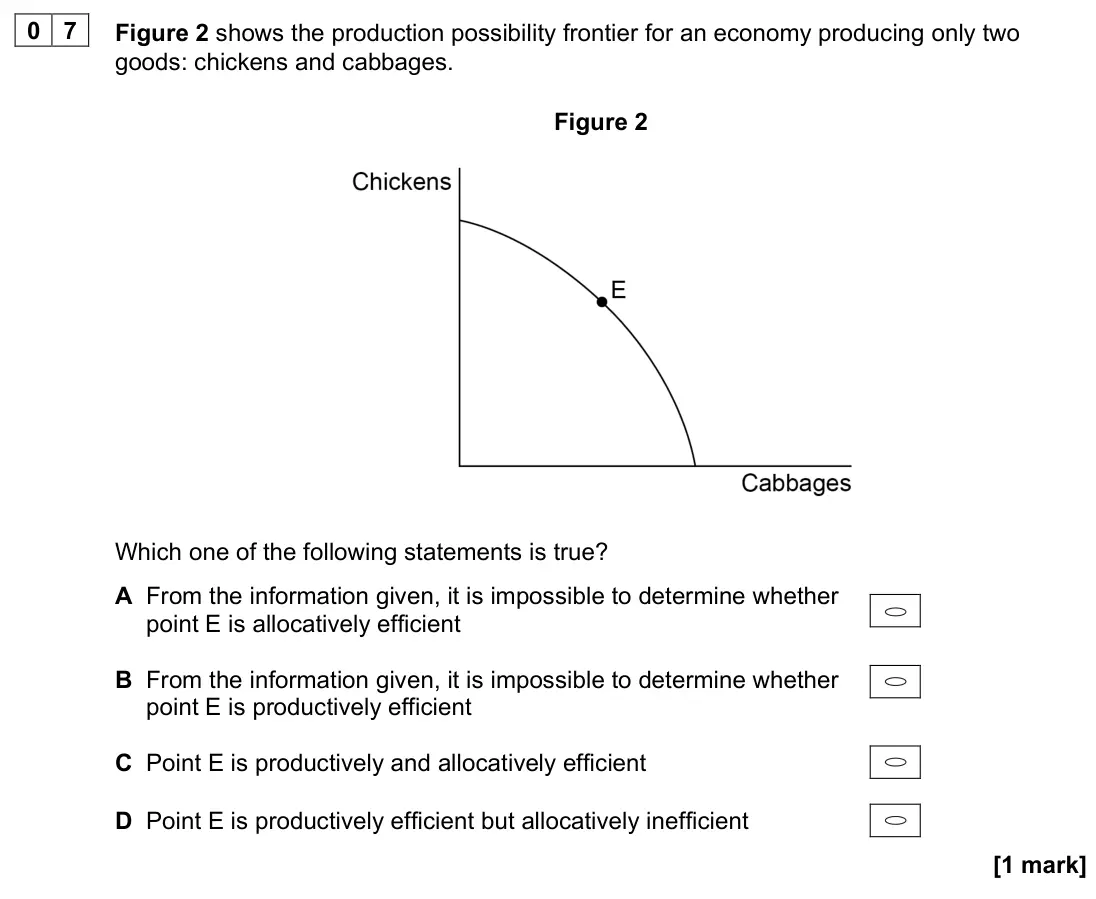
    November 2020 AS Paper 1, question 07: Figure 2 shows the production possibility frontier for an economy producing only two goods: chickens and cabbages. Figure 2 Which one of the following statement
  13. Q24

    November 2020 · AS Paper 2

    The whole paper ↗
    November 2020 AS Paper 2, question 24: Extract B (lines 9–11) states: ‘Taking into account pubs, restaurants and other shops, a further 4042 premises became empty, increasing spare capacity in the ec
  14. November 2020 AS Paper 2, question 30: Extract F (lines 4–5) states: ‘As more workers receive higher in-work income, consumption would be expected to rise, leading to short-run economic growth.’ Draw
All 14 questions on Production possibility diagrams, as a list
  1. June 2025, Paper 3, Q02 (1 mark): Figure 1 shows a production possibility diagram for an economy where goods and services are produced in the private and public sectors. The economy is currently
  2. June 2025, AS Paper 1, Q13 (1 mark): In Figure 3, the curve XX shows the initial production possibility boundary (PPB) for a toy manufacturer producing trains and buses. Figure 3 Which one of the f
  3. June 2025, AS Paper 2, Q11 (1 mark): Figure 2 shows a production possibility curve for an economy producing consumer and capital goods. Figure 2 The movement from point X to point Y is most likely
  4. June 2024, Paper 3, Q03 (1 mark): Figure 1 shows the production possibility boundary for petrol-powered cars and electric- powered cars in a country's car industry. Figure 1 If production has mo
  5. June 2024, AS Paper 1, Q24 (4 marks): A local authority has limited resources to allocate to two services, ‘cleaning beaches’ and ‘other local government services’. Draw a production possibility dia
  6. June 2024, AS Paper 1, Q30 (4 marks): Extract F (lines 9–10) states: ‘As well as affecting a person’s quality of life and adding to health care costs, eyesight problems can lead to lower productivit
  7. June 2023, AS Paper 1, Q19 (1 mark): Figure 5 shows the production possibility curve for an economy producing boots and bicycles. The initial combination of boots and bicycles produced is shown by
  8. June 2023, AS Paper 2, Q09 (1 mark): Figure 1 shows the production possibility curve for an economy producing services and manufactured goods. Figure 1 The economy moves from point W to point Z. It
  9. June 2022, Paper 3, Q03 (1 mark): Figure 1 shows the production possibility diagram for an economy producing capital goods and consumer goods. Figure 1 The opportunity cost of producing an addit
  10. November 2021, Paper 3, Q06 (1 mark): Figure 2 shows the production possibility curve for an economy producing capital and consumer goods. Figure 2 The opportunity cost of increasing the output of c
  11. November 2020, Paper 1, Q11 (15 marks): Explain how a production possibility diagram can be used to illustrate some features of the fundamental economic problem. [15 marks] Essay 2 The economist Greg
  12. November 2020, AS Paper 1, Q07 (1 mark): Figure 2 shows the production possibility frontier for an economy producing only two goods: chickens and cabbages. Figure 2 Which one of the following statement
  13. November 2020, AS Paper 2, Q24 (4 marks): Extract B (lines 9–11) states: ‘Taking into account pubs, restaurants and other shops, a further 4042 premises became empty, increasing spare capacity in the ec
  14. November 2020, AS Paper 2, Q30 (4 marks): Extract F (lines 4–5) states: ‘As more workers receive higher in-work income, consumption would be expected to rise, leading to short-run economic growth.’ Draw

Questions, mark schemes and examiner’s reports are © AQA, from their published past papers. Plumi isn’t affiliated with any exam board. Want whole papers? Full past papers.

Rather write your answers by hand on iPad? Plumi marks them against the same mark schemes.