 plumi
Marginal, average and total revenue: AQA A‑Level Economics questions
Every AQA A-Level Economics exam question on 4.1.4.6 Marginal, average and total revenue, 2020–2025, with its mark scheme and examiner’s report.
Find questions686
Calculations
All 4 questions on Marginal, average and total revenue, as a list
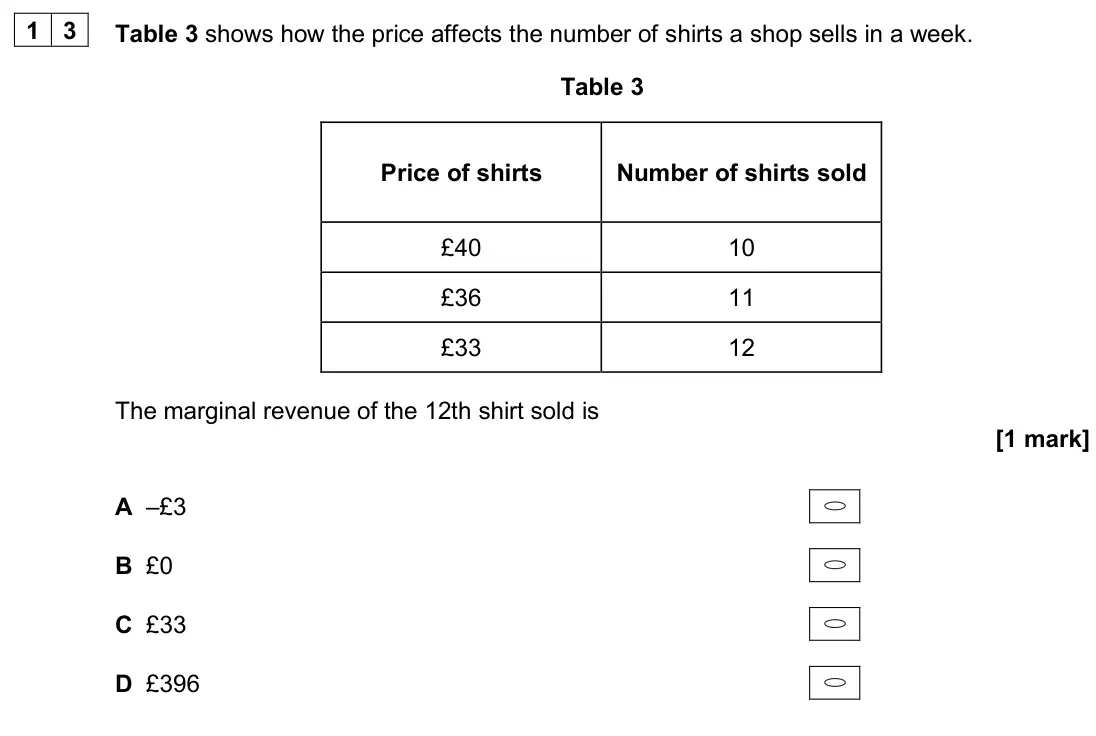
- June 2024, Paper 3, Q13 (1 mark): Table 3 shows how the price affects the number of shirts a shop sells in a week. Table 3 Price of shirts Number of shirts sold £40 10 £36 11 £33 12 The marginal
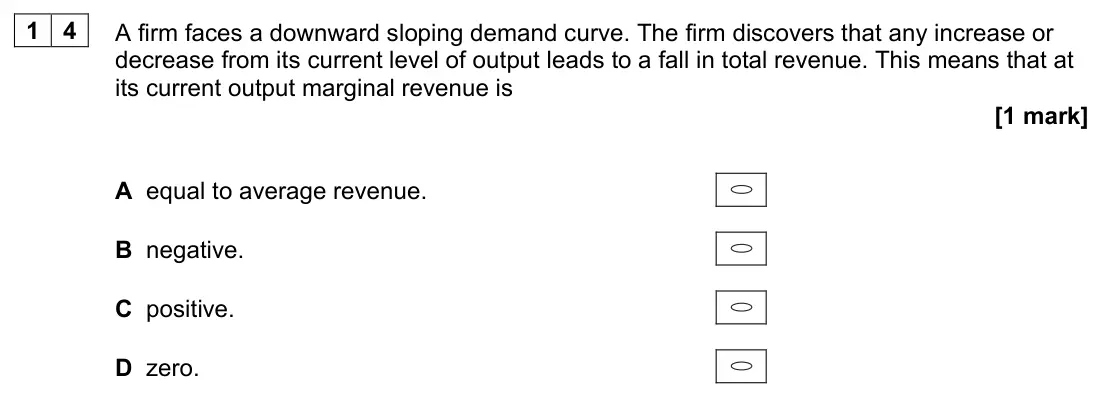
- June 2023, Paper 3, Q14 (1 mark): A firm faces a downward sloping demand curve. The firm discovers that any increase or decrease from its current level of output leads to a fall in total revenue
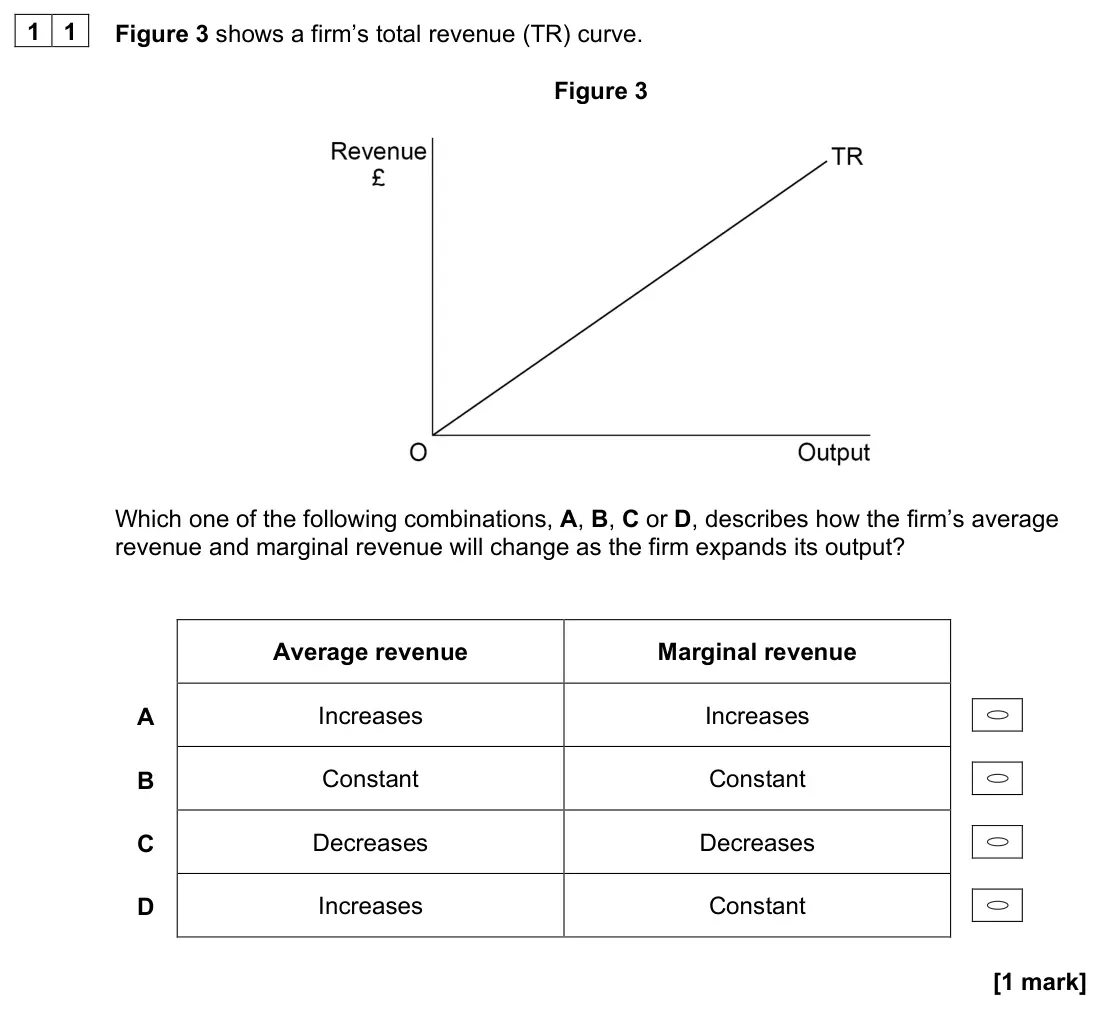
- November 2020, Paper 3, Q11 (1 mark): Figure 3 shows a firm’s total revenue (TR) curve. Figure 3 Which one of the following combinations, A, B, C or D, describes how the firm’s average revenue and m
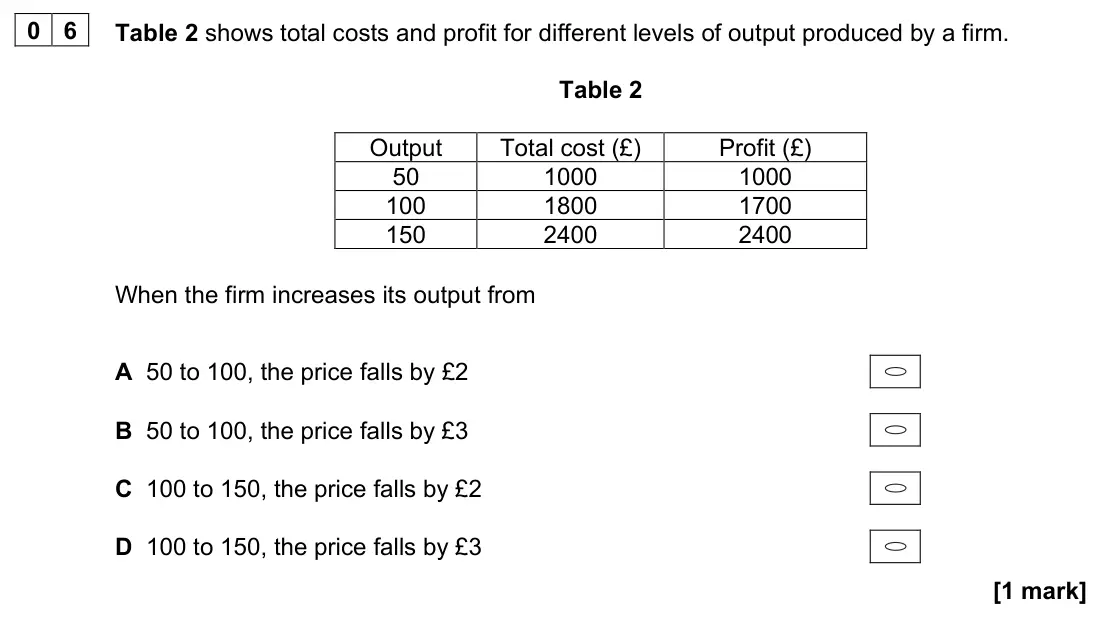
- November 2020, AS Paper 1, Q06 (1 mark): Table 2 shows total costs and profit for different levels of output produced by a firm. Table 2 Output Total cost (£) Profit (£) 50 1000 1000 100 1800 1700 150
Questions, mark schemes and examiner’s reports are © AQA, from their published past papers. Plumi isn’t affiliated with any exam board. Want whole papers? Full past papers.
Rather write your answers by hand on iPad? Plumi marks them against the same mark schemes.