 plumi
Macroeconomic indicators: AQA A‑Level Economics questions
Every AQA A-Level Economics exam question on 4.2.1.2 Macroeconomic indicators, 2020–2025, with its mark scheme and examiner’s report.
Find questions686
Calculations












All 15 questions on Macroeconomic indicators, as a list
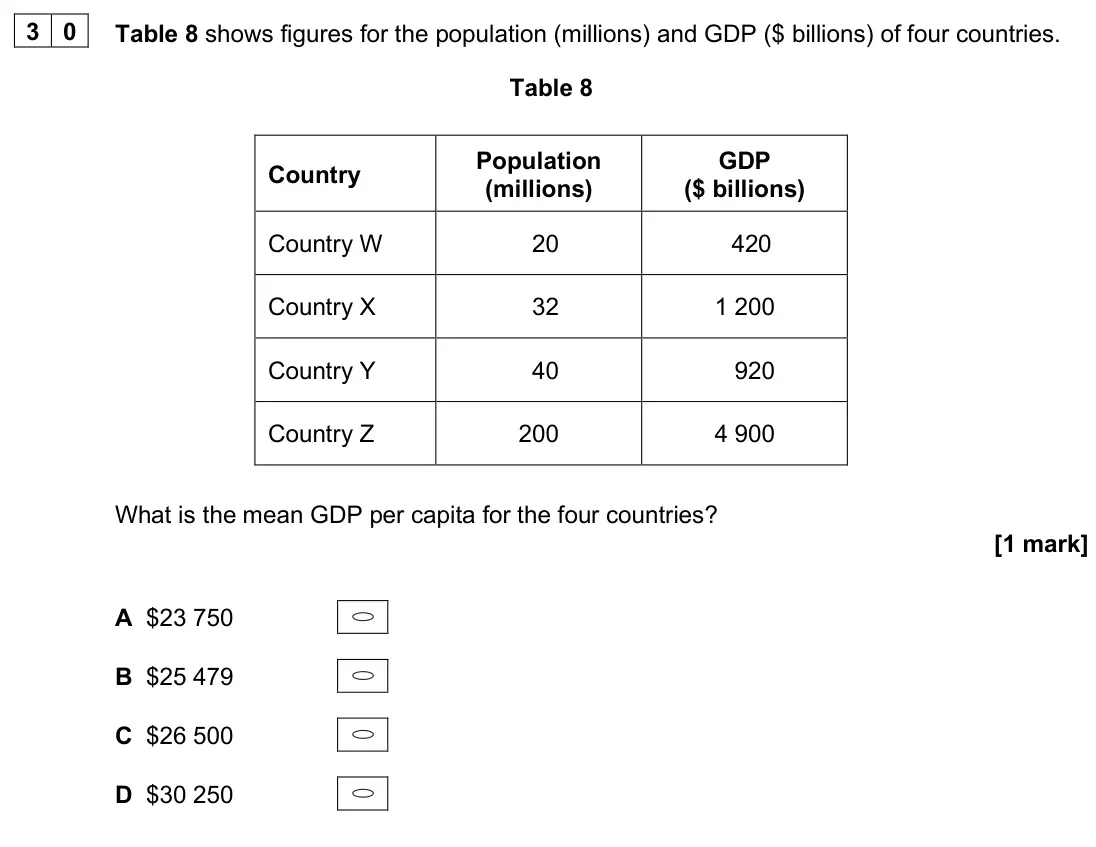
- June 2025, Paper 3, Q30 (1 mark): Table 8 shows figures for the population (millions) and GDP ($ billions) of four countries. Table 8 Country Population (millions) GDP ($ billions) Country W 20
- June 2025, Paper 3, Q31 (10 marks): To what extent, if at all, do the data suggest that the contribution the automotive industry makes to the UK economy has declined significantly since 2015? You
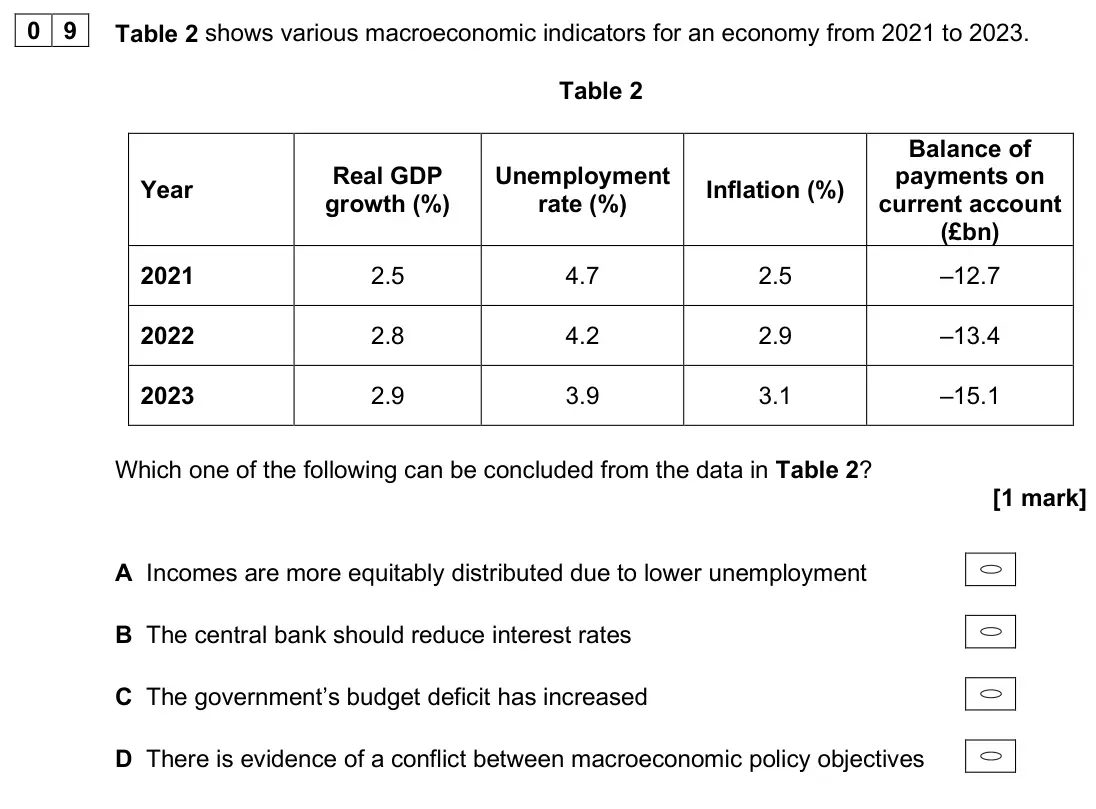
- June 2025, AS Paper 2, Q09 (1 mark): Table 2 shows various macroeconomic indicators for an economy from 2021 to 2023. Table 2 Year Real GDP growth (%) Unemployment rate (%) Inflation (%) Balance of
- June 2024, Paper 2, Q01 (2 marks): Using the data in Extract A, calculate the ratio of the UK’s GDP per hour worked to $1 of GDP per hour worked in Hungary. Give your answer to two decimal places
- June 2024, Paper 2, Q02 (4 marks): Explain how the data in Extract A show that higher productivity may result in higher living standards. [4 marks] Context 1 Total for this context: 40 marks Prod
- June 2024, Paper 2, Q05 (2 marks): Using the data in Extract D, calculate the percentage change in Vietnam’s GDP per capita between the years 2010 and 2021. Give your answer to one decimal place.
- June 2024, Paper 2, Q06 (4 marks): Explain how the data in Extract D show that Vietnam may have outperformed the other selected Southeast Asian economies between 2010 and 2021. [4 marks] Context
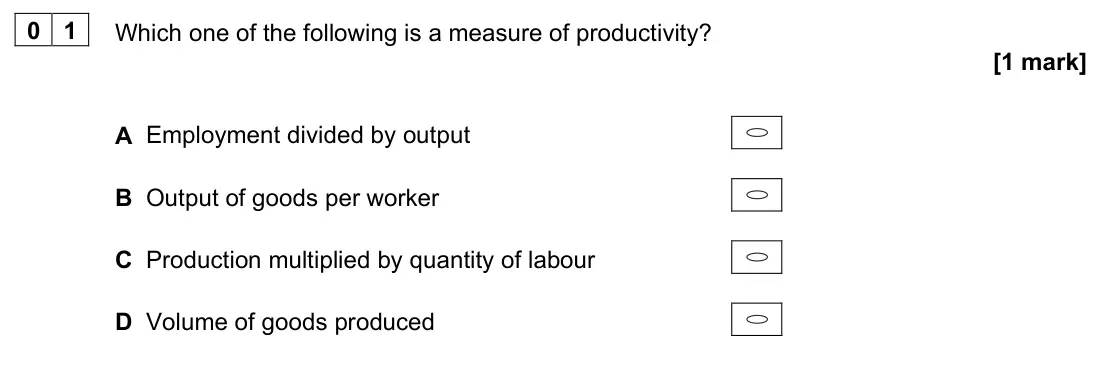
- June 2024, AS Paper 2, Q01 (1 mark): Which one of the following is a measure of productivity? [1 mark] A Employment divided by output B Output of goods per worker C Production multiplied by quantit
- June 2024, AS Paper 2, Q27 (3 marks): Define ‘GDP per capita’ Extract E (line 3). [3 marks] Context 2 Total for this context: 50 marks THE LEVELLING-UP AGENDA Extract D: Employment and inactivity ra
- June 2024, AS Paper 2, Q28 (4 marks): Use Extract D to calculate, as a percentage, how much nominal GDP per capita in the poorest region would need to rise, to equal nominal GDP per capita in the ri
- June 2023, Paper 2, Q02 (4 marks): Explain how the data in Extract A (Figure 2), show that Ireland’s economy performed better than the economies of France and Spain in 2021. [4 marks] Context 1 T
- June 2023, AS Paper 2, Q23 (4 marks): Use Extract A to identify two significant features of the inflation rate over the period shown. [4 marks] Context 1 Total for this context: 50 marks INFLATION E
- June 2022, AS Paper 2, Q22 (4 marks): If UK GDP was equal to £2073 billion in 2017, use Extract A to calculate, to the nearest billion, the value of UK GDP in 2018. [4 marks] Context 1 Total for thi
- June 2022, AS Paper 2, Q23 (4 marks): Use Extract A to identify two significant points of comparison between the growth rates of the UK and Germany over the period shown. [4 marks] Context 1 Total f
- November 2020, Paper 2, Q02 (4 marks): Explain how the data in Extract A (Figure 2) show that the UK has had poor real wage growth since 2008. [4 marks] Context 1 Total for this context: 40 marks Une
Questions, mark schemes and examiner’s reports are © AQA, from their published past papers. Plumi isn’t affiliated with any exam board. Want whole papers? Full past papers.
Rather write your answers by hand on iPad? Plumi marks them against the same mark schemes.